Advances in quantitative XRD analysis for clinker, cements,
and cementitious additions
G. Walentaa)
Central Research Laboratories, Lafarge, 38291 St Quentin Fallavier, France T. Fu¨llmannb)
Laboratory of Construction Materials, Swiss Federal Institute of Technology, 1015 Lausanne, Switzerland 共Received 3 September 2003; accepted 22 December 2003兲
The Rietveld method allows a precise quantitative phase analysis of building materials. Thanks to the development of stable-functioning software and the use of high-performance detectors, a quantitative phase analysis by X-ray, including sample preparation, and measurement and evaluation, can be performed in fewer than ten minutes. This has made it possible to integrate the method into existing laboratory automation systems for process and quality control to provide a means of online monitoring. Due to the completely automated operating principle of the Rietveld software, no additional staff is required and the results are user-independent. The Rietveld method is now being employed in industrial laboratories and also in various cement plants owned by the Lafarge Group as the standard method of quantitative analysis of Portland Cement clinkers and Portland Cements 共CEM I, CEM II A-L兲. © 2004 International Centre for Diffraction Data. 关DOI: 10.1154/1.1649328兴
INTRODUCTION
A reliable, precise, and very reproducible method to quantify the relative phase abundances in the Portland Ce-ment clinker and Portland CeCe-ments is to use X-ray
diffrac-tion 共XRD兲 in combination with the Rietveld method. This
analysis is a powerful method for the determination of quan-titative phase amounts in multiple phase mixtures. In order to apply the method there are two critical requirements: a stable and fast running software system and a precise working con-trol file for each product that will be quantified. During the past few years several authors described the possibility for a quantitative Rietveld analysis of High Alumina Cements, Portland Cements and clinkers, gypsum raw materials, slags, fly ashes, and hydrated cement phases, as well as applica-tions in industrial laboratories and technical centres共Aldrige, 1982; Fu¨llmann et al., 1999; Fu¨llmann et al., 2001; Gut-teridge, 1984; Manias et al., 2000; Mo¨ller, 1995; Piotte
et al., 2002; Struble, 1991; Taylor and Aldrige, 1993;
Walenta et al., 2001; Westphal et al., 2002兲. Using modern software packages it is possible to analyse very complex mixtures of phases in the laboratory and to implement the method into existing automated quality and process control procedures. With suitable hardware a complete quantitative phase analysis of cements and clinkers can be performed in fewer than ten minutes. This time includes measurement and evaluation.
LIMITATIONS OF CONVENTIONAL QUANTITATIVE X-RAY ANALYSIS OF CEMENTS
Bogue calculation
Clinker and cement production is mainly controlled by X-ray fluorescence analysis 共XRF兲, where phase abundance is calculated from the chemical composition using the Bogue
method. Unfortunately the absolute amounts of phase con-tent cannot be determined. It can be, however, used for an estimation of the phase composition. The Bogue calculation does not account for the incorporation of foreign ions within the structures of the main phases, or for the occurrence of different solid solutions. Such an incorporation of ions can also occur as well in Alite, Belite, and the aluminate phase. The composition of the ferrite phase can be described by the solid solution series between C2F and C6A2F共cement chem-istry notation: C⫽CaO, A⫽Al2O3, F⫽Fe2O3, S⫽SiO2). These factors can lead to high errors 共even more than 10 wt.-% for Alite兲 in the quantitative phase analysis.
Conventional method by determination peak height and peak area
The classical method of determining the amount of a phase in a mixture is the comparison of peak height and peak area. The method is used for the analysis of the free lime content in Portland Cement clinker and gives acceptable re-sults in most cases. Nevertheless this method enables not the quantitative analysis of the main clinker phases Alite and Belite. The peaks of both phases overlap nearly completely. Therefore precise results by conventional quantitative XRD analysis cannot be obtained. Preferred orientation effects that can occur in powder samples also limit the method. The sulphate phases in Portland Cement, especially gypsum, is influenced by this effect. A correct quantitative analysis by determining peak heights or peak areas is completely impos-sible in that case.
THE RIETVELD METHOD Working principles
The Rietveld method was developed by Hugo M. Rietveld in 1969 共Rietveld, 1969兲 to refine neutron diffrac-tion data. Later the method was adapted to X-ray diffracdiffrac-tion data by Malmros and Thomas 共1977兲 and by Young et al.
a兲Electronic mail: [email protected] b兲Electronic mail: [email protected]
共1977兲. The principal of the method is, that the intensities calculated from a model of the crystalline structure are fitted to the observed X-ray powder pattern by a least squares re-finement. This is done by varying the parameters of the crys-tal structures and of the peak profiles to minimise the differ-ence between observed and calculated powder patterns. Because the whole powder pattern is taken into consider-ation, problems of peak overlap are minimised and accurate quantitative analyses can be obtained. To assess the success of the refinement, the so-called R-value quantifies the fit be-tween the measured and observed patterns in %. However, in addition to this numerical value it is always useful to con-sider the graphical representation of the calculated and mea-sured pattern and the difference plot. In that way, problems such as incorrect crystal structures or inhomogeneous phases can be easily recognised. To verify the precision and accu-racy of the method it is therefore necessary to compare the results with alternative analysis methods. Detailed informa-tion of the theory and mathematics of the Rietveld method are given by Young共1993兲.
Determination of amorphous materials
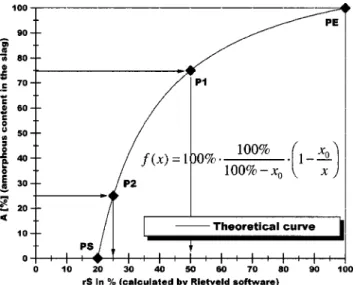
Amorphous phases cannot be detected directly by X-ray diffraction analysis, because they do not produce additional visible reflexes in the X-ray diffraction diagram, but only increase the background. However, by using a defined quan-tity of crystalline standard material it is possible to determine the ratio of crystalline material in the sample to the crystal-line standard and thus calculate the content of amorphous material in the sample. The backward calculation principle is illustrated in Figure 1.
This example shows the theoretical determination of amorphous content by means of 20% by weight of crystalline standard material. A calculated value of crystalline standard of 20% means that the sample contains no amorphous phase and a value of 100% indicates that the sample is completely amorphous. The calculation of the amorphous content can be done using the formula shown in Figure 1, where x0 is the true amount of added standard and x the calculated one.
Experimental
High performance X-ray equipment 共Bragg–Brentano
working principle兲 with efficient X-ray detectors enables short time data acquisition in the range of about 5 minutes. Modern Rietveld programs permit a stable-functioning quan-titative analysis of cement and clinker in less than two min-Figure 1. Determination of amorphous material by crystalline standard.
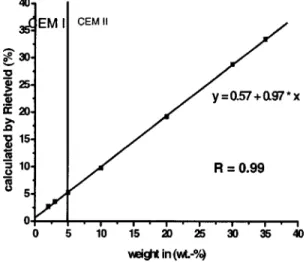
Figure 2. The correlation between the actual weight and Rietveld analysed amount of an amorphous portion in fly ash model mixtures 共Westphal et al.兲.
Figure 3. Quantification of model mixtures: gypsum content.
utes. The precision and accuracy of the calculation is directly linked to the quality of the generated diffractogram and to the so-called control file. This file contains all the informa-tion regarding the crystalline structures of the phases con-tained in the material to be analysed, as well as the
crystal-lographic parameters that needs to be refined. The
quantitative analysis can only take account of phases that are contained in the control file. Precise knowledge of the phase content of the respective material is therefore the prerequisite for application of the Rietveld method. The use of different raw materials and alternative fuels, as well as the occurrence of different burning conditions during the Portland Cement clinker manufacturing process, can result in various modifi-cations of the main and secondary phases. This demands the use of different and suitable adapted structure models. The reliability and accuracy of the control file and thus of the quantification must always be established by quantifying model mixtures with known contents and by comparing with the results of other quantification techniques. A further crite-rion for the analysis precision is the sample preparation. In order to obtain a reproducible result, the sample material should be ground to a specific particle size for analysis by X-ray. However, if the grinding period is too long, the crys-talline structures can be destroyed. An X-ray can then no longer identify particularly the gypsum contained in Portland
Cement. In order to ensure that a precise Rietveld analysis is obtained, it is therefore necessary not only to adapt the con-trol file of the Rietveld software to the respective diffracto-meter and the measuring conditions, but also to optimise the sample preparation.
APPLICATIONS TO BUILDING MATERIALS Quantitative analysis of raw materials
Blast furnace slag and fly ash are used as alternative raw materials for cement and concrete production. In order to guarantee a constant product quality constant it is necessary to control the quality of these raw materials. Westphal et al. 共2002兲 already described the possibility and the precision of a quantitative analysis of these materials. The main chemical compounds of slag are CaO共33%–47%兲, SiO2 共33%–39%兲,
Al2O3 共5%–13%兲, and MgO 共6%–11%兲. The mineralogical
phase composition was determined as melilite 共as an
akermanite–gehlenite solid solution兲, merwinite, quartz, and the amorphous phase. Model mixtures were created for the validation of the quantification. Therefore merwinite and me-lilite were synthesised as pure phases. Simulating the glass phase a completely amorphous slag sample was used. Each of the mixtures was prepared and measured 10 times. Mea-surement uncertainties were estimated by statistical evalua-tion of model mixture quantificaevalua-tion. These uncertainties are approximately⫾1% for each, glass, melilite, and merwinite. Fly ashes build up a more complicated system compared to blast furnace slag. Fly ashes are mainly composed by anhy-drite, hematite, magnetite, mullite, and quartz. The occur-rence of gypsum in fly ash is a hint of wet treatment or storage. Thereafter, Belite, aluminate, calcite, lime, melilite, merwinite, and periclase were integrated to the model sys-tem. For the validation of fly ash phase quantification by Rietveld analysis again model mixtures were produced. Each mixture was prepared and measured ten times.
The results were statistically evaluated. Especially the correlation of the actual weight and analysed amount of an amorphous portion is remarkabley good, as shown in Figure 2. The quantification uncertainty for the quantification of crystalline phases is about ⫾1%; for an amorphous portion,
about ⫾2%.
Quantification of Portland Cement clinker
The Rietveld method is being increasingly employed in industrial applications for the quantitative phase analysis of Portland Cement Clinker and Portland Cement. During the last years many papers were published describing the preci-sion of the quantitative Rietveld analysis of the clinker in the laboratory and in the industrial approach. The precision of analysis was mainly proven by quantifying NIST standards or model mixtures of synthetic phases. To check the accuracy of the Rietveld analysis of the clinker, the results were com-pared with those obtained by optical microscopy and a Bogue calculation. It can be summarized that the Rietveld method is a tool, which is more accurate for a quantitative analysis of the clinker than the Bogue calculation and can be compared with the phase quantification obtained by optical microscopy共point counting兲. In the case of Alite and Belite, the correlation between optical microscopy and the Rietveld Figure 5. Quantification of model mixtures: Calcite content.
results is very good. However, the correlation for aluminate and ferrite is less good. This difference results from the fact that with optical microscopy these two phases, also called the interstitial phase, cannot be well separated. Very often optical microscopy can only give the results for the sum of these phases. An advantage of the Rietveld method compared to optical microscopy is that a distinction between the inter-stitial phases, ferrite and aluminate, is possible with a good accuracy. For checking reproducibility and repeatability of the method, different selected samples were prepared and analysed. The variation within the content of the main phases was in all cases lower than one weight-%.
Quantification of Portland Cement and blended cement
In addition to the clinker phases 共Alite, Belite, ferrite, aluminate, lime, and periclase兲, the different Portland Ce-ments contain sulphate phases, especially gypsum (CaSO4 •2H2O), hemihydrate (CaSO4•0.5H2O), and anhydrite (CaSO4), as well as calcite (CaCO3), Portlandite Ca (OH)2, and quartz (SiO2). Therefore a control file for Port-land Cements 共type CEM I兲 considers these 12 phases. All sulphate phases show a preferred orientation that can cause an overestimation of their quantitative content. However, the Rietveld software corrects this effect.
Figures 3– 6 show quantifications of different model mixtures, demonstrating that the method also very precisely determines the secondary phases. For this purpose, defined quantities of the respective phase were interground into an industrially produced Portland Cement clinker. Calcite was added in quantities of up to 35% by weight, in order to ensure the precision of quantification in the case of cements with high calcite contents 共CEM II A-L兲. All the mixtures were prepared and X-rayed several times.
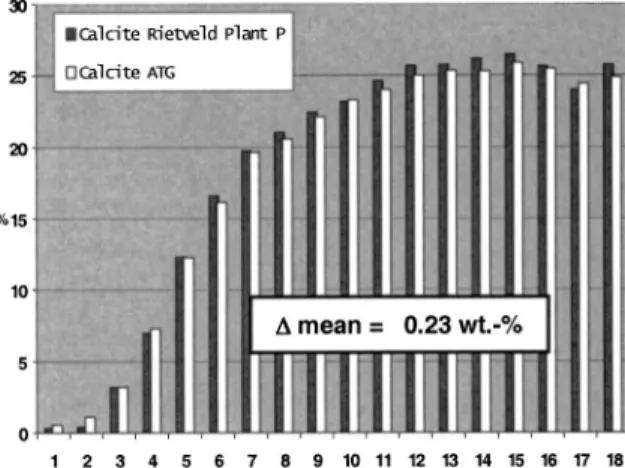
The high precision of the quantitative analysis of gyp-sum and calcite was confirmed by a comparison to other quantification techniques such as DSC 共differential scanning calorimeter兲 and TGA 共thermo-gravimetric analysis兲. There-fore 18 technical produced cements from a Lafarge plant were investigated. Here, too, a close correspondence with the Rietveld results was established. The comparisons are shown in Figure 7 and Figure 8.
Depending on these results, the absolute error related to the phase content of the Portland Cement clinker and Port-land Cement can be estimated, as shown in Table I.
Cements of types CEM II and CEM III contain materials such as fly ash and blast furnace slag up to a content of 35%, respectively, 80% by weight. Apart from the main crystalline phases merwinite and mullite, these materials also contain amorphous constituents. These phases therefore also have to be taken into account when quantifying those cement types. To test the accuracy of quantitative analysis of the amor-phous phase, different model mixtures consisting of Portland Cement, blast furnace slag, and fly ash were analysed. The results are shown in Table II. The added blast furnace slags and fly ashes had different amorphous contents. A compari-son of the expected amorphous contents with the calculated contents showed a close correspondence. By repeating the preparation and measurements, a high reproducibility of the results was also proved.
Figure 7. A comparison of the Rietveld analysis of calcite with TGA.
Figure 8. A comparison of the Rietveld analysis of gypsum with DSC analy-sis.
TABLE I. The maximum error to be expected from a quantitative Rietveld analysis of Portland Cement.
Alite: 65 wt.-%⫾ 2.0 wt.-% Gypsum: 2 wt.-%⫾ 0.4 wt.-% Belite: 15 wt.-%⫾ 1.5 wt.-% Hemihydrate: 1 wt.-% ⫾ 0.3 wt.-% Ferrite: 6 wt.-%⫾ 0.6 wt.-% Anhydrite: 1 wt.-%⫾ 0.3 wt.-% Aluminate: 5 wt.-%⫾ 0.6 wt.-% Calcite: 1 wt.-%⫾ 0.3 wt.-% Lime: 1 wt.-%⫾ 0.3 wt.-% Portlandite: 1 wt.-%⫾ 0.3 wt.-% Periclase: 1 wt.-%⫾ 0.3 wt.-% Quartz: 1 wt.-%⫾ 0.3 wt.-%
TABLE II. A quantitative analysis of the amorphous content of model mix-tures. Mixture Composition Expected amorphous content Calculated amorphous content 1 5% fly ash 95% CEM I 4.9% 7.4% 2 10% fly ash 90% CEM I 9.9% 8.4% 3 15% fly ash 85% CEM I 14.8% 14.5% 4 25% fly ash 75% CEM I 24.7% 26.8% 5 40% slag共1兲 60% CEM I 26.7% 27.3% 6 70% slag共1兲 30% CEM I 46.6% 42.8% 7 40% slag共2兲 60% CEM I 38.0% 36.0% 8 50% slag共2兲 50% CEM I 47.5% 49.5% 9 70% slag共2兲 30% CEM I 66.6% 66.8%
Aspects for quantitative analysis of hydration reactions of cements
The early hydration reaction mechanisms of Portland Cements have been widely studied and reviewed during the last years. The qualitative progress of the hydration is there-fore well known. Although Portland Cements produced by different competitors can be characterized considering their hydration behaviour. Quantitative investigations of the early ages of Portland Cement hydration are poorly cleared. The hydration reactions of mixed systems containing Portland Cements and calcium aluminate cements are not even quali-tatively known very well. Using modern X-ray equipment, it is possible to characterize these early hydration reactions qualitatively. The application of the Rietveld method enables us also to calculate a very precise quantitative analysis of the hydration products. With short measurement times this quan-tifications can be done nearly online so as to follow the progress of hydration ‘‘in-situ.’’ Some advantages of online measurements are shown as follows: hydration needs not to be stopped for analysis; no grinding and sample preparation effects; the same sample preparation can be investigated; several times; the initial first reactions can be followed; and allows us to calculate reactions kinetics.
Because of the small volume of the usual sample holders the sample could dry and therefore the hydration probably stop after a few hours. To avoid this effect a special climatic chamber will be used for the measurements. This climatic chamber enables a relative humidity of 95% at a temperature of 50 °C. At lower relative humidity, even higher tempera-tures共more than 100°兲 can be reached. To avoid carbonation effects all measurements should be done in a CO2 free nitro-gen atmosphere. By quantifying the phase composition of the dry material and the early hydration products, it is possible to find correlations between the phase composition of cements, the hydration behaviour, and the physical properties. Beneath this also the influence of temperature and additives on the hydration reactions can be determined. The Rietveld method enables us to perform quantitative phase analyses as well as to determine solid solutions and the incorporation of foreign ions in phases. This means that storing these hardened ce-ment samples in defined atmosphere also statece-ments about the kinetics, for example, of carbonation effects or sulphate attack can be made.
CONCLUSIONS
The Rietveld analysis is a method allowing the precise and reproducible quantification of the Portland Cement
clin-ker and Portland Cement共CEM I兲. It very effectively deter-mines the sulphate phases gypsum, hemihydrate, and anhy-drite, as well as calcite and Portlandite. The results are comparable with those of TGA analysis, DSC analysis, and microscopic analysis. It also provides a precise quantitative analysis of blast furnace slag and fly ashes, particularly with regard to the amorphous content. The successful quantifica-tion of alternative raw materials and model mixtures pro-vides a solid basis for the quantitative analysis of Portland
Composite Cements and Blast Furnace Cements 共CEM II
and CEM III兲. However, the prerequisite for the applicability of the Rietveld method is an optimised control file that is suited both to the material to be analysed and to the respec-tive X-ray diffractometer. In order to ensure a correct analy-sis, an individual adaptation to the respective place of appli-cation and sample material is therefore essential in every case.
Aldrige, L. P. 共1982兲. ‘‘Accuracy and precision of an X-ray diffraction method for analysing Portland Cements,’’ Cem. Concr. Res. 12, 381– 398.
Fu¨llmann, T., Walenta, G., Scrivener, K. L. et al.共1999兲. ‘‘Quantitative Ri-etveld phase analysis of calcium aluminate cements,’’ World Cem. 6, 91–96.
Fu¨llmann, T., Walenta, G., Gimenez, M., Po¨llmann, H. et al.共2001兲. ‘‘Ana-lytical methods—Part I,’’ International Cement Review January, 41– 43. Gutteridge, W., ‘‘Quantitative X-ray powder diffraction in the study of some cementive materials,’’ The Chemistry and Chemically Related Properties
of Cement, edited by F. P. Glasser, British Ceramic Society, UK, 1984,
pp. 11–23.
Malmros, G. and Thomas, J. D.共1977兲. ‘‘Least squares structure refinement based on powder film intensity data,’’ J. Appl. Crystallogr. 10, 107–111. Manias, C., Retallack, D., Madsen, I.共2000兲. ‘‘XRD for on-line analysis and
control,’’ World Cem. 2, 78 – 81.
Mo¨ller, H. 共1995兲. ‘‘Standardless quantitative phase analysis of Portland cement clinkers,’’ World Cem. 9, 75– 84.
Piotte, M., Walenta, G., Gauthier, M. C., Caspar, J. C., and Fu¨llmann, T.
共2002兲. ‘‘Characterisation of Gypsum,’’ Global Gypsum Mag.
Septem-ber, 20–24.
Rietveld, H. M.共1969兲. ‘‘A profile refinement method for nuclear and mag-netic structures,’’ J. Appl. Crystallogr. 2, 65–71.
Struble, L. J. 共1991兲. ‘‘Quantitative phase analysis of clinker using X-ray diffraction,’’ Cem. Concr. Aggreg. 2, 97–105.
Taylor, J. C. and Aldrige, L. P.共1993兲. ‘‘Full-profile Rietveld quantitative XRD analysis of Portland Cement: Standard XRD profiles for the major phase tricalcium silicate,’’ Powder Diffr. 8, 138 –144.
Walenta, G., Fu¨llmann, T., Gimenez, M. et al. 共2001兲. ‘‘Quantitative Ri-etveld analysis of cement and clinker,’’ Int. Cement Rev. June, 51–54. Westphal, T., Walenta, G., Fu¨llmann, T. et al.共2002兲. ‘‘Characterisation of
cementitious materials,’’ Int. Cement Review July, 47–51.
Young, R. A., Mackie, D., and von Dreele, R. B.共1977兲. ‘‘Application of the patter fitting structure refinement method to X-ray powder diffractometer pattern,’’ J. Appl. Crystallogr. 10, 262–269.
Young, R. A.共1993兲. The Rietveld Method 共Oxford University Press, Ox-ford兲.