Low 24-hour core body temperature as a thrifty metabolic trait driving
catch-up fat during weight regain after caloric restriction
Julie Calonne, Denis Arsenijevic, Isabelle Scerri, Jennifer L. Miles-Chan, Jean-Pierre Montani, and Abdul G. Dulloo
Department of Endocrinology, Metabolism and Cardiovascular System, Faculty of Science and Medicine, University of Fribourg, Fribourg, Switzerland
Calonne J, Arsenijevic D, Scerri I, Miles-Chan JL, Montani JP, Dulloo AG. Low 24-hour core body temperature as a thrifty metabolic trait driving catch-up fat during weight regain after caloric restriction. Am J Physiol Endocrinol Metab 317: E699 –E709, 2019. First pub-lished August 20, 2019; doi:10.1152/ajpendo.00092.2019.—The re-covery of body weight after substantial weight loss or growth retar-dation is often characterized by a disproportionately higher rate of fat mass vs. lean mass recovery, with this phenomenon of “preferential catch-up fat” being contributed by energy conservation (thrifty) me-tabolism. To test the hypothesis that a low core body temperature (Tc)
constitutes a thrifty metabolic trait underlying the high metabolic efficiency driving catch-up fat, the Anipill system, with telemetry capsules implanted in the peritoneal cavity, was used for continuous monitoring of Tc for several weeks in a validated rat model of
semistarvation-refeeding in which catch-up fat is driven solely by suppressed thermogenesis. In animals housed at 22°C, 24-h Tcwas
reduced in response to semistarvation (⫺0.77°C, P ⬍ 0.001) and remained significantly lower than in control animals during the catch-up fat phase of refeeding (⫺0.27°C on average, P ⬍ 0.001), the lower Tcduring refeeding being more pronounced during the light
phase than during the dark phase of the 24-h cycle (⫺0.30°C vs. ⫺0.23°C, P ⬍ 0.01) and with no between-group differences in locomotor activity. A lower 24-h Tcin animals showing catch-up fat
was also observed when the housing temperature was raised to 29°C (i.e., at thermoneutrality). The reduced energy cost of homeothermy in response to caloric restriction persists during weight recovery and constitutes a thrifty metabolic trait that contributes to the high meta-bolic efficiency that underlies the rapid restoration of the body’s fat stores during weight regain, with implications for obesity relapse after therapeutic slimming and the pathophysiology of catch-up growth. caloric restriction; catch-up growth; obesity; thermogenesis; thrifty metabolism
INTRODUCTION
The ability of humans and other mammals to adapt to food scarcity by increasing the efficiency of energy utilization has been well documented in longitudinal studies of experimental starvation and caloric restriction through the demonstration of reduced energy expenditure beyond that explained by losses in body weight and fat-free mass (36, 37). This capacity for energy conservation is viewed as an outcome of regulatory or
adaptive processes that, in response to a deficit in energy intake, suppress thermogenesis, hence resulting in a diminished rate of weight loss and a lower energy cost of weight mainte-nance relative to that predicted by the energy deficit.
This suppression of thermogenesis has also been shown to persist during weight regain and is believed to contribute to the disproportionately faster recovery of fat relative to that of lean tissue (5, 11, 21, 28, 34, 35, 56). Indeed, the demonstrations in a rat model of semistarvation-refeeding in which the refed animals are pair-fed with control animals matched for weight at the onset of refeeding have suggested that the energy spared by suppressed thermogenesis is used to enhance specifically the recovery of the body’s fat reserves but not the recovery of lean tissue (19, 20). Such thrifty metabolism for preferential catch-up fat is thought to have evolved for the rapid restoration of the survival capacity conferred by the fat reserves during an ancestral life characterized by periodic food shortage. It is nowadays an important factor that contributes to the relapse of obesity after therapeutic slimming as well as to the dispropor-tionately higher rate of body fat relative to lean tissue deposi-tion commonly observed in adults recovering weight after malnutrition, anorexia nervosa, or cancer-cachexia (22) and in infants and children during catch-up growth after earlier growth perturbations (17).
Although the mechanisms that underlie the thrifty metabo-lism that drives catch-up fat are not well understood, studies using a rat model of semistarvation-refeeding in which catch-up fat is driven solely by suppressed thermogenesis (13, 19) suggest a potential role for the skeletal muscle rather than brown adipose tissue (BAT) as an important effector site for energy conservation during weight regain. Indeed, although BAT uncoupling protein 1 (UCP1) expression is downregu-lated during the period of caloric restriction, it is rapidly restored to control levels during early refeeding such that there are no differences in BAT UCP1 between refed and control animals during the phase of catch-up fat (48). By contrast, several lines of evidence suggest that skeletal muscle metabo-lism is diminished during the catch-up fat phase, including decreased insulin-stimulated glucose utilization (9, 43) and decreased subsarcolemmal mitochondrial mass and oxidative capacity (12). Furthermore, during both the phases of caloric restriction and catch-up fat, hindlimb skeletal muscles show features of diminished intracellular availability of 3,5,3 =-triio-dothyronine (T3, the biologically active thyroid hormone), delayed contraction-relaxation kinetics, and increased propor-tion of slow-twitch at the expense of fast-twitch muscle fibers
Address for reprint requests and other correspondence: A. G. Dulloo, Dept. of Endocrinology, Metabolism and Cardiovascular System, Faculty of Science and Medicine, Univ. of Fribourg, Fribourg, Switzerland (e-mail: [email protected]).
http://doc.rero.ch
Published in "American Journal of Physiology-Endocrinology and Metabolism 317(4): E699–E709, 2019"
which should be cited to refer to this work.
(14) as well as diminished rate of protein turnover (8), which collectively constitute mechanisms that could underlie dimin-ished skeletal muscle thermogenesis during weight loss and weight regain.
Besides these mechanisms of thrifty metabolism in skeletal muscle, other energy conservation mechanisms may also op-erate. In this context, one possible mechanism of enhanced energy efficiency that has not received much attention is a potential reduction in the metabolic cost of homeothermy, which could be achieved by a modest lowering of core body temperature (Tc). According to Landsberg (39), a lower Tc could be considered a thrifty metabolic trait, conserving energy to better cope with famine but predisposing to fatness. In fact, it has long been known that Tcfalls in response to starvation and contributes to the adaptive fall in energy expenditure during weight loss (3, 4, 49). Furthermore, hibernation and the occurrence of spontaneous daily torpor as well as cold- and fasting-induced torpor observed in many rodents are examples of strategies used by mammals to conserve energy by lowering Tc(1, 31, 55).
Here we address, using this rat model of semistarvation-refeeding, the question as to the extent to which a lower Tc, as a thrifty metabolic trait during caloric restriction, persists during refeeding and may thus contribute to the phenomenon of preferential catch-up fat. Using a state-of-the-art approach to assess Tcthrough the use of abdominally implanted telemetry pills (which allow continuous monitoring of Tc over weeks), we report here that the fall in Tc in response to caloric res-triction persists during the catch-up fat phase of refeeding conducted at typical laboratory room temperature (22°C) or at thermoneutrality (29°C).
MATERIALS AND METHODS
Animals. Male Sprague-Dawley rats (Elevage Janvier, Le Genest Saint Isle, France), 6 wk old, were acclimatized to room and cage environments for at least 5 days before the start of each experiment. They were caged singly in a controlled room (22⫾ 1°C) with a 12:12-h light-dark cycle and maintained on a commercial pelleted chow diet (Provimi Kliba, Switzerland) consisting, by energy, of 24% protein, 66% carbohydrate, and 10% fat and had free access to tap water. Animals were maintained in accordance with the regulations and guidelines of the Department of Medicine, University of Fribourg, for the care and use of laboratory animals; all experimental procedures were performed under conditions approved by the Ethical Committee of the State of Fribourg Veterinary Office.
Experimental design. Two separate experiments were performed according to designs depicted in Fig. 1. The experiments in the rat were conducted in the age range of 7–12 wk, i.e., during a period when spontaneous growth is characterized by a linear rate of weight gain with ad libitum daily food intake relatively constant (Fig. 1A). This pattern of food intake in spontaneously growing Sprague-Dawley rats under conditions in our laboratory has been reported previously (57) and is also observed in the present study (Fig. 1B).
In experiment I (Fig. 1, B and C), after a housing acclimatization period of 1 wk followed by another week of postsurgical recovery, two groups of rats (n⫽ 10) housed at 22°C were either fed ad libitum on the chow diet or food restricted for 2 wk at 50% of the chow intake of ad libitum-fed rats; this level of food restriction has repeatedly been shown to result in growth arrest, i.e., without significant gain or loss in body weight and lean mass but with a 50% reduction in body fat relative to the onset of semistarvation (13, 19, 57). At the end of this semistarvation (SS) period corresponding to day 0 of refeeding (Fig. 1B), half of the rats in each group were killed for the analysis of initial
body composition before the refeeding phase. The remaining ad libitum-fed rats (n⫽ 5), referred to as age-matched (AM) control rats, continued to be fed ad libitum, whereas the remaining semistarved rats (n⫽ 5) were refed the chow diet and referred to as the semistarved-refed (SS/RF) group; these SS/RF animals were semistarved-refed at a level approximately equal in metabolizable energy (ME) content to the spontaneous food intake of a third group of rats (n⫽ 5) matched for weight relative to the SS/RF group at the onset of refeeding and referred to as the weight-matched (WM) control group; another group of WM control rats of similar mean body weight (n⫽ 5) were killed for the analysis of body composition before the refeeding period. During the phase of refeeding (days 0 –16; Fig. 1B), the SS/RF group therefore consumed, on a day-to-day basis, the same amount of food energy as the WM control group fed ad libitum. Under these condi-tions, previous work in our laboratory has repeatedly demonstrated that SS/RF animals showed a similar gain in lean mass but an about two- to threefold increase in body fat gain compared with control rats over a period of 2–3 wk, because of 10 –13% lower energy expendi-ture resulting from suppressed thermogenesis (8, 13, 19, 22–24, 42). These fundamental aspects of this rat model in which catch-up fat results from a high efficiency of fat deposition (relative to both control groups) are confirmed here: 1) The semistarvation resulted in growth arrest, with body weights of the food-restricted rats (between 235 and 240 g) only slightly and nonsignificantly reduced relative to their weights at the onset of the food restriction period (Fig. 1B). 2) Comparison of body composition at the end of the 2-wk period of growth arrest due to semistarvation shows that the SS animals have significantly lower body fat (⫺50%, P ⬍ 0.01) than WM control animals, but they did not differ in dry lean mass (Fig. 1B, right, time point 0). 3) During the refeeding period, while the gain in lean mass was similar in all groups (Fig. 1B), the refed (SS/RF) animals showed a twofold increase in body fat relative to the control groups, this preferential catch-up fat (relative to control) being explained by a high energetic efficiency for fat deposition (Table 1).
In experiment II (Fig. 1D), after 1 wk of housing acclimatization and 1 wk of postsurgical recovery followed by 2 wk of semistarvation, the semistarved animals (n⫽ 7–8) were refed isocalorically to WM control animals for a period of 21 days. During the different periods in this experiment, the laboratory room temperature was maintained either at 22°C or at 29°C as depicted in Fig. 1D.
In both experiments I and II, core body temperature (Tcrecording)
was measured continuously while 24-h locomotor activity monitoring was performed at two different time points indicated in Fig. 1, C and D, for experiments I and II, respectively.
Surgery and continuous core body temperature monitoring. The DSI Anipill system (BodyCap, Caen, France) was used for con-tinuous monitoring of Tc. Three days after arrival of the animals at
our laboratory, the capsules were implanted surgically under gen-eral anesthesia after subcutaneous injection of ketamine-xylazine-acepromazine (60, 8, and 2 mg/kg, respectively). Capsules were placed into the abdominal cavity. Incision was closed with resorb-able inner suture and nonresorbresorb-able outer suture. Moreover, to prevent any pain due to surgery, analgesic injections were per-formed after surgery and twice per day for 3 days after surgery (Rimadyl 5 mg/kg). Continuous monitoring of Tcat 5-min intervals
was performed in the rats during an acclimatization period of 1 wk, followed by 2 wk of semistarvation and then controlled refeeding for 2–3 wk.
Ex vivo capsule calibration. All telemetry capsules used in this study were validated for accuracy against mercury (Hg) thermometers (range 34 – 40°C; VWR, Dietikon, Switzerland) before implantation in the animals as well as after their removal from the animals at the end of the experiment; the calibration procedures have been described in detail previously (44). Briefly, capsules were compared against the Hg thermometers, all placed in a digital water bath (2.6 liters; VWR, Dietikon, Switzerland), and a stepwise increase in temperature was performed from 35 to 40°C with a period of stabilization of 5– 8 min
Fig. 1. Design of experiments. A: the growth profile and daily food intake of male Sprague- Dawley rats (mean⫾ SE; n ⫽ 10) maintained on standard chow diet ad libitum between age 3 and 25 wk under conditions of our laboratory (57); the dotted rectangle encloses the age range (7–11 wk) and growth period
pertaining to our studies of food restriction and refeeding and during which the rats show rapid increases in body weight (P⬍ 0.001). Within this age range of
7–11 wk, food intake was not significantly different across time, such that providing half the chow daily corresponds to 50% reduction of ad libitum food intake
throughout this period [reproduced from Yepuri et al. (57) with permission]. B: the growth profile and food intake (g chow/day) of the 3 groups of animals (n⫽
5/group) in experiment I during the phases of acclimatization, semistarvation, and refeeding (days 0 –16). C and D: for experiments I and II, respectively, the various periods (acclimatization, semistarvation, and refeeding), time points for capsule calibration, surgery for capsule implantation, and the periods of core body
temperature (Tc) recording and locomotor activity (A) monitoring. AM, age matched; d, day, SS/RF, semistarved and then refed; WM, weight matched.
after each 1°C increase in temperature. Recordings were taken during the stabilization period, every minute for 8 min. All investigations (including calibrations) were carried out by the same investigator.
Locomotor activity. Locomotor activity was recorded continuously for two consecutive days at two different time points during each of the experiments with an in-house-built activity monitoring system that utilizes infrared diode system and calculation of center of gravity. Briefly, for monitoring locomotor activity, an animal cage with transparent walls and housing an individual rat was placed inside of a metallic rectangular frame presenting 24 infrared light-emitting di-odes (LEDs) at 150-mm intervals in the length axis and another 24 LEDs in the width axis at 80-mm intervals. On the opposite side of each axis, 24 light-sensitive phototransistors detected whether the infrared light transmitted signal was interrupted by the animal cross-ing its path. All diodes were scanned sequentially twice a second, allowing us to know the position of the animal twice a second. From the interrupted beams, a global center of gravity was calculated. The displacement of this center of gravity over time would give the path traveled by the animal during the experiment.
Body composition analysis. After the animals were killed, the whole carcasses were dried to a constant weight in an oven maintained at 70°C. They were subsequently homogenized, and aliquots were stored in desiccators for later analysis of total fat content by the Soxhlet extraction method (25). The dry lean mass was calculated by subtracting total body fat and body water content from body weight, and the protein mass was calculated as follows: protein mass (g)⫽ dry lean mass (g)⫻ 0.8, as detailed previously (13, 19). Changes in body composition (fat, protein, energy) over the refeeding period were determined by subtracting the mean values obtained for each group killed before the onset of refeeding (the initial body composition) and the values obtained at the end of the refeeding period (the final body composition).
Energy balance and energetic efficiency calculations. Energy bal-ance measurements were conducted during refeeding by the compar-ative carcass technique over periods during which ME intake was monitored continuously, and energy expenditure was determined as the difference between energy gain and ME intake. Body energy gain, fat gain, and protein gain during the period of refeeding were obtained as the difference between the final and initial values (with the latter values estimated from values obtained from the subgroup killed at the onset of refeeding). Total body energy content and⌬body energy can
be calculated from a general formula relating the total energy value of the carcass, energy derived from fat, and energy derived from protein (13). The efficiency of deposition of body energy, fat, or protein during refeeding is calculated as the gain in total body energy, fat energy, or protein energy as a percentage of the ME intake.
Data analysis and statistics. All data are presented as means⫾ SE. One-way analysis of variance (ANOVA) followed by post hoc pair-wise comparisons using Scheffé’s test or unpaired t tests was used to assess the effects of semistarvation and refeeding on the Tcof rats and
also on the locomotor activity (using the significance level of P ⬍ 0.05). The statistical treatment of data was performed with the computer software Statistix, version 8.0 (Analytical Software, St. Paul, MN).
RESULTS
Ex vivo capsule calibration. The results of capsule calibra-tion against Hg thermometers before implantacalibra-tion of the cap-sule in the animal and after its removal at the end of experi-ments I and II indicated that the values of mean bias for capsule temperature were lower than those of Hg thermometer readings by ⫺0.54°C on average (range ⫺0.40°C to ⫺0.68°C). How-ever, when examined across time, the mean bias value for each capsule showed little or no deviation from the initial value, suggesting no drift in capsule temperature readout over time. The values of Tcreported in the results for experiments I and II below have been corrected for deviations from the average Hg thermometer readings before capsule implantation and after removal from the animal across a given experiment.
Experiment I: Tcduring caloric restriction and subsequent
refeeding. The 24-h Tc profiles for the three groups of rats during the periods of acclimatization, semistarvation, and re-feeding are shown in Fig. 2. In the acclimatization period (Fig. 2A) all groups showed similar Tc profiles across the 24-h period, with Tc being higher during the dark phase (1800 – 0600) than during the light phase (0600 –1800) by 0.3– 0.5°C. At the end of the 2-wk period of caloric restriction (Fig. 2B), however, the semistarved group showed lower Tc relative to both AM and WM control groups, particularly in the second Table 1. Body weight, body composition, and energetics of body energy deposition in SS/RF rats compared with AM and WM control rats Group 1 AM Group 2 SS/RF Group 3
WM ANOVA Pairwise Comparison
Final body weight and composition, g
Weight 459⫾ 2 395⫾ 11 383⫾ 3 P⬍ 0.001 1 vs. 2, 3 Water 315⫾ 4 271⫾ 8 265⫾ 4 P⬍ 0.001 1 vs. 2, 3 Fat 42.8⫾ 1.5 38.1⫾ 1.1 31.6⫾ 1.3 P⬍ 0.001 1, 2 vs. 3 Lean 101⫾ 3 85.7⫾ 2.3 86.8⫾ 1.7 P⬍ 0.001 1 vs. 2, 3 ⌬Body composition, g ⌬Weight 109⫾ 5 158⫾ 6 143⫾ 3 P⬍ 0.001 1 vs. 2, 3 ⌬Water 72.4⫾ 3.9 102⫾ 8.4 102⫾ 4 P⬍ 0.01 1 vs. 2, 3 ⌬Fat (dry) 13.3⫾ 1.5 29.0⫾ 1.1 15.2⫾ 1.3 P⬍ 0.001 2 vs. 1, 3
⌬Lean mass (dry) 24.5⫾ 2.5 26.4⫾ 2.3 27.5⫾ 1.7 ns
⌬Protein 19.6⫾ 2.0 21.0⫾ 1.9 22.3⫾ 1.4 ns Energy balance, kJ ⌬Energy 957⫾ 77 1,596⫾ 69 1,091⫾ 63 P⬍ 0.001 2 vs. 1, 3 Energy intake 5,811⫾ 163 5,724⫾ 7 5,728⫾ 163 ns Energy expenditure 4,854⫾ 103 4,128⫾ 69 4,637⫾ 109 P⬍ 0.001 2 vs. 1, 3 Efficiency of deposition, % Body energy 16.4⫾ 1.0 27.9⫾ 1.2 19.0⫾ 0.6 P⬍ 0.001 2 vs. 1, 3 Body fat 8.75⫾ 0.81 19.5⫾ 0.72 10.2⫾ 0.65 P⬍ 0.001 2 vs. 1, 3 Body protein 7.65⫾ 0.69 8.34⫾ 0.74 8.82⫾ 0.52 ns
Values are means⫾ SE (n ⫽ 5 rats/group). AM, age matched; ns, not statistically significant; SS/RF, semistarved-refed; WM, weight matched.
36.0 36.5 37.0 37.5 38.0 38.5 Core temperature (°C) Day 6-7 of Refeeding 36.5 37.0 37.5 38.0 38.5 Core temperature (°C) Day 10-11 of Refeeding 36.0 36.5 37.0 37.5 38.0 38.5 Core temperature (°C) Acclimatization 36.0 36.5 37.0 37.5 38.0 38.5 Core temperature (° C) End of Semistarvation 36.0 36.5 37.0 37.5 38.0 38.5 Core temperature (°C) Day 2-3 of Refeeding
A
B
C
D
E
http://doc.rero.ch
half of the dark phase extending into the first half of the light phase, namely, by⬎ 0.5°C between 0000 and 1200. Within this same time period of midnight to midday, Tcwas also found to be lower in the refed group than in the two control groups, whether after days 2–3, days 6 –7, or days 10 –11 of refeeding (Fig. 2, C, D, and E, respectively). When integrated over the entire 24-h period, the values of Tcwere not different between the three groups in the acclimatization period (Fig. 2A), were lower by ~0.4°C in the semistarved group than in the control groups (Fig. 2B), and also remained lower in the refed group than in the control groups by ~0.4°C (P⬍ 0.001) on days 2–3 (Fig. 2C) and by ~0.2– 0.3°C (P⬍ 0.05) on days 6–7 as well as on days 10 –11 of refeeding (Fig. 2, D and E, respectively). During all phases and time points of measurements, no signif-icant differences in Tcwere observed between the two control groups (AM and WM), whether examined across the dark and light periods or integrated over 24 h.
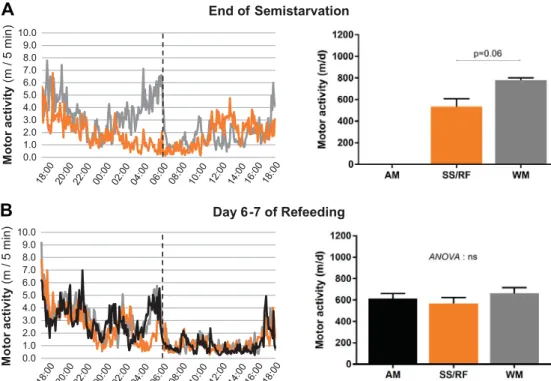
The data on locomotor activity assessed over 24 h at the end of semistarvation and on days 6 –7 of refeeding are shown in Fig. 3. The locomotor activity profile over 24 h at the end of the caloric restriction period (Fig. 3A) indicates that the semi-starved group showed lower locomotor activity than in the WM control animals in the later part of the dark phase (0000 – 0600; P⬍ 0.01), resulting in the integrated 24-h value being lower by 30% (P⫽ 0.06). Assessment of locomotor activity during days 6 –7 of refeeding, however, showed no significant differences in refed animals compared with the control groups, whether examining the dark or light phases or the integrated 24-h values
(Fig. 3B). Overall, although a lower locomotor activity can be associated with a lower Tcduring the period of caloric restric-tion, the persistently lower Tcduring refeeding occurred with-out a lower locomotor activity in the refed animals compared with control animals.
Experiment II: Impact of thermoneutrality on Tcin response
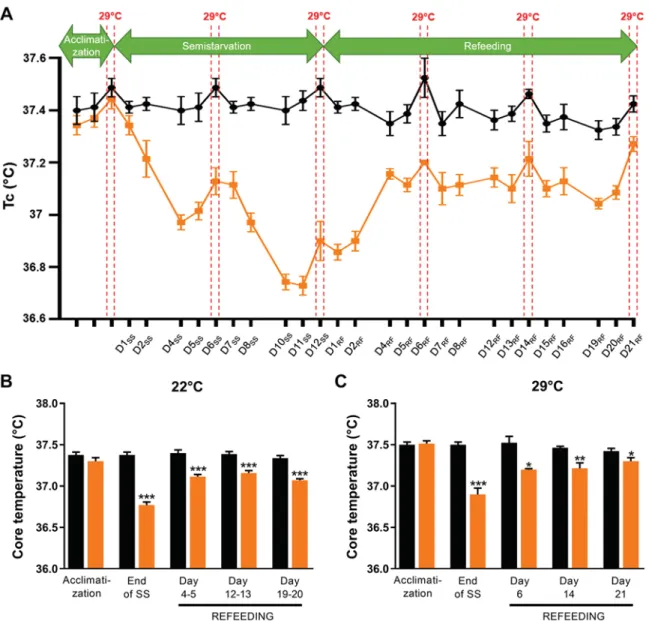
to caloric restriction and refeeding. To investigate whether the lower Tcduring refeeding persists under conditions of thermo-neutrality, we repeated the study above in the rat model of semistarvation and refeeding with the laboratory temperature maintained at 22°C, except for 24 h in each period when the ambient temperature was maintained at 29°C, namely, at the end of the acclimatization period, during days 6 –7 and 11–12 of the semistarvation period, and during days 6 –7, 13–14, and 20 –21 of the refeeding period. During the latter periods, food intake in the control animals was lower at 29°C than at 22°C (~22 vs. 26 g/day), and the refed animals were provided with the same amount of chow as the control animals both at 22°C (26 g/day) and at 29°C (22 g/day), such that the food intakes of the refed animals were the same as control animals throughout the refeeding period, including during periods at 29°C. The results for Tc, shown in Fig. 4A, indicate that independently of the ambient temperature (22°C or 29°C), the 24-h Tc was significantly lower in the semistarved group than in the control animals, namely, by⫺0.4°C and ⫺0.35°C at 22°C and 29°C, respectively, on days 6 –7 of semistarvation and by⫺0.65°C and⫺0.5°C at 22°C and 29°C, respectively, during days 11–12 of semistarvation. During the course of refeeding, Tcremained
Fig. 2. Core body temperature (Tc) of rats that were semistarved and subsequently refed (SS/RF group) compared with their age-matched (AM) and
weight-matched (WM) controls. Data are presented as mean 24-h Tcprofile across both dark and light phases (separated by vertical dashed lines) (left) as well
as integrated over 24 h (presented as means⫾ SE; n ⫽ 5/group) (right). Note that for the WM control animals, the period of acclimatization (A) overlaps with
the end of semistarvation (B), such that data presented for WM control animals in A and B are the same. C–E: refeeding period. In each panel, significant differences among the groups were tested by ANOVA followed by post hoc pairwise comparisons (by Scheffé’s test), with values not sharing the same superscript
(a, b, c) being statistically significant (P⬍ 0.05).
0.0 1.0 2.0 3.0 4.0 5.0 6.0 7.0 8.0 9.0 10.0 Mo to r a c ti v it y (m / 5 m in) 0.0 1.0 2.0 3.0 4.0 5.0 6.0 7.0 8.0 9.0 10.0 M o tor activ ity (m / 5 m in) End of Semistarvation Day 6-7 of Refeeding
A
B
Fig. 3. Locomotor activity of rats that were semistarved and subsequently refed (SS/RF group) and their weight-matched (WM) or age-matched (AM) controls; data for both control animals are avail-able only during refeeding. Data are pre-sented as mean 24-h profile across both dark and light phases (separated by ver-tical dashed lines) (left) as well as
inte-grated over 24 h (presented as means⫾
SE; n ⫽ 5/ group) (right). A: end of
semistarvation. B: during refeeding. d, Day; ns, not statistically significant.
lower in the refed than control animals independently of the ambient temperature, namely, by approximately ⫺0.3°C be-tween days 4 and 20 of refeeding, albeit with the difference in Tcbecoming less marked on days 21–22 conducted at thermo-neutrality; the between-group comparisons for 24-h Tc, to-gether with statistical significance of differences, are also shown separately at 22°C and at 29°C (Fig. 4, B and C). No significant differences in 24-h locomotor activity were ob-served between refed and control animals when assessed at 22°C or at 29°C on days 12–14 as well as on days 19 –21 of refeeding (data not shown); this contrasts with the significantly lower values of Tcin the refed animals than in control animals over these same time periods.
DISCUSSION
It has long been recognized that Tc falls in response to caloric restriction and that this reduction in the cost of homeo-thermy is part of the adaptive mechanisms contributing to
energy conservation during food scarcity. The studies reported here, in a rat model of catch-up fat driven by suppressed thermogenesis (13, 19), suggest that diminished Tcin response to caloric restriction persists during weight recovery upon refeeding, and such diminished cost of homeothermy is a component of the energy conservation mechanisms directed at accelerating the restoration of the body’s fat reserves during weight regain.
Contribution of lower Tc to energy conservation driving
catch-up fat. Previous work in our laboratory (13, 19, 20) and in others (11, 12, 26), using this rat model of semistarvation-refeeding, has consistently shown that the high efficiency of catch-up fat lasts for several weeks. Our study here demon-strates diminished Tcduring the catch-up fat phase of refeeding in a design where 1) the accuracy of capsule temperature readout and potential drift across time were validated by performing ex vivo calibration of each capsule before and after each experiment and also, importantly, 2) under conditions in
Fig. 4. A: core body temperature (Tc) of rats that were semistarved (SS) and subsequently refed (RF) (orange), and their weight-matched controls (black), with
the ambient temperature maintained at 22°C or 29°C. D, day. B and C: data are presented as 24-h Tcat 22°C (B) and 29°C (C) for 24-h Tc. In B and C, significant
between-group differences at each time point are indicated as follows: *P⬍ 0.05, **P ⬍ 0.01, *** P ⬍ 0.001. n ⫽ 7 or 8/group.
which refed animals were compared with time control animals that were of either the same age or the same weight at the onset of refeeding.
In past studies from our laboratory, we were able to quantify the energy conserved for preferential catch-up fat in this rat model as representing ~12% of total energy expenditure rela-tive to control rats matched for weight and protein mass at the onset of refeeding (i.e., the WM control rats) (13, 19, 23, 24, 42). These findings, based upon estimating energy expenditure by energy balance and body composition changes, have been confirmed by other laboratories in studies of energy balance coupled with 24-h assessment of energy expenditure by indi-rect calorimetry (11, 26). Indeed, using the same experimental design, Crescenzo et al. (11) reported that compared with WM control rats isocalorically refed rats showed an elevated ener-getic efficiency and body fat gain over both week 1 and week 2 of refeeding, as well as a lower 24-h energy expenditure (assessed by indirect calorimetry) at the end of both week 1 and week 2 of refeeding by ⫺7% and ⫺11%, respectively. This pattern of suppressed thermogenesis after refeeding has also been reported in mature but growing rats allowed ad libitum refeeding after 2 wk of 60% caloric restriction (26). In the latter study, a very mild and transient hyperphagia during refeeding was shown to be accompanied by a sustained sup-pression of daily energy expenditure (⫺11% and ⫺6% in Sprague-Dawley and Long-Evans rats, respectively) that re-mained evident more than a week after refeeding (26).
A number of factors that could contribute to the difference in energetics between the refed animals and the 2-wk-younger WM control animals (namely, age, meal pattern, and size of organs) have been evaluated previously and were shown to have little or no impact on the difference in energy expenditure between the two groups (19, 20, 22–24). Indeed, with a similar age difference of 2 wk between the refed and WM control animals, the two control groups (AM vs. WM controls) showed no significant differences in their rate of growth (i.e., similar gain in fat mass and lean mass; Fig. 1B, Table 1) and in the efficiency of energy, fat, and protein deposition (Table 1). These findings when comparing AM and WM control animals within the 7–11 wk age range are in line with our previous studies that also did not find significant differences between these two controls differing by 2 wk of age in their fasting plasma glucose and insulin concentrations or in their glucose and insulin response curves to a glucose load (13). The lack of differences in metabolism between the two control groups, within the design of our study, can now be extended to their 24-h profile of Tc, which was not different between the WM and AM control animals when measured at various time points throughout the 4-wk experiment. Consequently, the lower Tcin the refed groups relative to these two control groups suggests that the lower cost of homeothermy persisting concomitant with the elevated efficiency of fat deposition during refeeding represents an inherent thrifty metabolism that contributes to the restoration of depleted fat reserves. In light of the estimation by Dubois (16) that a change of 1°C in Tcrepresents 10 –13% of energy expenditure at rest, our findings here that the 24-h Tcis lower by 0.25– 0.3°C on average in the refed group than in WM control animals would suggest that 25–30% of the lower energy expenditure driving the preferential catch-up fat phe-nomenon could be explained by a lower cost of homeothermy.
Tc and locomotor activity. In the rat, diminished physical
activity and/or Tchas often been reported to occur in associ-ation with the diminished energy expenditure in response to starvation or prolonged (weeks) caloric restriction (2, 18, 28, 41). It should be emphasized, however, that the energy expen-diture associated with physical activity not only comprises the energy cost of work performed in the environment together with energy lost as heat due to the mechanical inefficiency in performing work but also includes the energy spent on a whole array of metabolic events that may be associated with or triggered by movement (18). Such movement-associated ther-mogenesis may overlap with movement-associated anticipa-tory increase in heat production (28, 46), oral-sensory stimu-lation of metabolic rate associated with the search for food and with actual feeding (27, 28), increased heat production for thermoregulatory needs (7, 33), and isometric thermogenesis associated with muscle tension, such as during spontaneous “fidgeting-like” or grooming activities (33, 45, 46). These studies suggest that in laboratory rodents the actual energy cost of performing work per se is trivial compared with their 24-h energy expenditure whereas the movement-associated thermo-genesis is an important component of nonresting energy ex-penditure that contributes to adaptive thermogenesis in re-sponse to cold or to caloric restriction. In our study here, although both locomotor activity and Tc were found to be diminished during caloric restriction, only a lower Tcpersisted during the refeeding phase, with no significant differences observed between locomotor activity in refed compared with control animals. However, the possibility of a link between lower Tcand diminished movement-associated thermogenesis during the phase of catch-up fat cannot be disregarded.
Tcand sympathetic control of BAT thermogenesis: issue of
thermoneutrality. As the animals in our laboratory are housed at 22°C, which is well below the zone of thermoneutrality for the rat, the question arises as to whether the adaptive suppres-sion of thermogenesis and diminished Tcduring caloric rest-riction and refeeding may reside in diminished nonshivering thermoregulatory thermogenesis, which in the rat is well known to be primarily mediated by the activity of the sympa-thetic nervous system in BAT (29, 40). However, under con-ditions of thermoneutrality, when sympathetic control of BAT thermogenesis is known to be rapidly suppressed (10, 32, 40), we still observed the drop in daily Tc both during caloric restriction and persisting during subsequent refeeding. This is evidenced by our data indicating that a shift in the ambient temperature from 22°C to 29°C had little or no impact on the diminished Tcat several time points during semistarvation and refeeding. In fact, an adaptive reduction in thermogenesis has been reported in studies of prolonged caloric restriction in rats housed in cool (15°C) or thermoneutral (30°C) conditions (38). It has also been reported during refeeding at 22°C, at thermo-neutrality (29°C), or in the cold (6°C) whereby despite pair-feeding with the respective control animals the refed animals still showed greater gain in body fat, due to 10 –12% lower energy expenditure than the control animals at each of the three environmental temperatures (23). Taken together, these studies suggest that suppression of the sympathetic-BAT axis is not a critical component of the lower Tcand adaptive suppression of thermogenesis during caloric restriction and the subsequent phase of catch-up fat during refeeding.
Set point of the thermoregulatory system. The possibility therefore remains that suppressed thermogenesis in other or-gans/tissues may contribute to the accompanying lowering of Tc, in particular in the skeletal muscle, for which there is evidence for energy conservation occurring during starvation (41) or during prolonged caloric restriction and persisting during refeeding to contribute to catch-up fat (12, 14). The underlying mechanisms that have so far been implicated are summarized in Table 2 and seem to be associated with a state of skeletal muscle hypothyroidism (8, 14). However, as previ-ously argued (18), “a steady state decrease in total heat pro-duction cannot be established without a shift towards lower temperatures of the apparent set point of the thermoregulatory system; otherwise, this feedback system would respond by a stimulation of the effectors of regulatory heat production to counteract the tendency of the body temperature to decrease as a result of the lower heat production, this compensating for the increase in energy efficiency.” Support for this contention can be derived from two rat models with a high metabolic effi-ciency, ventromedial hypothalamus-lesioned animals and the genetically obese fa/fa rats (6), in which a centrally mediated inhibition of nonshivering thermogenesis has been demon-strated (47, 50, 51). Finally, one may argue that a reduction in Tc may also be contributed to by an increase in heat loss. However, such an increase can only be acute and transient and is unlikely to explain the underlying high metabolic efficiency since a steady-state increase in heat loss cannot be sustained without a shift toward higher temperatures of the apparent set point of the thermoregulatory system.
Perspectives. The combined effect of increased metabolic efficiency and lower cost of homeothermy is likely to be polyhormonal, since a role for glucocorticoid (24) and thyroid hormones (8, 14, 42) has been implicated in the suppressed thermogenesis driving catch-up fat (summarized in Table 2) and may involve changes in the central regulation of Tc. In other words, in addition to peripheral cross talks between the
adipose tissue stores and skeletal muscle thermogenesis, one may entertain the possibility of a feedback loop between a deficit in the adipose tissue fat reserves and central control of thermogenesis operating through a shift toward lower temper-atures of the apparent set point of the thermoregulatory system. In this context, the fall in leptin that signals lower adipose fat stores (1) in response to starvation or caloric restriction has often been implicated in the diminished locomotor activity, energy expenditure, and Tc that characterize daily torpor in some birds and small mammals (15). However, studies in mice with leptin deficiency as well as in leptin receptor-deficient mice have demonstrated that torpor is induced by both leptin-dependent and leptin-inleptin-dependent mechanisms (31) and that leptin is not required for compensatory reduction in energy expenditure accompanying weight loss (30, 31, 52). Further-more, although explanations and concepts built around torpor-associated reduction in Tcmay apply to our studies here in the rat showing lower Tcduring the semistarvation period, they are unlikely to provide an explanation for the persistently lower Tc during the phase of catch-up fat for two main reasons. First, although torpor is a state characterized by reductions in Tc, energy expenditure, and physical activity, the suppressed ther-mogenesis driving catch-up fat is associated with persistently low Tcbut without a reduction in locomotor activity, thereby casting doubt upon the mechanisms driving the high efficiency of catch-up fat as being torporlike. Second, although leptin is markedly lower than control animals during semistarvation, it is rapidly restored within a few days of refeeding and is subsequently higher than in control animals during most of the phase of catch-up fat driven by suppressed thermogenesis (42). In other words, the lower Tcthat persists during the 2–3 wk of refeeding cannot be explained by low concentrations of circu-lating leptin. Overall therefore, the lower Tcpersisting during the catch-up fat may be part of the complex coordination of rapid recovery of the fat reserves that includes leptin-indepen-dent signal(s) from adipose tissue whose actions would lead to Table 2. Summary of previous and present findings in rat model of semistarvation-refeeding
Day 0 of Refeeding SS vs. CSS Days 7–10 of Refeeding RF vs. CRF References SS vs. CSS RF vs. CRF Blood Insulin 2 1 13 13 Leptin 2 ⬇ or1 13, 42 13, 42, 53 Corticosterone — 1 — 13, 24 Thyroid hormones T4 2 ⬇ 42 42 T3 2 ⬇ or2 42 42, 53 Skeletal muscle Net T3neogenesis 2 2 8, 14 8, 14 Mitochondria mass 2 2 12 12 Contraction/relaxation time 1 1 14 14
White adipose tissue
Adipogenesis ⬇ 1 54 54
De novo lipogenesis 2 1 43, 54 43, 54
Brown adipose tissue
UCP1 2 ⬇ 48 48
24-h Core body temperature 2 2 This study This study
Locomotor activity 2 ⬇ This study This study
Comparisons are made between semistarved (SS) rats and their controls (CSS) at the end of 10 –14 days of semistarvation and between refed rats and their
controls (CRF) after 7–10 days of controlled refeeding, with both refed and control rats consuming the same amount of food and refed rats showing increased
efficiency of body fat (but not lean mass) deposition relative to control rats. T3, 3,5,3=-triiodothyronine; T4, thyroxine; UCP1, uncoupling protein 1;1, increase;
2, decrease; ⬇, no significant difference; —, not measured.
slowdown of energy metabolism in peripheral organs, as evi-denced in skeletal muscle (8, 12, 14), as well as centrally (e.g., in the hypothalamus) to lower the set point of the thermoreg-ulatory system. The nature of these adipostat(s) is unknown and remains a challenge for future research on the mechanisms of thrifty metabolism driving catch-up fat, with implications for advances for the pathophysiology of catch-up growth and the ease of obesity relapse after therapeutic slimming.
Concluding remarks. Using a state-of-the-art approach to assess Tcthrough the use of abdominally implanted telemetry pills (which allow continuous monitoring of Tc over weeks), we report here that the fall in Tc in response to caloric restriction persists during the catch-up fat phase of refeeding conducted at typical laboratory room temperature (22°C) or at thermoneutrality (29°C). The reduced energy cost of homeo-thermy persisting during the dynamic phase of weight recovery could constitute a thrifty metabolic trait that contributes to the high metabolic efficiency underlying the rapid restoration of the body’s fat stores.
ACKNOWLEDGMENTS
This study was presented in abstract form at the 25th European Congress on Obesity (ECO2018), Vienna, Austria, May 23–26, 2018 (7a).
GRANTS
This study was supported by Swiss National Science Foundation Grant 310030_152870.
DISCLOSURES
No conflicts of interest, financial or otherwise, are declared by the authors.
AUTHOR CONTRIBUTIONS
J.C., D.A., I.S., J.L.M.-C., J.-P.M., and A.G.D. conceived and designed research; J.C., D.A., I.S., and J.L.M.-C. performed experiments; J.C., D.A., I.S., and A.G.D. analyzed data; J.C., D.A., I.S., J.L.M.-C., J.-P.M., and A.G.D. interpreted results of experiments; J.C. and D.A. prepared figures; J.C., D.A., and A.G.D. drafted manuscript; J.-P.M. and A.G.D. edited and revised man-uscript; J.C., D.A., I.S., J.L.M.-C., J.-P.M., and A.G.D. approved final version of manuscript.
REFERENCES
1. Ahima RS, Prabakaran D, Mantzoros C, Qu D, Lowell B,
Maratos-Flier E, Maratos-Flier JS. Role of leptin in the neuroendocrine response to fasting.
Nature 382: 250 –252, 1996. doi:10.1038/382250a0.
2. Almundarij TI, Gavini CK, Novak CM. Suppressed sympathetic out-flow to skeletal muscle, muscle thermogenesis, and activity energy
expen-diture with calorie restriction. Physiol Rep 5: e13171, 2017. doi:10.14814/
phy2.13171.
3. Aydin C, Gordon CJ. Thermoregulatory, cardiovascular, and metabolic responses to mild caloric restriction in the Brown Norway rat. Physiol Rep
1: e00016, 2013. doi:10.1002/phy2.16.
4. Balmagiya T, Rozovski SJ. Thermoregulation in young adult rats during short- and long-term protein malnutrition. J Nutr 113: 228 –238, 1983. doi:10.1093/jn/113.2.228.
5. Boyle PC, Storlien LH, Keesey RE. Increased efficiency of food
utili-zation following weight loss. Physiol Behav 21: 261–264, 1978. doi:10.
1016/0031-9384(78)90050-1.
6. Bray GA, York DA. Hypothalamic and genetic obesity in experimental animals: an autonomic and endocrine hypothesis. Physiol Rev 59: 719 –
809, 1979. doi:10.1152/physrev.1979.59.3.719.
7. Brown D, Livesey G, Dauncey MJ. Influence of mild cold on the components of 24 hour thermogenesis in rats. J Physiol 441: 137–154,
1991. doi:10.1113/jphysiol.1991.sp018743.
7a.Calonne J, Arsenijevic D, Scerri I, Miles-Chan J, Montani J, Dulloo A. Low 24-hour core body temperature as a thrifty metabolic trait contribut-ing to the enhanced efficiency of fat deposition durcontribut-ing weight regain
(Abstract). Obes Facts 11, suppl 1: TIP119, 2018. doi:10.1159/000489691
8. Calonne J, Isacco L, Miles-Chan J, Arsenijevic D, Montani JP, Guillet
C, Boirie Y, Dulloo AG. Reduced skeletal muscle protein turnover and
thyroid hormone metabolism in adaptive thermogenesis that facilitates body fat recovery during weight regain. Front Endocrinol (Lausanne) 10:
119, 2019. doi:10.3389/fendo.2019.00119.
9. Cettour-Rose P, Samec S, Russell AP, Summermatter S, Mainieri D,
Carrillo-Theander C, Montani JP, Seydoux J, Rohner-Jeanrenaud F, Dulloo AG. Redistribution of glucose from skeletal muscle to adipose tissue
during catch-up fat: a link between catch-up growth and later metabolic
syndrome. Diabetes 54: 751–756, 2005. doi:10.2337/diabetes.54.3.751.
10. Champigny O, Ricquier D. Effects of fasting and refeeding on the level of uncoupling protein mRNA in rat brown adipose tissue: evidence for diet-induced and cold-induced responses. J Nutr 120: 1730 –1736, 1990. doi:10.1093/jn/120.12.1730.
11. Crescenzo R, Bianco F, Falcone I, Prisco M, Dulloo AG, Liverini G,
Iossa S. Hepatic mitochondrial energetics during catch-up fat after caloric
restriction. Metabolism 59: 1221–1230, 2010. doi:10.1016/j.metabol.2009.
11.015.
12. Crescenzo R, Lionetti L, Mollica MP, Ferraro M, D’Andrea E, Mainieri
D, Dulloo AG, Liverini G, Iossa S. Altered skeletal muscle subsarcolemmal
mitochondrial compartment during catch-up fat after caloric restriction.
Dia-betes 55: 2286 –2293, 2006. doi:10.2337/db06-0312.
13. Crescenzo R, Samec S, Antic V, Rohner-Jeanrenaud F, Seydoux J,
Montani JP, Dulloo AG. A role for suppressed thermogenesis favoring
catch-up fat in the pathophysiology of catch-up growth. Diabetes 52:
1090 –1097, 2003. doi:10.2337/diabetes.52.5.1090.
14. De Andrade PB, Neff LA, Strosova MK, Arsenijevic D,
Patthey-Vuadens O, Scapozza L, Montani JP, Ruegg UT, Dulloo AG, Dorchies OM. Caloric restriction induces energy-sparing alterations in skeletal
muscle contraction, fiber composition and local thyroid hormone metab-olism that persist during catch-up fat upon refeeding. Front Physiol 6: 254,
2015. doi:10.3389/fphys.2015.00254.
15. Döring H, Schwarzer K, Nuesslein-Hildesheim B, Schmidt I. Leptin selectively increases energy expenditure of food-restricted lean mice. Int J
Obes Relat Metab Disord 22: 83–88, 1998. doi:10.1038/sj.ijo.0800547. 16. DuBois EF. The basal metabolism in fever. J Am Med Assoc 77: 352–357,
1921. doi:10.1001/jama.1921.02630310022006.
17. Dulloo AG, Jacquet J, Seydoux J, Montani JP. The thrifty “catch-up fat” phenotype: its impact on insulin sensitivity during growth trajectories to obesity and metabolic syndrome. Int J Obes 30, Suppl 4: S23–S35,
2006. doi:10.1038/sj.ijo.0803516.
18. Dulloo AG, Girardier L. 24 Hour energy expenditure several months after weight loss in the underfed rat: evidence for a chronic increase in whole-body metabolic efficiency. Int J Obes Relat Metab Disord 17: 115–123, 1993.
19. Dulloo AG, Girardier L. Adaptive changes in energy expenditure during refeeding following low-calorie intake: evidence for a specific metabolic component favoring fat storage. Am J Clin Nutr 52: 415–420, 1990. doi:10.1093/ajcn/52.3.415.
20. Dulloo AG, Girardier L. Adaptive role of energy expenditure in modu-lating body fat and protein deposition during catch-up growth after early
undernutrition. Am J Clin Nutr 58: 614 –621, 1993. doi:10.1093/ajcn/58.
5.614.
21. Dulloo AG, Jacquet J. Adaptive reduction in basal metabolic rate in response to food deprivation in humans: a role for feedback signals from
fat stores. Am J Clin Nutr 68: 599 –606, 1998. doi:10.1093/ajcn/68.3.599.
22. Dulloo AG, Jacquet J. An adipose-specific control of thermogenesis in body weight regulation. Int J Obes Relat Metab Disord 25, Suppl 5:
S22–S29, 2001. doi:10.1038/sj.ijo.0801907.
23. Dulloo AG, Seydoux J, Girardier L. Dissociation of enhanced efficiency of fat deposition during weight recovery from sympathetic control of thermogenesis. Am J Physiol Regul Integr Comp Physiol 269: R365–
R369, 1995. doi:10.1152/ajpregu.1995.269.2.R365.
24. Dulloo AG, Seydoux J, Girardier L. Role of corticosterone in adaptive changes in energy expenditure during refeeding after low calorie intake.
Am J Physiol Endocrinol Metab 259: E658 –E664, 1990. doi:10.1152/ ajpendo.1990.259.5.E658.
25. Entenman C. General Procedures for Separating Lipid Components of
Tissue. New York: Academic, 1957.
26. Evans SA, Messina MM, Knight WD, Parsons AD, Overton JM. Long-Evans and Sprague-Dawley rats exhibit divergent responses to refeeding after caloric restriction. Am J Physiol Regul Integr Comp
Physiol 288: R1468 –R1476, 2005. doi:10.1152/ajpregu.00602.2004.
27. Even PC, Blais A. Increased cost of motor activity and heat transfer between non-shivering thermogenesis, motor activity, and thermic effect of feeding in mice housed at room temperature—implications in
pre-clinical studies. Front Nutr 3: 43, 2016. doi:10.3389/fnut.2016.00043.
28. Even PC, Nicolaïdis S. Adaptive changes in energy expenditure during mild and severe feed restriction in the rat. Br J Nutr 70: 421–431, 1993. doi:10.1079/BJN19930136.
29. Foster DO, Frydman ML. Tissue distribution of cold-induced thermo-genesis in conscious warm- or cold-acclimated rats reevaluated from changes in tissue blood flow: the dominant role of brown adipose tissue in the replacement of shivering by nonshivering thermogenesis. Can J
Physiol Pharmacol 57: 257–270, 1979. doi:10.1139/y79-039.
30. Frühbeck G, Gómez-Ambrosi J. Rationale for the existence of additional
adipostatic hormones. FASEB J 15: 1996 –2006, 2001. doi:
10.1096/fj.00-0829hyp.
31. Gavrilova O, Leon LR, Marcus-Samuels B, Mason MM, Castle AL,
Refetoff S, Vinson C, Reitman ML. Torpor in mice is induced by both
leptin-dependent and -independent mechanisms. Proc Natl Acad Sci USA
96: 14623–14628, 1999. doi:10.1073/pnas.96.25.14623.
32. Girardier L. Brown fat: an energy dissipating tissue. In: Mammalian
Thermogenesis, edited by Girardier L, Stock MJ. London: Chapman and
Hall, 1983, chapt. 3, p. 50 –98.
33. Girardier L, Clark MG, Seydoux J. Thermogenesis associated with spon-taneous activity: an important component of thermoregulatory needs in rats. J
Physiol 488: 779 –787, 1995. doi:10.1113/jphysiol.1995.sp021009. 34. Harris RB, Martin RJ. Recovery of body weight from below “set point”
in mature female rats. J Nutr 114: 1143–1150, 1984. doi:10.1093/jn/114.
6.1143.
35. Hill JO, Fried SK, DiGirolamo M. Effects of fasting and restricted refeeding on utilization of ingested energy in rats. Am J Physiol Regul
Integr Comp Physiol 247: R318 –R327, 1984. doi:10.1152/ajpregu.1984. 247.2.R318.
36. Keesey RE, Powley TL. Body energy homeostasis. Appetite 51: 442–445,
2008. doi:10.1016/j.appet.2008.06.009.
37. Keys A, Brožek J, Henschel A, Mickelsen O, Taylor HL. The Biology
of Human Starvation, Vols. 1 and 2. Minneapolis, MN: Univ. of
Minne-sota Press, 1950.
38. Knight WD, Witte MM, Parsons AD, Gierach M, Overton JM. Long-term caloric restriction reduces metabolic rate and heart rate under cool and thermoneutral conditions in FBNF1 rats. Mech Ageing Dev 132:
220 –229, 2011. doi:10.1016/j.mad.2011.04.001.
39. Landsberg L. Core temperature: a forgotten variable in energy
expendi-ture and obesity? Obes Rev 13, Suppl 2: 97–104, 2012. doi:10.1111/j.
1467-789X.2012.01040.x.
40. Landsberg L, Saville ME, Young JB. Sympathoadrenal system and regulation of thermogenesis. Am J Physiol Endocrinol Metab 247: E181–
E189, 1984. doi:10.1152/ajpendo.1984.247.2.E181.
41. Ma SW, Foster DO. Starvation-induced changes in metabolic rate, blood flow, and regional energy expenditure in rats. Can J Physiol Pharmacol
64: 1252–1258, 1986. doi:10.1139/y86-211.
42. Mainieri D, Summermatter S, Seydoux J, Montani JP, Rusconi S, Russell
AP, Boss O, Buchala AJ, Dulloo AG. A role for skeletal muscle
stearoyl-CoA desaturase 1 in control of thermogenesis. FASEB J 20: 1751–1753, 2006. doi:10.1096/fj.06-5934fje.
43. Marcelino H, Veyrat-Durebex C, Summermatter S, Sarafian D,
Miles-Chan J, Arsenijevic D, Zani F, Montani JP, Seydoux J, Solinas G, Rohner-Jeanrenaud F, Dulloo AG. A role for adipose tissue de novo
lipogenesis in glucose homeostasis during catch-up growth: a Randle cycle
favoring fat storage. Diabetes 62: 362–372, 2013. doi:10.2337/db12-0255.
44. Monnard CR, Fares EJ, Calonne J, Miles-Chan JL, Montani JP,
Durrer D, Schutz Y, Dulloo AG. Issues in continuous 24-h core body
temperature monitoring in humans using an ingestible capsule telemetric
sensor. Front Endocrinol (Lausanne) 8: 130, 2017. doi:10.3389/fendo.
2017.00130.
45. Morrison SD. The constancy of the energy expended by rats on sponta-neous activity, and the distribution of activity between feeding and
non-feeding. J Physiol 197: 305–323, 1968. doi:10.1113/jphysiol.1968.
sp008561.
46. Richard D, Rivest S. The role of exercise in thermogenesis and energy
balance. Can J Physiol Pharmacol 67: 402–409, 1989. doi:
10.1139/y89-064.
47. Rothwell NJ, Stock MJ, Thexton AJ. Decerebration activates
thermo-genesis in the rat. J Physiol 342: 15–22, 1983. doi:10.1113/jphysiol.1983.
sp014836.
48. Samec S, Seydoux J, Dulloo AG. Role of UCP homologues in skeletal muscles and brown adipose tissue: mediators of thermogenesis or
regula-tors of lipids as fuel substrate? FASEB J 12: 715–724, 1998. doi:10.1096/
fasebj.12.9.715.
49. Severinsen T, Munch IC. Body core temperature during food restriction
in rats. Acta Physiol Scand 165: 299 –305, 1999. doi:10.1046/j.1365-201x.
1999.00488.x.
50. Seydoux J, Benzi RH, Shibata M, Girardier L. Underlying mechanisms of atrophic state of brown adipose tissue in obese Zucker rats. Am J
Physiol Regul Integr Comp Physiol 259: R61–R69, 1990. doi:10.1152/ ajpregu.1990.259.1.R61.
51. Seydoux J, Rohner-Jeanrenaud F, Assimacopoulos-Jeannet F,
Jeanre-naud B. Functional disconnection of brown adipose tissue in hypothalamic
obesity in rats. Pflugers Arch 390: 1–4, 1981. doi:10.1007/BF00582702.
52. Skowronski AA, Ravussin Y, Leibel RL, LeDuc CA. Energy homeo-stasis in leptin deficient Lepob/ob mice. PLoS One 12: e0189784, 2017. doi:10.1371/journal.pone.0189784.
53. Summermatter S, Mainieri D, Russell AP, Seydoux J, Montani JP,
Buchala A, Solinas G, Dulloo AG. Thrifty metabolism that favors fat
storage after caloric restriction: a role for skeletal muscle phosphatidyl-inositol-3-kinase activity and AMP-activated protein kinase. FASEB J 22:
774 –785, 2008. doi:10.1096/fj.07-8972com.
54. Summermatter S, Marcelino H, Arsenijevic D, Buchala A, Aprikian
O, Assimacopoulos-Jeannet F, Seydoux J, Montani JP, Solinas G, Dulloo AG. Adipose tissue plasticity during catch-up fat driven by thrifty
metabolism: relevance for muscle-adipose glucose redistribution during
catch-up growth. Diabetes 58: 2228 –2237, 2009. doi:10.2337/db08-1793.
55. Sunagawa GA, Takahashi M. Hypometabolism during daily torpor in mice is dominated by reduction in the sensitivity of the thermoregulatory
system. Sci Rep 6: 37011, 2016. doi:10.1038/srep37011.
56. Weyer C, Walford RL, Harper IT, Milner M, MacCallum T,
Tat-aranni PA, Ravussin E. Energy metabolism after 2 y of energy
restric-tion: the biosphere 2 experiment. Am J Clin Nutr 72: 946 –953, 2000. doi:10.1093/ajcn/72.4.946.
57. Yepuri G, Marcelino H, Shahkhalili Y, Aprikian O, Macé K, Seydoux
J, Miles JL, Montani JP, Dulloo AG. Dietary modulation of body
composition and insulin sensitivity during catch-up growth in rats: effects of oils rich in n-6 or n-3 PUFA. Br J Nutr 105: 1750 –1763, 2011. doi:10.1017/S0007114510005659.