HAL Id: hal-00295452
https://hal.archives-ouvertes.fr/hal-00295452
Submitted on 22 Jun 2004
HAL is a multi-disciplinary open access
archive for the deposit and dissemination of
sci-entific research documents, whether they are
pub-lished or not. The documents may come from
teaching and research institutions in France or
abroad, or from public or private research centers.
L’archive ouverte pluridisciplinaire HAL, est
destinée au dépôt et à la diffusion de documents
scientifiques de niveau recherche, publiés ou non,
émanant des établissements d’enseignement et de
recherche français ou étrangers, des laboratoires
publics ou privés.
interpretation using Fresnel holography: a new tool in
meteor science
W. G. Elford
To cite this version:
W. G. Elford. Radar observations of meteor trails, and their interpretation using Fresnel holography:
a new tool in meteor science. Atmospheric Chemistry and Physics, European Geosciences Union,
2004, 4 (4), pp.911-921. �hal-00295452�
www.atmos-chem-phys.org/acp/4/911/
SRef-ID: 1680-7324/acp/2004-4-911
Chemistry
and Physics
Radar observations of meteor trails, and their interpretation using
Fresnel holography: a new tool in meteor science
W. G. Elford
Department of Physics and Mathematical Physics, University of Adelaide, Adelaide, 5005, Australia Received: 28 September 2003 – Published in Atmos. Chem. Phys. Discuss.: 2 February 2004 Revised: 20 May 2004 – Accepted: 20 May 2004 – Published: 22 June 2004
Abstract. A Fresnel transform technique has been
devel-oped at Adelaide to analyse radar meteor echoes detected in the transverse mode. The genesis for this technique was the study of the structure of the scattering ionization immediately behind the head of the trail, in order to deduce the degree of fragmentation of the ablating meteoroid. The technique has been remarkably successful in not only giving insight into the fragmentation of meteoroids, but also revealing other signif-icant features of the trails including diffusion, lateral motion of the trail during formation due to wind drift, and phase of the scattered signal in the vicinity of the head of the trail.
A serendipitous outcome of the analysis is the measure-ment of the speed and deceleration of the meteoroid produc-ing the trail to a precision far exceedproduc-ing that available from any other method applied to transverse scatter data.
Examples of the outcomes of the technique applied to me-teor echoes obtained with a 54 MHz narrow beam radar are presented.
1 Introduction
N. Herlofson is credited by Ellyett and Davies (1948) with recognising that as a meteor trail is formed within the beam of a radar the fluctuations in the echo amplitude are the radio analogue of the optical diffraction at a straight edge of a half-plane. Further, it was realised that a record of these fluctua-tions could be used to determine the speed of the meteoroid producing the trail. This technique has been used by many workers in many countries to carry out such measurements (McKinley, 1961, Ceplecha et al 1998). In the early 1990’s existing VHF narrow beam radars were shown to be a valu-able tool for meteor studies, and in 1997 Cervera, Elford and Steel described a new technique for precise measurements of Correspondence to: W. G. Elford
meteoroid speeds based on phase measurements of the radar echo (Elford, 2001).
VHF radars record the in-phase and quadrature compo-nents of the echo from any target at a repetition rate usually exceeding 1500 pulses per second. These are the required parameters for measuring the full characteristics of the scat-tering properties of a meteor trail as it is formed in the radar beam. It is anticipated that such scattering properties could have sufficient resolution to reveal the structure of the trail and in particular any evidence of superimposed trails result-ing from fragmentation of the meteoroid.
Radar echoes from meteor trails are recorded as a function of time, and are thus the radio analogue of a one-dimensional optical hologram. The process by which meteor trail charac-teristics are deduced from the radar record is in the nature of a Fresnel transform and the derivation of the appropriate transform is described in what follows. The application of this transform process to a number of examples reveals some surprising features of meteor trails and their radio scattering properties.
2 Geometry and Fresnel transform
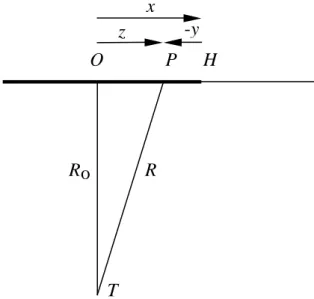
A meteor trail is formed in the atmosphere at an orthogonal distance Rofrom a radar at T , as shown in Fig. 1. The radar
signal received from a meteor trail is a measure of the am-plitude and phase of the total scattering from the trail within the radar beam. In general the antenna beam is sufficiently wide to encompass the whole of the ionised trail, typically 10–15 km in length. However for very narrow beam radars and for very “bright” trails some part of the trail may lie out-side of the beam. These special cases need to be addressed separately.
Time is measured from the instant the meteoroid passes the orthogonal point O (commonly called the topoint). We
Ro
R
T
O
P
H
z
-y
x
Fig. 1. Geometry of trail and radar scattering.
a distance x from O. Assuming that any deceleration can be neglected, the distance x is equal to vt where v is the speed of the meteoroid. (The assumption of negligible deceleration is justified by the observation that significant deceleration of the meteoroid only occurs close to the termination of its path. Nevertheless, the effect of deceleration on the analysis is dis-cussed in Sect. 5).
We consider a small element dz of the trail at point P , a distance z from the “to-point” O, and let the radio reflection
coefficient of the element be G(z). The total scattered signal detected at the radar site T at an instant of time t , is given by
E(t ) ∝ x Z −∞
G(z)exp(j 2kR)dz (1)
where t =x/v, v is the speed of the meteoroid, k=2π /λ, and
R is the range of P from the radar, which can be written as R∼=Ro+z2/(2Ro), since Ro>10z. In Eq. (1) the optics
convention for the phase has been adopted.
We seek a “radio image” of the trail as described in the moving frame of the meteoroid. Thus we set up a co-ordinate system with the origin at the head of the trail H and with all distances y measured to the left of H . All distances are mea-sured positively to the right, so that z=x+y. (This expression is made more obvious by considering a positive distance y to a fictitious point P0to the right of H so that all distances are then measured positively to the right.)
We now define the reflection coefficient of the element of the trail at P in terms of the position of P with respect to the head of the trail, H . Let A(y)=G(z), noting that
z=x+y=vt + y, and that at any instant dz=dy.
Whence (1) becomes
E(t ) = K o Z −∞
A(y)exp(j kx2/Ro)
exp(j ky2/Ro)exp(j k2xy/Ro)dy, (2)
where K is a constant.
Multiply both sides of (2) by exp(−j kx2/Ro)to give,
[E(t )exp(−j kx2/Ro)] = K o Z −∞
[A(y)exp(j ky2/Ro)]
exp(j k2xy/Ro)dy, (3)
As A(y) is zero for all y>0, we can without loss of gen-erality set the upper bound of the integral to ∞. Then the Fourier transform of Eq. (3) is
A(y)exp(j ky2/Ro) = (2π K)−1 ∞ Z −∞
E(t )exp(−j kx2/Ro)
exp(−j k2xy/Ro)dx
Whence A(y) = (2π K)−1 ∞ Z −∞ E(t )exp(−j k(x + y)2/Ro)dx or A(y) = (2π K)−1v ∞ Z −∞
E(t )exp(−j k(vt + y)2/Ro)dt (4)
A useful normalized form of Eq. (4) is
A(y) ∝ ∞ Z −∞
E(t )exp(−j Z2/2)dX, (5)
where Z=X+Y =(x+y)/σ , dX = σ−1dx=(v/σ )dt, and
σ2=λRo/(4π ).
The left hand side of Eq. (5) is the scattering function of the trail measured with respect to the position of the head as origin, and the right hand side is the Fresnel transform of the complex signal recorded at the radar station.
The convolution calculation implied in Eq. (5) is carried out in terms of real and imaginary components. The weight-ing function exp(−j Z2/2) has components cos(Z2/2) and
−sin(Z2/2) which oscillate with increasing frequency as Z increases. Hence the real and imaginary parts of the radar signal described by E(t ) must be sampled with sufficient fre-quency to avoid problems of aliasing.
The numerical integration of Eq. (5) is carried out for a range of X that includes the full extent of the time series of the radar echo given by E(t ); the interpulse period of the
radar 1t defines the increment 1X. In determining the scat-tering function A(y) from Eqs. (4) or (5) the value of the speed parameter v has to be chosen a priori. As is shown in Sect. 4, the value of v is adjusted to give the sharpest lead-ing edge for the amplitude of A(y). A speed precision of 0.2 km/s is usually achieved.
3 Integrity of the transform process
The expression (5) was tested using known Fresnel diffrac-tion data, such as are available for the diffracdiffrac-tion at the straight edge of an infinite half-plane. The amplitude and phase of the diffraction aperture were recovered with excel-lent resolution. The straight edge Fresnel diffraction data were also used to simulate a radar echo from an underdense meteor trail subject to the effect of diffusion during and after formation. Again an excellent outcome was achieved, with the amplitude of the scattering function (trail reflectivity) ex-hibiting a very sharp frontal edge (“head” of the trail) and then an exponential decay back from the head.
It needs to be emphasised that the transform process de-scribed by Eq. (5) implies that during the formation of the meteor trail in the radar beam the trail maintains the same scattering function relative to the head taken as the geomet-rical origin. This assumption is clearly an approximation but is justified by the fact that for VHF radars the total length of the trail contributing to the radar echo is typically 2–3 km, and the result of the transform is an average scattering profile over this distance behind the head.
4 Results of the Fresnel transform
The transform described above has been applied to radar echoes recorded using the 54 MHz radar at Buckland Park, near Adelaide, South Australia. The radar has a beam width of about 3◦, a peak power of 25 KW, a pulse length of 13 µs, and a pulse repetition frequency of 2000 Hz. The beam was directed either East or West at a zenith angle of 30◦.
To record radar returns from meteor trails occurring in the meteor region, 70–130 km altitude, with a beam directed at a zenith angle of 30◦, requires a range spread from 80 to 150 km. The latter is achieved using 35 range bins each 2 km wide commencing at a range of 80 km.
The following examples illustrate the degree of detail on meteoroid ablation and meteor physics now achievable using the new Fresnel transform technique. In each case the radar record is the real and imaginary part of the incident signal, from which the amplitude and phase can be determined. For presentation purposes it is found that the preferred display is a time series of the amplitude and the accumulated (or “un-wrapped”) phase. The “unwrapping” of the phase is achieved by working backwards through the phase series, and at each point adding or subtracting a phase change of n2π (for
var-0.75 0.80 0.85 0.90 0.95 0 5 10 15 arb. units amplitude 0.75 0.80 0.85 0.90 0.95 Elapsed time (s) -3 0 3 6 cycles unwrapped phase -4 -2 0 2 4
Distance along trail (km) 0 10 20 30 40 50
Reflectivity amplitude (arb. units)
10.0 km/s 20.0 km/s 30.0 km/s 40.0 km/s 50.0 km/s 60.0 km/s 62.0 km/s 62.3 km/s 62.5 km/s 62.7 km/s 63.0 km/s 70.0 km/s 80.0 km/s 90.0 km/s
Fig. 2. Upper two plots are the amplitude and phase of a radar me-teor echo. The lower plots are the amplitudes of the Fresnel trans-form for 14 assumed speeds of the meteoroid.
ious integers n) according to the condition that the change produces greater consistency in the slope of the phase record. 4.1 Speed measurement and fragmentation
The upper part of Fig. 2 shows the amplitude and phase of a radar echo, lasting about 0.15 s, from a trail formed at a height of 98 km. The amplitude shows a few cycles of Fres-nel diffraction and the accumulated phase is typical of most underdense echoes with this amplitude behaviour. The slow linear phase change between 0.87 and 0.95 s is due to the bodily motion of the trail due to atmospheric winds. One cy-cle of phase is equivalent to a change in line of sight distance of a half wavelength (i.e. 2.77 m).
The lower part of Fig. 2 shows the amplitude of the Fresnel transform of this echo for a number of discrete speeds for the meteoroid. The initial step in the analysis process is to dis-play the amplitude of the FT outcomes for 9 speeds in steps of 10 km/s from 10 km/s to 90 km/s. The choice of speed is then refined by choosing steps of 1 km/s, and finally steps of 0.2 km/s. A number of criteria have been established for the selection of the optimum transform; these are greatest slope of the leading edge, a well-defined “foot” at the commence-ment of the “head” and the minimisation of any oscillatory behaviour immediately back from the head. In this case the
-4 -2 0 2 4 0 1000 2000 3000 4000 5000
Amplitude (arb. units)
Trail reflectivity Speed = 62.5 km/s -4 -2 0 2 4 -0.6 -0.4 -0.2 0.0 0.2 0.4 0.6
Phase (cycles) Trail phase
-4 -2 0 2 4
Distance along trail (km) -2 -1 0 1 2 3 Phase (cycles)
Unwrapped Trail phase
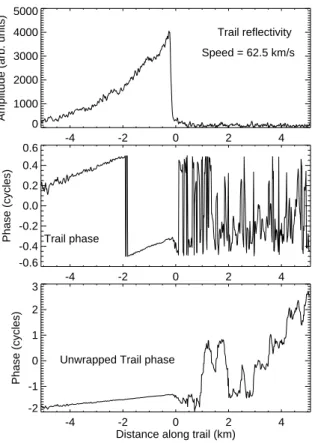
Fig. 3. Fresnel transform of echo shown in Fig. 2 at a speed of 62.5 km/s. The amplitude decays exponentially back along the trail with some evidence of fragmentation. The phase behaviour is typi-cal of the effect of the background wind.
-4 -2 0 2 4
Distance along trail (km) 1
10 100 1000 10000
Amplitude (arb. units)
Trail reflectivity
Fig. 4. Reflectivity from Fig. 3 replotted in log coordinates to illus-trate how the exponential decay of the trail back from the head can be measured. Note that the segments of the plot associated with the major trail and the minor trails all have common slopes.
speed was chosen as 62.5 km/s and the precision is ±0.2 km/s or ±0.3%. The slope of the “head” as a function of distance depends on the finite size of the receiving antenna (square, 16λ per side).
The transform of this echo at a speed of 62.5 km/s is shown in Fig. 3. The exponential decay of the trail reflectivity back from the head is as expected, with evidence of meteoroid fragmentation prior to ablation contributing to at least four weak trails. These minor trails commence at distances of
0.48 0.50 0.52 0.54 0.56 0.58 0.60 0 2 4 6 arb. units amplitude 0.48 0.50 0.52 0.54 0.56 0.58 0.60 Elapsed time (s) -10 -5 0 cycles unwrapped phase -4 -2 0 2 4
Distance along trail (km) 0
5 10 15 20
Reflectivity amplitude (arb. units)
66.3 km/s 66.8 km/s 67.3 km/s 67.8 km/s 68.3 km/s 68.6 km/s 68.8 km/s 69.0 km/s 69.3 km/s 69.8 km/s 70.3 km/s 70.8 km/s 71.3 km/s
Fig. 5. Upper two plots show the amplitude and phase of a radar record, which has the overall appearance of a short-lived radar me-teor echo (∼0.1 s) but with very complex structure. The optimum Fresnel transform occurs at a speed of 68.8 km/s.
1.0, 2.3, 3.5 and 4.7 km behind the head of the main trail with strengths of 13%, 8%, 5% and 5%. Such behaviour is typical of the majority of meteor radar data and the cause is now clearly revealed through the application of the Fresnel transform. The presence of theses minor trails explains the sudden cessation of the Fresnel oscillations in the amplitude data in the upper part of Fig. 2.
The phase behaviour plotted in Fig. 3 is typical of the ef-fect of background wind on the trail, and there is no evidence of any phase change associated with the minor trails. This latter null observation is significant as it indicates that the minor trails are coaxial with the main trail to within 5 cm.
To measure the rate of radial diffusion of the ionisation in the trail back from the head the reflectivity data shown in Fig. 3 is replotted in logarithmic coordinates in Fig. 4. On this plot both the contributions from main trail and the minor trails exhibit a linear appearance from which the decay rate can be measured accurately. It is to be noted that prior methods depended on fitting an exponential to the amplitude data in Fig. 2, with the complication of the presence of the Fresnel oscillations.
-4 -2 0 2 4 0 500 1000 1500 2000
Amplitude (arb. units)
Trail reflectivity Speed = 68.8 km/s -4 -2 0 2 4 -0.6 -0.4 -0.2 0.0 0.2 0.4 0.6 Phase (cycles) Trail phase -1.0 -0.5 0.0 0.5 Distance along trail (km)
-0.6 -0.4 -0.2 0.0 0.2 0.4 0.6 Phase (cycles)
Trail phase (expanded)
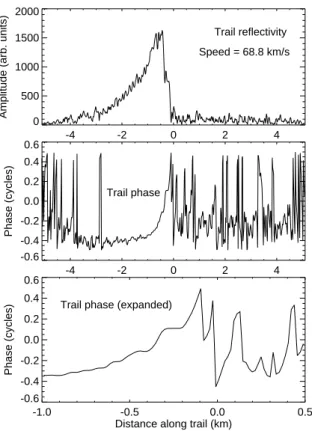
Fig. 6. Reflectivity and phase of transform of radar data shown in Fig. 5. The lower plot shows the phase behaviour within 1 km of the head. Of particular interest is the stepped nature of the phase (see text).
4.2 Non-coaxial fragmentation
When fragmentation produces several meteoroid fragments of similar size, the overlapping trails scatter radar signals of comparable size that interfere to produce complex signals such as shown in the upper two plots in Fig. 5. When trans-formed the outcomes for a range of speeds near 69 km/s are shown in the lower part of the figure, and the optimum trans-form occurred at a speed of 68.8 km/s. The first point to make is that it is remarkable that such speed precision is possible with this radar data. The second point is that it is evident from a cursory glance at the transforms that there are at least two “heads” slightly separated. In fact a detailed analysis of the phase outcome of the Fresnel transform as shown in Fig. 6, indicates the presence of six trails commencing within 1 km of the initial head.
In Fig. 6 the phase decreases in a series of “steps” back from the “head”, the phase change at each step indicates the effect of an additional trail with a different line of sight dis-tance from the observer, while the length of each step is a measure of the distance along the meteoroid paths between successive “heads”. By using, in addition, the reflectivity re-sults, the vector summation can be decomposed to produce the summary plot shown in Fig. 7. The transverse positions
0 100 200 300 − 800 − 600 − 400 − 200 0 cm
Fig. 7. Six trails contributing to the radar meteor echo data shown in Fig. 5. The relative positions of the trails were calculated from the amplitude and phase data derived from the Fresnel transform and plotted in Fig. 6. The relative strengths of the trails are 2, 4, 1, 1, 1, and 1. 0.65 0.70 0.75 0 3 6 9
arb. units amplitude
97.7 km 0.65 0.70 0.75 Elapsed time (s) -20 -10 0 10 cycles unwrapped phase -4 -2 0 2 4
Distance along trail (km) 0 20 40 60 80 100
Reflectivity amplitude (arb. units)
58.2 km/s 61.2 km/s 61.4 km/s 61.6 km/s 61.8 km/s 62.0 km/s 62.2 km/s 62.4 km/s 62.6 km/s 62.8 km/s 63.0 km/s 63.2 km/s 66.2 km/s
Fig. 8. The upper two plots are the radar echo from the “head ion-isation” of a meteor trail. The lower plots shows that the Fresnel transform optimises at a speed of 62.0 km/s.
of the trails are in the line of sight direction from the ob-server. As is evident, separations as small as 10 cm can be measured. This is a further remarkable outcome of the Fres-nel transform technique. It should be pointed out that what is being measured is the differences in the phase centres of the trails – in general the trails have initial radii at least an order of magnitude larger than the smallest measurable sep-arations.
-4 -2 0 2 4 0 20 40 60 80 100 120
Ampl. (arb. units)
Trail reflectivity -4 -2 0 2 4 -0.6 -0.4 -0.2 0.0 0.2 0.4 0.6 Phase (cycles) Trail phase Trail reflectivity (expanded) -0.4 -0.2 0.0 0.2 0.4 0 20 40 60 80 100 120
Ampl. (arb. units)
-0.4 -0.2 0.0 0.2 0.4
Distance along trail (km) 7 8 9 10 11 Phase (cycles) Unwrapped trail phase
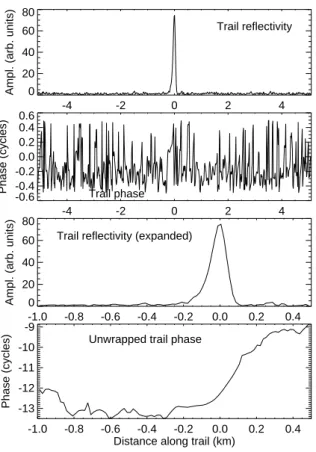
Fig. 9. Fresnel transform of the radar data in Fig. 8. The “head ion-ization” structure cannot be resolved, although there is some weak coherence in the phase 1.0 to 2.0 km behind the head. A minor head component is identified about 200 m behind the main head.
4.3 The head echo
In general meteor echoes are received when the orthogonal point on the trail (topoint) lies within the radar beam. This
situation is readily checked by reference to the accumulated phase plot which shows a characteristic phase decrease with increasing time reaching a minimum just after the meteoroid has past the topoint. The absence of this feature in the phase
record indicates that the topoint lies outside the beam.
An example of an echo where the topoint lies outside the
beam is shown in Fig. 8. In this case the amplitude plot is typical of a small “hard target” moving across the radar beam, and it is concluded that the radar scattering comes from ionization in the close vicinity of the meteoroid. Such echoes are termed “head echoes”, and a characteristic feature of these echoes is the strong phase coherence, as is shown in the phase plot. The phase minimum at 0.71 s is an artefact of the under-sampling of the data. Such under-sampling does not affect the value of the speed deduced from the Fresnel transforms shown in the lower part of Fig. 8. In this case the transform optimises at a speed of 62.0 km/s.
Figure 9 shows that the structure of the “head” is not re-solved by the transform. The slopes of the beginning and
0.5 0.6 0.7 0.8 0 2 4 6 arb. units amplitude 115.1 km 0.5 0.6 0.7 0.8 Elapsed time (s) 0 50 100 150 cycles unwrapped phase -4 -2 0 2 4
Distance along trail (km) 0
20 40 60 80
Reflectivity amplitude (arb. units)
62.3 km/s 65.3 km/s 65.5 km/s 65.7 km/s 65.9 km/s 66.1 km/s 66.3 km/s 66.5 km/s 66.7 km/s 66.9 km/s 67.1 km/s 67.3 km/s 70.3 km/s
Fig. 10. Example of a radar echo from a very short trail that occurs at a height of 115 km. The optimum Fresnel transform occurs at a speed of 66.1 km/s.
end of the reflectivity outcome are significantly determined by the finite size of the radar antenna and the radar sam-pling rate. However, the phase behaviour of the transform shows some weak coherence in the region 0.5 to 2.5 km be-hind the head, although the sources are individually too weak to significantly increase the reflectivity. Nevertheless, it is the combination of these weak but coherent sources and the “head echo” that gives rise to the interference present in the radar amplitude between 0.69 s and 0.76 s shown in Fig. 8. 4.4 Very short trails
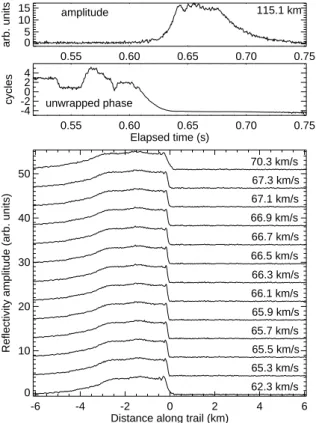
In some cases echoes from very short trails appear like the “head echoes” described above. An example of this is the echo depicted in Fig. 10. In this case the amplitude behaviour is typical of a “hard target” traversing the beam and delineat-ing the beam pattern. However, the phase behaviour indi-cates that the topoint occurs at a time of about 0.68 s, just
within the beam. The optimum Fresnel transforms (lower part of figure) indicate a speed of 66.1 km/s for the mete-oroid and the outcome of the transform is plotted in Fig. 11. Here the expanded plot of the reflectivity indicates a sim-ple decay-type trail with a duration height (assuming am-bipolar diffusion) of 112 km consistent with the observed
-4 -2 0 2 4 0 20 40 60 80
Ampl. (arb. units)
Trail reflectivity -4 -2 0 2 4 -0.6 -0.4 -0.2 0.0 0.2 0.4 0.6
Phase (cycles) Trail phase
Trail reflectivity (expanded)
-1.0 -0.8 -0.6 -0.4 -0.2 0.0 0.2 0.4 0 20 40 60 80
Ampl. (arb. units)
-1.0 -0.8 -0.6 -0.4 -0.2 0.0 0.2 0.4 Distance along trail (km)
-13 -12 -11 -10 -9 Phase (cycles)
Unwrapped trail phase
Fig. 11. Transform of data in Fig. 10 at a speed of 66.1 km/s. The outcome is a very short trail less than 200 m in length with a decay time of about 0.8 ms.
height of 115 km. In the region between 100 and 200 m behind the head, the phase shows a slope that changes from 1.1 cycles/km to 0.5 cycle/km. The movement of the trail is toward the observer and the equivalent wind speed is 200 m/s to 100 m/s. Such wind speed estimates are very much at the limit of this technique, and this example indicates that un-derdense meteor trails at heights above 110 km are unlikely to give reliable atmospheric wind speeds.
4.5 Simultaneous echoes from different trails
Occasionally simultaneous echoes can occur in the same range bin. The only indication of this situation is irregular-ities in the amplitude-time record that suggest interference between two sources. For a narrow beam radar it can be as-sumed that the trails are in the same region of the atmosphere and that any wind drifts derived from the phase behaviour of the echo are reliable. However, the exponential decay of the echo is usually compromised by the interference between the two sources after formation, and estimates of decay times are unreliable.
Figure 12 shows details of the radar record of a meteor echo that occurred at a range of 109 km (height 94 km). At first glance the amplitude behaviour suggests that this echo comes from a short-lived overdense trail that develops into
0.70 0.80 0.90 1.00 1.10 0 5 10 15 20
arb. units amplitude
94.3 km 0.70 0.80 0.90 1.00 1.10 Elapsed time (s) 0 100 200 cycles unwrapped phase -4 -2 0 2 4
Distance along trail (km) 0
50 100 150 200
Reflectivity amplitude (arb. units)
34.5 km/s 35.0 km/s 35.5 km/s 36.0 km/s 36.5 km/s 36.8 km/s 37.0 km/s 37.2 km/s 37.5 km/s 38.0 km/s 38.5 km/s 39.0 km/s 39.5 km/s
Fig. 12. The upper plots are the radar data of a complicated echo with strong phase coherence. The transforms in the lower plots show optimisation at two speeds 36.0 and 37.0 km/s, indicating the simultaneous observation of two trails.
an underdense trail. On the other hand the phase behaviour is more typical of a “head echo” or a short trail echo as dis-cussed in Sect. 4.4.
The paradox described in the above paragraph is resolved when the echo data is subjected to the Fresnel transform at a range of meteoroid speeds as are plotted in the lower part of Fig. 12. It is now evident that the transform optimises for two speeds, one at 36.0 km/s and the other at 37.0 km/s. The out-come is further complicated by the lower speed trail showing oscillations in the reflectivity that are typical of significant deceleration of the meteoroid while ablation is occurring.
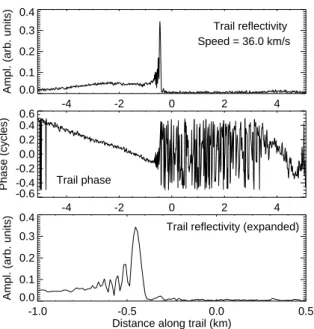
Figure 13 shows details of the trail associated with the me-teoroid moving at a speed of 36.0 km/s. The reflectivity in-dicates a short trail 200–300 m in length, with oscillations in the amplitude of the reflectivity in the trailing edge. As men-tioned above it is now known that similar oscillations are an artefact of the transform when the meteoroid is decelerating, and this may be the situation here. Alternatively, the oscilla-tions may be the effect of beating between the radar scatter-ing from diffused ionisation in the end of this short trail and scattering from the ionisation from the faster moving mete-oroid. This question may only be resolved by using a more sophisticated transform technique described in Sect. 5, where the deceleration of the meteoroid is included.
-4 -2 0 2 4 0.0 0.1 0.2 0.3 0.4
Ampl. (arb. units)
Trail reflectivity Speed = 36.0 km/s -4 -2 0 2 4 -0.6 -0.4 -0.2 0.0 0.2 0.4 0.6
Phase (cycles) Trail phase
Trail reflectivity (expanded)
-1.0 -0.5 0.0 0.5
Distance along trail (km) 0.0
0.1 0.2 0.3 0.4
Ampl. (arb. units)
Fig. 13. Outcome of the Fresnel transform of the data in Fig. 12 at a speed of 36 km/s. The oscillations in the reflectivity are interpreted as the effect of deceleration of the meteoroid.
In Fig. 14 the transform at a speed of 37 km/s is plotted. The reflectivity indicates a trail with relatively “strong” ini-tial ionization over a length of about 400 m followed by a weak trail extending at least 5 km behind the head.
The middle plot shows that the extended part of the trail has a smooth phase variation back from the head due to the wind-induced drift of the trail away from the observer. The actual drift speed is 10.9±0.1 m/s.
The reflectivity and phase plots also show a very weak trail between 3.5 and 5 km in advance of the main head. However, the magnitude is insufficient to be certain at what speed it optimises in the transform process.
In the lower plot the reflectivities of both trails are shown in expanded form. These indicate that the head associated with the 37.0 km/s meteoroid precedes the head associated with the 36.0 km/s meteoroid by about 300 m. Assuming the two meteoroids are produced by fragmentation from a common source and immediately acquire the two individual speeds, a separation of this distance would require about 0.3 s or 11 km of path. This would put the fragmentation point close to where the meteoroids enter the beam. A more likely scenario is that after fragmentation the two meteoroids have slightly different decelerations and thus move apart.
A fragmentation event that produces two products of com-parable size is likely to be triggered by either thermal or dy-namic stress, and if either occurs it must happen just prior to the commencement of ablation while the parent particle still has its solid integrity. Elford (1999) has shown that the height difference between the point of maximum thermal stress for a 40 km/s stony meteoroid and the position of the
commence--4 -2 0 2 4 0.00 0.05 0.10 0.15 0.20
Ampl. (arb. units)
Trail reflectivity Speed = 37.0 km/s -4 -2 0 2 4 -0.6 -0.4 -0.2 0.0 0.2 0.4 0.6
Phase (cycles) Trail phase
Trail reflectivity (expanded)
-1.0 -0.5 0.0 0.5
Distance along trail (km) 0.00 0.05 0.10 0.15 0.20 0.25 0.30
Ampl. (arb. units)
Fig. 14. Fresnel transform of data in Fig. 12 at a speed of 37 km/s. The expanded reflectivity plot also includes the expanded reflectiv-ity plot from Fig. 13 for a trail from a meteoroid with a speed of 36 km/s.
ment of ablation, is less than 5 km. Thus for the situation here the typical path distance from the to point back to the point
of fragmentation is unlikely to exceed 20 km, or an equiv-alent time of about 0.6 s. To achieve a speed difference of 2 km/s in this time would require a differential deceleration of 3 km/s2. Such a figure is well within expected values.
Thus it is concluded that the example analysed here is a case of gross fragmentation leading to two particles of com-parable size but sufficiently different in form that the product particles separate along a common path due to differential deceleration.
This outcome is a further example of the power of the Fres-nel transform to analyse complex radar meteor data. A fur-ther step would be to subject this case to the more advanced Fresnel transform that includes deceleration as is discussed in Sect. 5.
4.6 Overdense trails
In general overdense trails give echoes that saturate the radar system and cannot be analysed. However, an echo from a trail that is just overdense can give very useful data and an example is shown in Fig. 15. The upper plot is typical of the amplitude of an echo from an overdense trail, with a plateau followed by an exponential decay. The unwrapped phase is typical of a well-behaved radar echo. The lower plots show that the Fresnel transform for this echo optimises when the meteoroid speed is chosen as 66.3 km/s.
Figure 16 shows the results of the Fresnel transform of the data in Fig. 15. Due to the strength of the radar signals, the
0.55 0.60 0.65 0.70 0.75 0 5 10 15 arb. units amplitude 115.1 km 0.55 0.60 0.65 0.70 0.75 Elapsed time (s) -4 -20 2 4
cycles unwrapped phase
-6 -4 -2 0 2 4 6 Distance along trail (km)
0 10 20 30 40 50
Reflectivity amplitude (arb. units)
62.3 km/s 65.3 km/s 65.5 km/s 65.7 km/s 65.9 km/s 66.1 km/s 66.3 km/s 66.5 km/s 66.7 km/s 66.9 km/s 67.1 km/s 67.3 km/s 70.3 km/s
Fig. 15. Radar record of an echo from an overdense trail, charac-terised by an almost constant amplitude followed by an exponential decay. The phase plot shows a small wind drift. The lower plots show that the transform optimises at a speed of 66.3 km/s.
signal-to-noise in the reflectivity and phase is exceptionally high and the fine details of the trail structure are readily seen. Immediately behind the “head” the reflectivity remains con-stant to within ±6% for 3 km, changing to a decay that be-come precisely exponential for distances exceeding 3.5 km back from the head. This behaviour has been predicted since the early days of radar studies of meteors, and is consistent with an overdense trail being modelled as a metallic cylinder that slowly expands while the trail diffuses. Once the ion-ization density becomes underdense, scattering occurs from individual electrons and the typical exponential decay occurs in the signal amplitude and, in the case of the transformed trail, in the reflectivity.
As seen in the phase plots in Fig. 16 the Fresnel transform technique gives access to the phase of the scattering process. This can be revealed by first removing the effect of the wind-induced phase changes as shown in the two phase plots. By assuming that the whole trail drifts with the same line of sight speed the linear dependence of the phase once the trail be-comes underdense can be subtracted to produce the lowest plot. The residual phase behaviour is thus that associated with radio scattering from the overdense part of the meteor trail. As expected, the “scattering surface” moves toward the
-6 -4 -2 0 2 4 6 0 10 20 30 40 50
Ampl. (arb. units)
Trail reflectivity -6 -4 -2 0 2 4 6 -0.6 -0.4 -0.2 0.0 0.2 0.4 0.6
Phase (cycles) Trail phase
-6 -5 -4 -3 -2 -1 0 0.6 0.8 1.0 1.2 Phase (cycles)
Unwrapped trail phase Wind drift (- - -)
Wind drift subtracted
-6 -5 -4 -3 -2 -1 0
Distance along trail (km) -0.4 -0.3 -0.2 -0.1 0.0 0.1 0.2 0.3 Displacement (m)
Fig. 16. Fresnel transform of data in Fig. 15 at a speed of 66.3 km/s. The unwrapped phase plot shows that at distances further back than 3.5 km from the “head”, the phase has a linear dependence on dis-tance, as expected for a wind-induced drift toward the observer. For distances less than 3.5 km the phase has an additional component that is attributed to the scattering expected from an overdense re-gion.
observer as the trail expands, causing a reduction in the phase path. Subsequently, the scattering cylinder contracts and fi-nally disappears as the trail becomes fully transparent, i.e. underdense.
The total expansion of the “scattering cylinder” is quite small and in the example here has a maximum value of 29±1 cm. The precision of this result is quite remarkable, and has been verified by other examples of overdense trails. These precise measurements of the radar scattering charac-teristics of overdense trails are bench-marks for any future theoretical studies of radio scattering from meteoric ionisa-tion.
5 Including deceleration in the Fresnel transform
We assume that the meteoroid speed is v and its acceleration is a. With reference to Fig. 1, we consider a time t when the trail head has reached a distance x from the orthogonal point
0.4 0.5 0.6 0.7 100 200 300 400 500 Arbitrary units Amplitude Elapsed time (s) 0.4 0.5 0.6 0.7 -15 -10 -5 0 cycles Unwrapped phase -5 0 5 200 400 600 800 1000 1200 Trail reflectivity Speed = 60.5 km/s
Distance along trail (km)
Reflectivity (arbitrary units)
-5 0 5
500 1000
1500 Trail reflectivity
Speed = 63.8 km/s
Distance along trail (km)
Reflectivity (arbitrary units)
-5 0 5 500 1000 1500 Trail reflectivity Speed = 60.5 km/s Accel. = -25.0 km/s2
Distance along trail (km)
Reflectivity (arbitrary units)
Fig. 17. Upper plots are the radar records of two echoes that were recorded sequentially in the main beam and a minor lobe. The Fres-nel transforms optimise at 63.8 km/s for the first echo and 60.5 km/s for the second, a result of deceleration. See text.
Then x = vt +1 2at 2 and dx = (v + at )dt
In general a is negative indicating that the meteoroid is de-celerating at a constant rate.
In the analysis given in Sect. 2 we replaced the distance x with a normalised quantity X given by
X = x
σ, where σ = r
λRO
4π
In the situation where the a is not zero we replace vt by
vt +12at2, and assuming that at2 vt +y, some algebraic ma-nipulation leads to a generalized expression for the Fresnel transform for decelerating meteoroids as follows,
A(y) ∝ ∞ Z −∞ E(t )exp[−j (Z2+f X2Z)/2](1 + f X)dX, (6) where f =aσ v2.
For a deceleration of 10 km/s2and a speed of 30 km/s the value f is 2×10⁻³. Due to the mixed term exp(−jf X2Z/2)
the calculation of the transform given by Eq. (6) is not as straightforward as the constant speed transform given in Eq. (5), and takes considerably more time.
5.1 Example of a measured deceleration
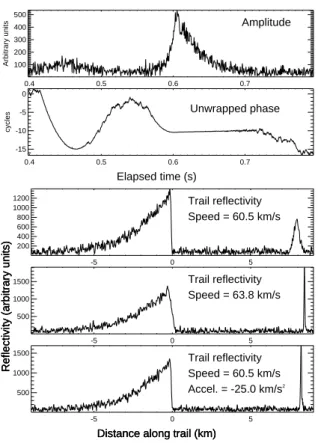
In Fig. 17 are plotted the radar records from a meteor trail that was detected first in the major lobe of the antenna and then about 150 ms later in the minor lobe. The minor lobe echo is stronger as this lobe was orthogonal to the trail and thus encompassed the topoint. The first echo between 0.4 s
and 0.5 s is characteristic of a “head echo” and the amplitude behaviour describes the polar diagram of the beam. The min-imum in the phase record is a consequence of aliasing and is a common feature in records that occur well before or after the topoint.
The Fresnel transform of this data optimised at a speed of 63.8 km/s for the echo detected first in the main beam and appears as a very narrow “spike” in the reflectivity plot. The Fresnel transform associated with the decay-type trail optimised at a speed of 60.5 km/s. The separation in time between the commencement of each transform out-come was 0.129 s, implying that the meteoroid decelerated by 3.3 km/s in that time. This is equivalent to a deceleration of 26±1 km/s2.
This result can be used to test the Fresnel transform includ-ing deceleration that was derived above, and as expressed by Eq. (6). The outcome is shown in the bottom plot in Fig. 17 where the speed at the topoint was chosen as 60.5 km/s and
the value of the acceleration was chosen as −25 km/s2to give the optimum transform for both echoes. Clearly this is an ex-cellent confirmation of the reliability of Eq. (6).
6 Discussion
The examples described above indicate the efficacy of the Fresnel transforms given by Eqs. (5) and (6), in determining the scattering function (reflectivity and phase) of a meteor trail at radio wavelengths. The use of these transforms re-veals both qualitative and quantitative information about the properties of meteor trails that, to the present, has not been accessible with other radio techniques.
Whilst the analysis was originally derived to explore the detailed trail structure near the head of the trail, a serendipi-tous outcome has been a very precise means of determining the speed of the meteoroid. Although this result depends on a qualitative assessment of the “optimum appearance” of the sharp head of the trail, a study of hundreds of such outcomes has led to a set of simple criteria that can readily lead to au-tomation of the analysis.
The ultimate resolution of the trail structure derived from the use of the Fresnel transform depends on two factors (1)
the sampling rate of the radar, and (2) the finite size of the re-ceiving antenna. Experience has shown that a radar with a prf of 2000 Hz gives very adequate resolution without aliasing or “confusion” in the output. In fact the author has explored the effects of sampling rates as low as 200 Hz. While low rates require some special procedures to avoid overlapping outputs as the speed is increased, satisfactory results are achievable.
The finite size of the receiving antenna sets an ultimate limit to the spatial resolution of the output, particularly as shown in the “sharpness of the head”. Fortunately most beam radars used for meteor studies operate at VHF frequencies and the dimensions of the antenna arrays typically are no larger than 100 m. A meteor trail with a “decay distance” of this value would occur at heights above 115 km, where the effect of the initial radius dramatically reduces the detectabil-ity of such trails in the case of most meteor radars.
As indicated in several examples, measurements of wind drift and decay rates of echoes are inherent in the outcomes of the Fresnel transforms with precisions exceeding those achievable with existing methods.
From the point of view of radar astronomy the most dra-matic outcome is two-fold, precise meteoroid speeds, and outcomes for about 90% of the detected meteor echoes. The latter result needs to be set against the early method of measuring meteoroid speeds using the post to Fresnel
os-cillations that were measurable for only about 10% of the records. Thus an order of magnitude increase in yield has been achieved without any increase in the power or sensitiv-ity of the radar.
Acknowledgements. The selection of echoes to illustrate the range of applications of the Fresnel transforms to radar meteor data and the actual calculation of the transforms were carried out by L. Campbell, to whom the author is also indebted for innumerable hours of discussion as the transform technique was developed and proved.
Edited by: D. Janches
References
Ceplecha, Z., Borovicka, J., Elford, W. G., Revelle, D. O., Hawkes, R. L., Porubcan, V., and Simek, M.: Meteor Phenomena and Bodies, Space Science Reviews, 84, 327–471, 1998.
Cervera, M. A., Elford, W. G., and Steel, D. I.: A new method for the measurement of meteor speeds: the pre-tophase technique,
Radio Science, 32, 805–816, 1997.
Elford, W. G.: Thermally induced stresses within ablating mete-oroids, edited by Baggaley, W. J. and Porubcan, V., Proceedings of Meteoroids 1998, Astron. Inst. Slovak Acad. Sci., Bratislava, 67–70, 1999.
Elford, W. G.: Novel applications of MST radars in meteor studies, J. Atmos. Solar-Terr. Phys., 63, 143–153, 2001.
Ellyett, C. D. and Davies, J. G.: Velocity of meteors measured by diffraction of radio waves from trails during formation, Nature, 161, 596–597, 1948.
McKinley, D. W. R.: Meteor Science and Engineering, McGraw Hill, New York, 1961.