Received: 20 December 2002 Accepted: 10 September 2003 Published online: 29 October 2003 © Springer-Verlag 2003
Abstract Objectives: (1)To describe the evolution of pulmonary capillary pressure (Pcap) and of the pressure drop across the pulmonary venous bed from early to established acute respiratory distress syndrome (ARDS), (2) to assess Pcap under different levels of positive end-expi-ratory pressure (PEEP) and (3) to compare the visual method and a mathematical model to determine Pcap. Design: Prospective, interven-tion study. Setting: Intensive care unit in a teaching institution. Patients: Nine ARDS patients, ac-cording to the ARDS Consensus Conference criteria. Interventions: Pulmonary arterial pressures were measured during routine respiratory mechanics measurements throughout ARDS. Four PEEP levels (6, 9, 12 and 15 cmH2O) were studied. Measurements and results: Pulmona-ry artePulmona-ry occlusions were made in triplicate at each PEEP level. Pcap was determined for every occlusion trace by three observers (visual method) and a mathematical model. Diastolic pulmonary artery pressure (PAPd) and pulmonary artery
occlu-sion pressure (PAOP) were mea-sured. The visually determined Pcap showed a bias of 2.5±2.1 mmHg as compared to the mathematical esti-mation. PAPd, Pcap and PAOP tend-ed to decrease from early to late ARDS (p=0.128, 0.265, 0.121). Pcap−PAOP (6.3±2.7 mmHg) did not change throughout ARDS. High-er PEEP levels wHigh-ere associated with increased PAPd, Pcap and PAOP, as well as with larger Pcap−PAOP throughout ARDS. Conclusions: Pulmonary capillary pressure cannot be predicted from PAOP during early and established ARDS. The high variability in Pcap−PAOP increases the risk for underestimation of filtra-tion pressures and consequently the risk for lung edema. Pcap can be es-timated at the bedside by either the visual or mathematical methods. Keywords Pulmonary capillary pressure · Pulmonary artery occlusion pressure · Pulmonary circulation · Acute respiratory distress syndrome · Acute lung injury · Positive end-expiratory pressure
Silvia Nunes Esko Ruokonen Jukka Takala
Pulmonary capillary pressures during
the acute respiratory distress syndrome
Introduction
Pulmonary capillary pressure (Pcap) cannot be measured directly. Indirect methods seek to assess the pressure in the sites where fluid leakage occurs [1]. Since Pcap is a major determinant of fluid leakage, its importance is em-phasized in the presence of increased permeability. In
ARDS, the gradient between Pcap and pulmonary artery occlusion pressure (PAOP) (Pcap−PAOP) [2, 3, 4], as well as capillary permeability [5] are increased. Evi-dence exists that reduction of Pcap may improve lung edema in the acute respiratory distress syndrome (ARDS) [6, 7]. Although it is physiologically obvious that PAOP is not a surrogate for Pcap in these circum-S. Nunes · E. Ruokonen
Critical Care Research Program, Division of Intensive Care, Department of Anesthesiology and Intensive Care,
Kuopio University Hospital, Kuopio, Finland
J. Takala (
✉
)Department of Intensive Care, Bern University Hospital—Inselspital, 3010 Bern, Switzerland
stances, Pcap is seldom assessed and PAOP is commonly used to guide fluid management in ARDS. The protec-tive approach to ventilation in ARDS advocates high positive end-expiratory pressure (PEEP) levels and low tidal volumes [8]. The effect of PEEP on Pcap and on Pcap−PAOP remains unsettled. Since Pcap−PAOP is not constant, hydrostatic pressure in the capillaries may be grossly underestimated in the clinical setting.
We hypothesized that, in ARDS, Pcap−PAOP varies over time and with PEEP level. We evaluated the evolu-tion of Pcap and Pcap−PAOP from early to established ARDS. In addition, we assessed the effect of PEEP on Pcap and Pcap−PAOP. Pcap was determined using two different methods. The reproducibility and between-method variability of computed Pcap were evaluated.
Methods
PatientsNine ARDS patients [9] were studied. Measurements were made during acute ARDS (1–3 days after diagno-sis), and repeated later (5–9 days after diagnodiagno-sis), in six patients. The study was approved by the Ethics Commit-tee. The need for informed consent was waived since the measurements required no additional instrumentation and the assessment of Pcap was performed in conjunc-tion with routine measurements of respiratory mechanics [10]. Patients were intubated and ventilated under con-trolled mode (Servo 900, Siemens-Elema, Sweden). All patients had a pulmonary arterial catheter in place for clinical purposes. Initial ventilator settings were deter-mined by the attending physician (setVt, PEEPset). Demographic and clinical data [11] are presented in Ta-ble 1.
Material
A heated pneumotachometer (Fleisch No2, Switzerland) and two differential pressure transducers (Validyne, MP45, ±2.0 and ±100.0 cmH2O; CA) were used for flow and airway opening pressure measurements. Volume was obtained by digital integration of the flow signal. Systemic and pulmonary artery pressures (SAP, PAP) and central venous pressure (CVP) were obtained from a patient monitor (AS3, Datex-Ohmeda, Finland). A phys-iologic recording system (Direc, Raytech Instruments, Canada) was used.
Protocol
Four PEEP levels (6, 9, 12 and 15 cmH2O) were used for the assessment of respiratory mechanics and, at each PEEP level, three tidal volumes (Vt) were used (setVt, a 20% higher Vt and a 20% lower Vt). Pcap measurements were made only at setVt, by occluding the pulmonary ar-tery in triplicate for a minimum of 6 s during an end-expiratory pause. Static pressures were measured and static compliance of the respiratory system calculated at each ventilator setting by the occlusion method [12].
Analysis
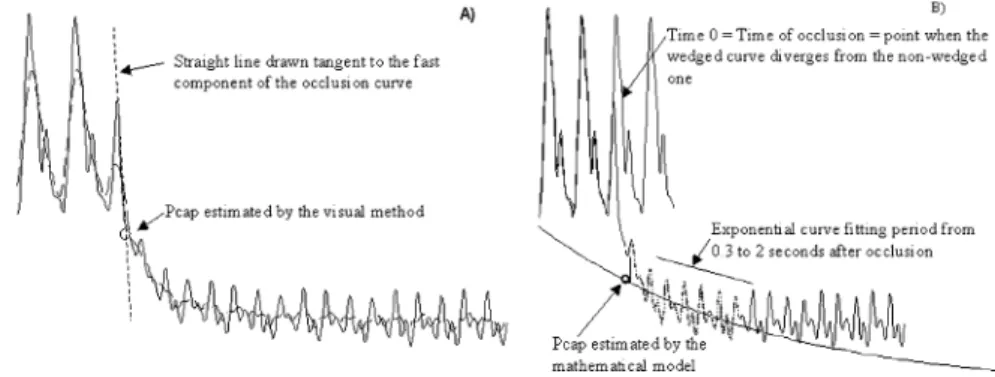
Three intensive care specialists estimated Pcap using the visual inspection method [13] (Fig. 1A). This method has been validated and used experimentally and clinical-ly [1, 2, 13]. The mathematical method chosen [14, 15] has been validated against the double occlusion method [1, 15]. We superimposed one non-occluded pulmonary artery pressure curve to the occluded curve and defined Table 1 Demographic and clinical data of the patients
Patient Age Diagnosis Outcome Day after ARDS PEEPset Static Murray
(no./sex) (year) diagnosis (cmH2O) compliance [11]
(ml/cmH2O)
1/M 28 Multiple trauma with thoracic Survived 1 10 67 2.75
and pulmonary contusion 7 8 41 2.5
2/M 37 Wegener’s granulomatosis Died 1 12 33 3.5
3/F 47 Pneumonia Survived 1 10 56 2.5 9 10 33 2.5 4/M 36 Pneumonia Survived 1 10 35 3.25 8 7 32 2.75 5/M 17 Pneumonia Survived 3 10 58 2.5 5 8 61 1.5
6/M 42 Acute hemorrhagic pancreatitis Died 3 6 38 3
7 6 38 3
7/F 70 Perforated duodenal ulcer; septic shock Survived 1 8 30 2.75
8/M 49 Pneumonia; septicemia Survived 1 6 30 2.75
6 6 30 3
9/M 22 Acute pancreatitis Survived 3 6 24 3
the moment of occlusion as the moment when the oc-cluded pressure deviated below the non-ococ-cluded tracing [16] (Fig. 1B). We fitted an exponential curve to the pressure signal at two different time periods after occlu-sion, 0.3–2.0 s as proposed by Hakim [15] (Fig. 1B) and 0.5–2.0 s. As extrapolation to time zero was shown to overestimate Pcap [17], we used extrapolation to 0.2 s after occlusion for the fitting period comprised between 0.3 and 2 s. This value approximates the most accurate extrapolation time point (152 ms after occlusion) from mono-exponential fitting [18]. An arbitrary extrapolation to 0.3 s was used with the fitting from 0.5 to 2 s. The mean PAP during the sixth second after occlusion was used as PAOP. The pressure drop across the pulmonary venous bed (Pcap−PAOP) was expressed as a fraction of the total pressure drop across the pulmonary vascular tree (PAPd−PAOP): [(Pcap−PAOP)/(PAPd−PAOP)] [16]. Pcap values determined by the three observers were averaged. Values obtained from the occlusions carried out in triplicate were averaged and used to evaluate the pressure changes across the pulmonary vasculature.
Statistics
Inter-observer and intra-observer coefficient of variation were respectively computed for Pcap estimated by the three observers for the same occlusion and for the occlu-sions carried out in triplicate. A Bland-Altman plot as-sessed the differences between Pcap analysis methods [19]. The between-method differences and effect of PEEP were assessed by multiple analysis of variance for repeated measures (SPSS for Windows). Values are pre-sented as means ± SD. A probability value of 0.05 or less was considered significant.
Results
Pulmonary artery occlusions were performed in triplicate at 59 time points, n=176 (one missing value). Thirty curves (17%) were excluded due to spontaneous respira-tory efforts (n=18), underdamping of the pulmonary tery pressure curve (n=4) and start of the pulmonary ar-tery occlusion before the expiratory pressure plateau (n=8).
Pulmonary capillary pressure values are shown in Table 2. Differences between observers were small Fig. 1 A Visual inspection
method for estimation of pul-monary capillary pressure (Pcap); B Mathematical meth-od for the estimation of Pcap
Table 2 Pulmonary capillary pressure (Pcap; means ± SD)
Pcap (mmHg) Obs. mean No. Exp0.3–2 (0.2) No. Exp0.5–2 (0.3) No.
Acute ARDS PEEP6 17.4±4.9 20 14.6±4.3 20 13.4±3.7 20
PEEP9 18.6±4.1 21 14.6±3.8 21 14.0±3.4 21
PEEP12 19.5±4.3 22 16.9±3.9 22 15.6±3.6 22
PEEP15 19.2±4.5 21 16.5±3.6 21 15.1±3.5 21
Total 18.7±4.5 84 15.7±4.0 84 14.5±3.6 84
Late ARDS PEEP6 15.2±3.0 18 13.2±2.6 18 11.6±2.3 18
PEEP9 15.0±2.4 15 13.2±3.2 15 11.9±2.6 15
PEEP12 16.2±2.7 15 14.8±3.1 15 13.5±2.9 15
PEEP15 17.5±2.3 14 16.0±3.1 14 14.7±2.8 14
Total 15.9±2.7 62 14.2±3.1 62 12.8±2.8 62
Total 17.5±4.0 146 15.1±3.7 146 13.8±3.4 146
Obs mean mean values of Pcap estimated by the three observers (visual method), Exp0.3–2 (0.2) exponential fitting from 0.3 to 2 s after occlusion extrapolated to 0.2 s after occlusion, Exp0.5–2 (0.3)
exponential fitting from 0.5 to 2 s after occlusion extrapolated to 0.3 s after occlusion, ARDS acute respiratory distress syndrome, PEEP positive end-expiratory pressure
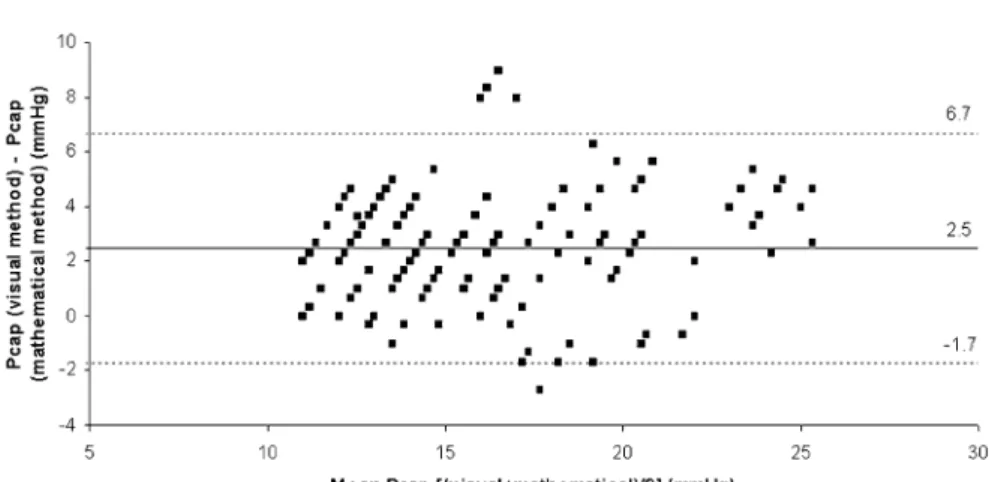
(0.3±1.7 mmHg; 95%CI 0.16 mmHg) but consistent (p=0.022). Mathematical estimations also showed small (1.2±0.9 mmHg; 95%CI 0.14 mmHg), consistent differ-ences (p<0.001). The exponential fitting from 0.5 to 2 s after occlusion did not help to avoid artifacts as com-pared to the model including a longer fitting. Only the latter was used for further analysis. The visual approach showed a bias of 2.5±2.1 mmHg as compared to the mathematical method (Fig. 2). Intra-observer coefficient of variation for the visual method ranged from 4.2±3.2% to 6.3±5.4% and was 5.0±4.6% for the mathematical model. Inter-observer variability was 5.6±4.1%.
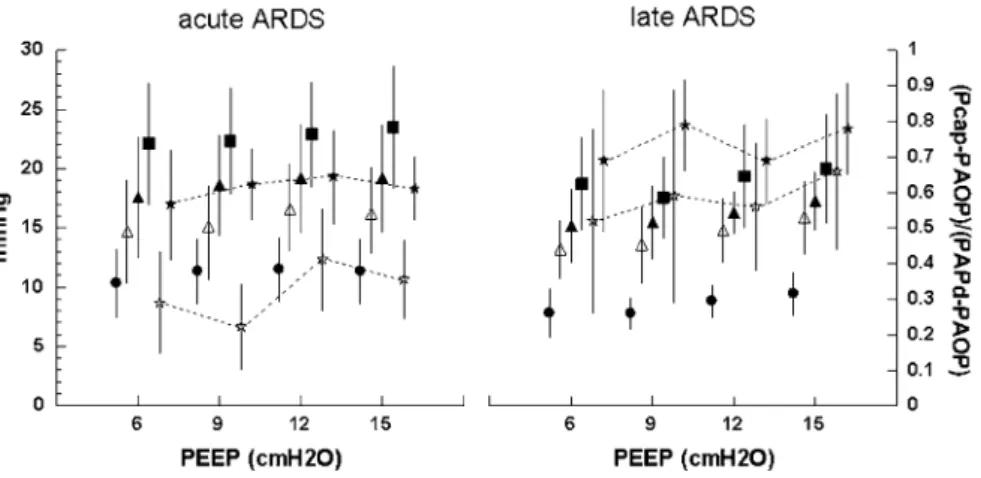
Hemodynamic data are presented in Table 3. PAPd, Pcap and PAOP tended to decrease towards late ARDS (p=0.128, 0.265, 0.121) (Fig. 3). Pcap−PAOP did not change throughout ARDS (7.7±2.7 vs 7.6±2.9 mmHg—
visual method; 4.7±2.4 vs 5.8±2.4 mmHg—mathemati-cal method). PAPd, Pcap, PAOP and Pcap−PAOP in-creased with PEEP throughout ARDS (Fig. 3). (Pcap− PAOP)/(PAPd−PAOP) tended to increase during estab-lished ARDS (p=0.085) and with PEEP (p=0.101) (PEEP-phase of ARDS interaction: p=0.029) (Fig. 3).
Discussion
We found that: (1) PAPd, Pcap and PAOP decreased from acute to established ARDS, while Pcap−PAOP re-mained unchanged, (2) Pcap and Pcap−PAOP increased with PEEP throughout ARDS and (3) Pcap can be esti-mated at the bedside by either the visual or the mathe-matical method.
Fig. 2 Bland-Altman plot com-paring mean pulmonary capil-lary pressure (Pcap) obtained by the visual method to Pcap values obtained by the mathe-matical method. Agreement (r2) between methods was 0.74
Table 3 Hemodynamic data of the patients
Patient Day after ARDS CO PAOPa PAPd-PAOPa Visual Pcapa Math. Pcapa PVR VenR/PVR
(No./sex) diagnosis (l/min) (mmHg) (mmHg) (mmHg) (mmHg) (dyne . sec/cm5)
1/M 1 12.5 7.7 13.3 14.6 10.8 84.72 0.23 7 9.9 7 13 15.7 12.1 104.70 0.39 2/M 1 8.4 15 15.3 26.7 22.2 145.45 0.47 3/F 1 3.2 –b –b –b –b –b –b 9 3.9 6.7 10.3 15 11 211.79 0.42 4/M 1 12.5 10.7 11.6 19.2 12.9 74.33 0.19 8 7.1 6.3 16 20.3 15.3 179.82 0.56 5/M 3 12 11 7.3 15.1 13.3 48.75 0.31 5 9.8 9 5.3 12.4 10.1 43.16 0.22 6/M 3 11.9 7 7 12.1 10.3 47.15 0.47 7 8 10 8.3 16.4 16.4 83.12 0.77 7/F 1 4 10.3 17.5 21.8 18 350.05 0.46 8/M 1 7.2 14 7 19 18.8 77.52 0.68 6 6.5 6 6 11.1 11 73.53 0.84 9/M 3 8.4 14.3 9.7 20.9 17.3 91.91 0.31
M male, F female, ARDS acute respiratory distress syndrome, CO cardiac output, measured prior to positive end-expiratory pressure (PEEP) manipulations, PAOP pulmonary artery occlusion pres-sure, PAPd diastolic pulmonary artery prespres-sure, Pcap capillary pulmonary pressure, PVR pulmonary vascular resistance
[(PAPd-PAOP)/CO], VenR/PVR venous pulmonary vascular resistance / total pulmonary vascular resistance
a Values obtained during the PEEP level closest to PEEPset b Data excluded due to artifacts during the pulmonary arterial
Methodological analysis
Direct measurement of Pcap in patients is not possible, but surrogate estimates can be obtained. Analysis of the post-occlusion pulmonary artery pressure trace is based on a model of pulmonary vasculature which does not in-clude the resistive component of pulmonary capillaries. Some degree of Pcap overestimation can therefore be ex-pected.
The slow inflation of the Swan-Ganz balloon decreas-es the initial slope of the occlusion curve and the separa-tion between the instantaneous drop and the slower phase is not always self-evident [15]. This may explain the higher values computed by the visual method (which uses the initial slope) as compared to the mathematical method (which uses the unaffected slower phase) (2.5±2.1 mmHg). Despite this, the two techniques had similar variability. Comparable between-method differ-ences and variability have been reported previously [3, 4, 13]. Our data comprise traces with the pulmonary ar-tery occlusion happening in every phase of the heart cy-cle. Inaccuracies may originate here, both due to the ac-centuated initial “fast component” occurring during sys-tole [15] and due to a less accurate identification of the time of occlusion during diastole [18]. However, Pcap estimations were obtained in triplicate at each PEEP lev-el and averaged for clinical analysis—a practice similar to the measurement of cardiac output.
Clinical analysis
To our knowledge, no data exist on the evolution of Pcap and Pcap−PAOP with PEEP and throughout ARDS. Our results show large, highly variable Pcap−PAOP values throughout ARDS. (Pcap−PAOP)/(PAPd−PAOP) tended to rise during established ARDS (Fig. 3) despite de-creased cardiac output. This rise may be due to a larger decrease of PAP and PAOP as compared to Pcap from the acute to the late phases of ARDS, possibly caused by a “dry-lung” approach to fluid management in our unit. PAP, Pcap, PAOP and pulmonary venous resistances have been shown to increase with PEEP [20, 21]. Our data suggest a similar behavior of Pcap and Pcap−PAOP with increasing PEEP during ARDS (Fig. 3 ). Unfortu-nately we have no data on the effect of PEEP on blood flow. If anything, PEEP would be expected to decrease cardiac output and thereby attenuate an increase in Pcap−PAOP. Since the number of patients studied was small, especially in the arbitrarily defined late phase, conclusions on the time course of Pcap throughout ARDS cannot be drawn. Despite high inter-individual variability, our data demonstrates that high Pcap may be present in established ARDS.
Assuming that elevated Pcap contributes to lung ede-ma in ARDS, highly variable Pcap−PAOP in ARDS may lead to underestimation of the risk for lung edema. This and the variability of Pcap throughout ARDS should be taken into consideration when manipulating filling pres-sures. Both the visual and mathematical methods of esti-mating Pcap are suitable for bedside use.
Fig. 3 Left Y axis (for both acute and late ARDS): Pulmonary ar-tery occlusion pressure (PAOP; circles), pulmonary capillary pres-sure (Pcap; visual method = filled triangles; mathematical method = open triangles) and diastolic pulmonary artery pressure (PAPd; squares). Right Y axis (for both acute and late ARDS): (symbols connected by a dotted line) venous component of the pressure drop across the pulmonary vasculature (Pcap−PAOP)/(PAPd− PAOP)—(Pcap determined by the visual method = filled stars; Pcap determined by the mathematical method = open stars) at dif-ferent positive end-expiratory pressure (PEEP) levels during the acute and late stage of acute respiratory distress syndrome (ARDS)
References
1. Cope DK, Grimbert F, Downey JM, Taylor AE (1992) Pulmonary capillary pressure: a review. Crit Care Med 20:1043–1056
2. Radermacher P, Santak B, Becker H, Falke KJ (1989) Prostaglandin E1 and nitroglycerin reduce pulmonary capillary pressure but worsen ventila-tion-perfusion distributions in patients with adult respiratory distress syn-drome. Anesthesiology 70:601–606 3. Radermacher P, Santak BB, Wüst HJ,
TarnowJ, Falke KJ (1990) Prostacyclin for the treatment of pulmonary hyper-tension in the adult respiratory distress syndrome: effects on pulmonary capillary pressure and ventilation-perfusion distributions. Anesthesiology 72:238–244
4. Benzing A, Geiger K (1994) Inhaled nitric oxide lowers pulmonary capillary pressure and changes longitudinal distribution of pulmonary vascular re-sistance in patients with acute lung injury. Acta Anesthesiol Scand 38:640–645
5. Levy MM (1996) Pulmonary capillary pressure and tissue perfusion: clinical implications during resuscitation from shock. New Horiz 4:504–518 6. Benzing A, Bräutigam P, Geiger K,
Loop T, Beyer U, Moser E (1995) Inhaled nitric oxide reduces pulmonary transvascular albumin flux in patients with acute lung injury. Anesthesiology 83:1153–1161
7. Grimbert FA, Parker JC, Taylor AE (1981) Increased pulmonary vascular permeability following acid aspiration. J Appl Physiol 51:335–345
8. Amato MBP, Barbas CSV, Medeiros DM, Magaldi RB, Schettino GPP, Lorenzi-Filho G, Kairalla RA, Deheinzelin D, Munoz C, Oliveira R, Takagaki TY, Carvalho CRR (1998) Effect of a protective ventilation strate-gy on mortality in the acute respiratory distress syndrome. N Engl J Med 338:347–354
9. Bernard GR, Artigas A, Brigham KL, Carlet J, Falke K, Hudson L, Lamy M, LeGall JR, Morris A, Spragg R (1994) The Consensus Committee. Report of the American-European consensus conference on ARDS: definitions, mechanisms, relevant outcomes and clinical trial coordination. Intensive Care Med 20:225–232
10. Valta P, Uusaro A, Nunes S, Ruokonen E, Takala J (1999) Acute respiratory distress syndrome: incidence, clinical course and costs of care. Crit Care Med 27:2367–2374
11. Murray JF, Matthay MA, Luce JM, Flick MR (1988) An expanded defini-tion of the adult respiratory distress syndrome. Am Rev Respir Dis 138:720–723
12. Levy P, Similowski T, Corbeil C, Albala M, Pariente R, Milic-Emili J, Jonson B (1989) A method for studying the static volume pressure curves of the respiratory system during mechanical ventilation. J Crit Care 4:83–89
13. Holloway H, Perry M, Downey J, Parker J, Taylor A (1983) Estimation of effective pulmonary capillary pres-sure in intact lungs. J Appl Physiol 54:846–851
14. Hakim TS, Michel RP, Chang HK (1982) Partitioning of pulmonary vascular resistance in dogs by arterial and venous occlusion. J Appl Physiol 52:710–715
15. Hakim TS, Maarek J-MI, Chang HK (1989) Estimation of pulmonary capillary pressure in intact dog lungs using the arterial occlusion technique. Am Rev Respir Dis 140:217–224 16. Collee GG, Lynch KE, Hill RD,
Zapol WM (1987) Bedside measure-ment of pulmonary capillary pressure in patients with acute respiratory fail-ure. Anesthesiology 66:614–620 17. Baconnier PF, Eberhard A, Grimbert
FA (1992) Theoretical analysis of occlusion techniques for measuring pulmonary capillary pressure. J Appl Physiol 73:1351–1359
18. Gilbert E, Hakim TS (1994) Derivation of pulmonary capillary pressure from arterial occlusion in intact conditions. Crit Care Med 22:986–993
19. Bland JM, Altman DG (1986) Statistical methods for assessing agree-ment between two methods of clinical measurement. Lancet 8:307–310 20. Hakim TS, Gilbert E, Camporesi E
(1993) Positive end-expiratory pressure increases capillary pressure relative to wedge pressure in the closed and open chest. J Crit Care 8:80–86
21. Koganov Y, Weiss YG, Oppenheim A, Elami A, Pizov R (1997) Positive end-expiratory pressure increases pulmonary venous vascular resistance in patients after coronary artery sur-gery. Crit Care Med 25:767–772