HAL Id: cea-02438714
https://hal-cea.archives-ouvertes.fr/cea-02438714
Submitted on 27 Feb 2020
HAL is a multi-disciplinary open access
archive for the deposit and dissemination of
sci-entific research documents, whether they are
pub-lished or not. The documents may come from
teaching and research institutions in France or
abroad, or from public or private research centers.
L’archive ouverte pluridisciplinaire HAL, est
destinée au dépôt et à la diffusion de documents
scientifiques de niveau recherche, publiés ou non,
émanant des établissements d’enseignement et de
recherche français ou étrangers, des laboratoires
publics ou privés.
Validation of the
238
U inelastic scattering cross section
through the excalibur dedicated experiment
P. Leconte, D. Bernard
To cite this version:
P. Leconte, D. Bernard. Validation of the
238U inelastic scattering cross section through the excalibur
dedicated experiment. ND2016 - International Conference on Nuclear Data for Science and Technology,
Sep 2016, Bruges, Belgium. �cea-02438714�
*
Corresponding author: [email protected]
VALIDATION OF THE U238 INELASTIC SCATTERING CROSS
SECTION THROUGH THE EXCALIBUR DEDICATED
EXPERIMENT
Pierre Leconte1,*, David Bernard1
1CEA, DEN, DER/SPRC/LEPh Cadarache, F-13108 Saint Paul-Lez-Durance, France
Abstract. EXCALIBUR is an integral transmission experiment based on the fast neutron source produced
by the bare highly enriched fast burst reactor CALIBAN, located in CEA/DAM Valduc (France). Two experimental campaigns have been performed, one using a sphere of diameter 17cm and one using two cylinders of 17cm diameter 9cm height, both made of pure Uranium 238. A set of 15 different dosimeters with specific threshold energies have been employed to provide information on the neutron flux attenuation as a function of incident energy. Measurements uncertainties are typically in the range of 0.5-3% (1σ). The analysis of these experiments is performed with the TRIPOLI4 continuous energy Monte Carlo code. A calculation benchmark with validated simplifications is defined in order to improve the statistical convergence under 2%. Various 238U evaluations have been tested: JEFF-3.1.1, ENDF/B-VII.1 and the IB36
evaluation from AIEA. A sensitivity analysis is presented to identify the contribution of each reaction cross section to the integral transmission rate. This feedback may be of interest for the international effort on 238U,
through the CIELO project.
1 Introduction
One part of the safety assessment of III and GEN-IV reactor cores is based on the nuclear data uncertainty propagation. A paper published at the PHYSOR2014 conference [1] showed that the a priori uncertainty on the radial power map for LWR-UOx cores (and its swing between the center and the periphery) is 5-6% (1σ). The main contributor to this uncertainty is the inelastic scattering cross section 238U(n,n
c’γ). Indeed, very few accurate differential data are available in EXFOR and the calculation of this inelastic cross section to the continuum of such a heavy nuclide is very hard to perform due to highly coupling phenomena in its complex nuclear level scheme, leading to quite large uncertainties (10-15% on the plateau). A second paper [2] underlined the probable overestimation of the evaluated cross section in JEFF-3.1.1 at En=[2;5]MeV by about (10±3)%, based on the feedback of a set of clean integral experiments.
These two papers (plus [3]) justify the dedicated experimental program called EXCALIBUR (EXperiment in CALIBAN on URanium 238) that was initiated to give a new basis for the validation of 238U nuclear data at neutron fission energies. The general idea is to perform a neutron transmission experiment through 238U material. This paper describes the experiment and presents a preliminary analysis that was performed with the TRIPOLI4 continuous energy Monte-Carlo code.
2 Description of the experimental set-up
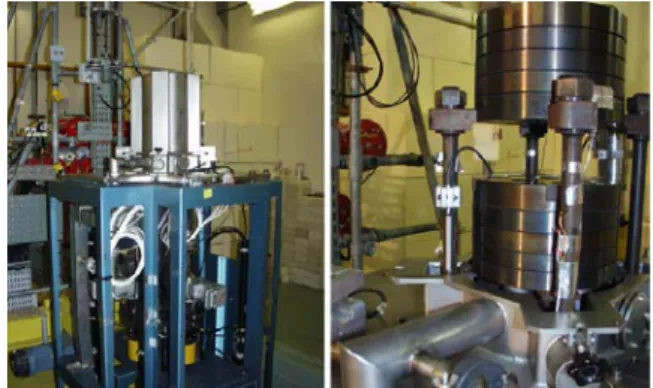
The CALIBAN [4] reactor (see Fig. 1) is located at the CEA Valduc center in France and belongs to the unreflected highly enriched uranium (HEU) metal fast burst reactor family, like GODIVA in the USA. The CALIBAN reactor is made of ten fuel discs and four rods of 93.5% enriched-uranium metal alloyed with 10wt% molybdenum, with a combined weight of 113kg.Fig. 1. CALIBAN reactor core (Left: core with cover; Right:
the fuel core uncovered)
The experiment is performed in two phases, based on the availability of two kinds of Uranium pieces. In the first campaign, a sphere of diameter 170mm is employed, while in the second one, two cylinders of individual thickness 90mm and diameter 170mm were used.
Fig. 2. The sphere (left-side) and cylinder (right-side)
experimental campaigns
In both experiment, the same principle was applied: the neutron attenuation through various thickness of Uranium is measured using neutron activation foils. This attenuation is characterized by the Integral Transmission Rate (ITR), noted 𝑇𝑇𝑖𝑖(∆𝑥𝑥) which is defined as follows:
𝑇𝑇𝑖𝑖(∆𝑥𝑥) =𝑅𝑅𝑖𝑖(∆𝑥𝑥)
𝑅𝑅𝑖𝑖(0) (1) 𝑅𝑅𝑖𝑖(0) and 𝑅𝑅𝑖𝑖(∆𝑥𝑥) are respectively the microscopic
activation rate, for the dosimeter referred with index i located in the front position with respect to incident neutron flux, and behind a Uranium thickness of ∆𝑥𝑥. The dosimeter lists covers a wide range of fast energy threshold reactions, with E50%a values ranging from 2.4 to 8.4 MeV: 103Rh(n,n’), 115In(n,n’), 238U(n,f), 54Fe(n,p), 56Fe(n,p), 58Ni(n,p), 46Ti(n,p), 47Ti(n,p), 48Ti(n,p), 24Mg(n,p).
A special care was paid to the dosimeter positions at the different irradiation positions. Dosimeter activities were counted by γ-spectrometry in various laboratories with HPGe detectors. All measurements were duplicated in time and were done sometimes in different laboratories, involving different teams, detector geometries, acquisition chains and software in order to cross-check the results. More details on how the reaction rates were derived from activity measurements are presented in reference [5].
3 Calculation route
3.1. Geometrical model
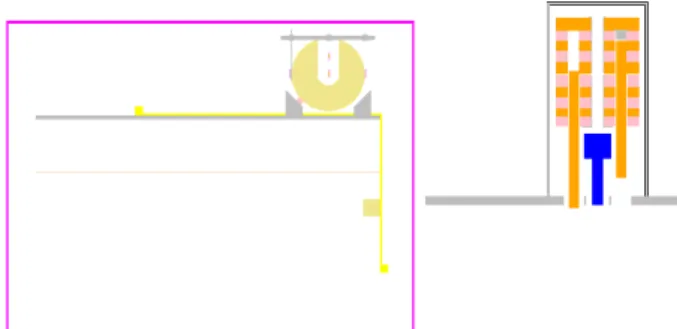
An accurate 3D model of each experiment was realized based on the TRIPOLI4 input file provided in the ICSBEP/HMF-080 report [4]. In addition to the modelling of the CALIBAN core, we included the geometry of the reactor cell and the pit below the floor level (storeroom for the reactor after the burst) as the concrete walls are responsible for a significant low energy neutron background. The experimental device was modelled as accurately as possible: support table, support for the Uranium pieces, plastic bags containing
aEnergy corresponding to 50% of the total activation rate in a 252Cf
reference spectrum
the dosimeters, dosimeter support and even the holding net were described (see Fig 3).
Fig. 3. XZ cross section view of the sphere experiment model
3.2. The two-step global/local methodology
A first test calculation was performed during 24 hours over 512 CPUs: the reaction rate in the dosimeter volumes failed to go below 10% uncertainty, especially for high energy threshold reactions like 56Fe(n,p) where it reached 40%. Even by increasing the number of CPUs and computation time, it was concluded that reaching less than 2% for all the reaction rates was too much time-consuming.
Instead of this “brute force” approach, a two-step methodology was preferred. It is composed of a first step criticality calculation which is used to calculate the properties of the incoming neutron source over the experimental set-up. A fictive volume, represented on Fig. 3 by the pink rectangle, was defined around the table that supports the Uranium pieces, in order to store every incoming neutron properties. The code generates as many storage files for neutron properties as independent run of the same input files. Then in a second step, the computation is made in a “fixed source criticality” mode where the neutrons are read from each storage files saved from the first step. Leakage conditions are imposed at the edge of the fictive volume where the particles were stored, so the reactor core and reactor cell geometry can be removed to improve the computation time.
3.3. Numerical validation
The previously defined two-step methodology was defined in collaboration with the TRIPOLI4 project team and was validated on a simplified numerical benchmark, against a one-step approach that can be calculated in a reasonable calculation time. The benchmark consists of a 2D cartesian geometry: a central fissile zone shielded with boron carbide, two 9x18cm Uranium pieces, three 0.1x9cm activation foils and concrete walls with thickness and dimensions close to the actual CALIBAN
reactor cell. The improvement in calculation
convergence compared with the reference model described in §3.1 is obtained thanks to larger volumes for the activation foils, infinite geometry along Z-axis and symmetry conditions that reproduced the Uranium piece symmetrically with respect to Y-axis.
The comparison between the one-step and the two-step methods for the calculation of several ITR values is summarized in Table 1. The ε represents the relative difference between the two calculations and σ is the combination of uncertainties on both calculations.
Table 1. Validation of the two-step approach against a
reference one-step approach on the calculation of the ITR
Activation reaction Uranium thickness ∆𝑥𝑥 = 9cm Uranium thickness ∆𝑥𝑥 = 18cm Relative difference ε Relative uncertainty σ Relative difference ε Relative uncertainty σ 103Rh(n,n’) -0.1% 0.1% 0.0% 0.1% 115In(n,n’) 0.0% 0.1% 0.0% 0.1% 56Fe(n,p) 0.3% 0.3% -1.4% 0.7% 54Fe(n,p) 0.1% 0.1% 0.0% 0.2% 47Ti(n,p) 0.0% 0.1% 0.0% 0.2%
An excellent agreement is observed for the two-step approach compared with the one-step one, all the relative differences ε staying below 2σ uncertainty. As a consequence, this approach is shown to be relevant for the analysis of the actual EXCALIBUR experiment.
3.4. Model simplifications
In order to improve the calculation time to perform sensitivity and uncertainty analysis, we have made some model simplifications. This step is motivated by the fact that a rigorous approach would involve the calculations of two configurations for each experiment. Indeed, dosimeters were stacked in piles of three or four different dosimeters for each of the two irradiations. The definition of a single model with fictive void volumes to calculate the different activation responses would avoid the calculation of each specific dosimeter arrangement considering that the contribution of the dosimeter piles to the neutron flux attenuation are almost negligible. Moreover, the dosimeter holder and the plastic bags that contain the dosimeters have been judged to have a very limited effect on the calculated reaction rates and have been removed from the benchmark model. As a consequence, we have evaluated correction factors to account for these model simplifications, by comparing the results in the reference and in the benchmark models. Table 2 summarizes some of these factors.
Table 2. Correction factors due to
geometrical model simplifications Activation reaction Sphere Experiment ∆𝑥𝑥 = 6cm ∆𝑥𝑥 = 12cm 103Rh(n,n’) 0.959 1.013 115In(n,n’) 0.973 1.031 56Fe(n,p) 1.012 1.067 54Fe(n,p) 0.998 1.071
Correction factors are higher or lower than unity depending on the dosimeter position in each pile. Indeed, as the actual dosimeter pile were 2 to 4mm thick, the benchmark model results in a single 0.1mm thick volume which moves the volume where the reaction rates are scored in the sense of higher or lower neutron flux. Nevertheless, all these corrections are close to unity, it justifies the definition of a single benchmark model that improves by twice the calculation time.
4 Comparison between measurements
and calculations
The comparison between the calculated (C) and the measured (E) ITR are presented in Table 3 and Table 4 using firstly respectively the JEFF-3.1.1 nuclear data library, and secondly the same input file but with the substitution of JEFF-3.1.1 evaluation for 238U by the one from CIELO (AIEA IB36 file). For the time being, the reported uncertainties only include the contributions of measurements (mainly the random uncertainty due to γ-counting) and of the Monte-Carlo convergence.
Table 3. C/E-1 (in % with uncertainties at 1σ) on the ITR,
based on TRIPOLI4.9 and JEFF-3.1.1 nuclear data library Activation
reaction E50% (MeV)
Sphere Experiment Cylinder Experiment ∆𝑥𝑥 = 6cm ∆𝑥𝑥 = 12cm ∆𝑥𝑥 = 9cm ∆𝑥𝑥 = 18cm 103Rh(n,n’) 2.4 -1.3 ± 0.7 -3.6 ± 0.7 -10.1 ± 0.6 -14.5 ± 1.1 115In(n,n’) 2.7 -1.8 ± 1.0 -5.1 ± 1.8 -12.8 ± 0.6 -18.9 ± 1.5 238U(n,f) 2.8 ● ● -17 ± 7 -16 ± 16 47Ti(n,p) 3.8 ● ● -13.0 ± 0.8 -16.9 ± 2.1 58Ni(n,p) 4.2 ● ● -8.9 ± 0.3 -14.2 ± 0.5 54Fe(n,p) 4.3 -1.7 ± 0.6 -1.7 ± 0.6 -9.9 ± 0.5 -15.8 ± 0.8 46Ti(n,p) 6.1 ● ● -10.5 ± 0.7 -17.4 ± 1.1 56Fe(n,p) 7.6 -2.6 ± 1.7 0.2 ± 0.9 -7.4 ± 1.6 -13.9 ± 1.8 24Mg(n,p) 8.3 ● ● -8.5 ± 1.7 -16.9 ± 1.7 48Ti(n,p) 8.4 ● ● -5.3 ± 2.5 -14.6 ± 4.5
Table 4. C/E-1 (in % with uncertainties at 1σ) on the ITR,
based on TRIPOLI4.9 and JEFF-3.1.1 nuclear data library, with the substitution of 238U evaluated file with the one from
CIELO (IAEA_IB36) Activation
reaction E50% (MeV)
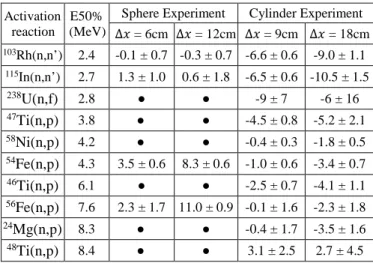
Sphere Experiment Cylinder Experiment ∆𝑥𝑥 = 6cm ∆𝑥𝑥 = 12cm ∆𝑥𝑥 = 9cm ∆𝑥𝑥 = 18cm 103Rh(n,n’) 2.4 -0.1 ± 0.7 -0.3 ± 0.7 -6.6 ± 0.6 -9.0 ± 1.1 115In(n,n’) 2.7 1.3 ± 1.0 0.6 ± 1.8 -6.5 ± 0.6 -10.5 ± 1.5 238U(n,f) 2.8 ● ● -9 ± 7 -6 ± 16 47Ti(n,p) 3.8 ● ● -4.5 ± 0.8 -5.2 ± 2.1 58Ni(n,p) 4.2 ● ● -0.4 ± 0.3 -1.8 ± 0.5 54Fe(n,p) 4.3 3.5 ± 0.6 8.3 ± 0.6 -1.0 ± 0.6 -3.4 ± 0.7 46Ti(n,p) 6.1 ● ● -2.5 ± 0.7 -4.1 ± 1.1 56Fe(n,p) 7.6 2.3 ± 1.7 11.0 ± 0.9 -0.1 ± 1.6 -2.3 ± 1.8 24Mg(n,p) 8.3 ● ● -0.4 ± 1.7 -3.5 ± 1.6 48Ti(n,p) 8.4 ● ● 3.1 ± 2.5 2.7 ± 4.5
Results from Table 3 are indicating two different trends for the JEFF-3.1.1 evaluation of 238U. For the sphere experiment, only a very small underestimation of ~2% of the ITR is observed for both ∆𝑥𝑥 = 6cm and ∆𝑥𝑥 = 12cm. For the cylinder experiment, there is a consistent trend to underestimate the ITR obtained from the different dosimeters with E50% between 2 and 5 MeV, of ~11% for ∆𝑥𝑥 = 9cm and of ~16% for ∆𝑥𝑥 = 18cm.
Results from Table 4 show significant improvements for the sphere experiment: the average C/E-1 is reduced from -11% to -3% for ∆𝑥𝑥 = 9cm and from of 16% to -4% for ∆𝑥𝑥 = 18cm. A slightly higher bias is observed for the lowest energy dosimeters (Rh and In). For the sphere experiment, only the Rh and In are improved, contrary to 54Fe and 56Fe which are worse than with JEFF-3.1.1.
From this preliminary analysis, the inconsistent trends for the common dosimeters between the two experiments, Rh, In, 54Fe and 56Fe, does not seem to be reduced by the change in the 238U evaluation. As the geometry and composition of the two 238U pieces differ, a sensitivity analysis would be required to evaluate any specific effect that would be encountered in one experiment and not in the other one. Furthermore, the influence of material data uncertainty on the ITR is an important factor to evaluate to justify these differences.
5 Sensitivity / uncertainty analysis
5.1. Calculation of sensitivity coefficients
The correlated sampling [7] feature of the TRIPOLI4 code was used to calculate sensitivity coefficients, defined as the relative change in the ITRi due to a relative change of 1% in the cross section σi of 238U - with σi = capture, fission, elastic, inelastic or (n,xn) reactions (for the time being, it is not possible to get the sensitivity coefficient due to prompt neutron multiplicity neither due to double differential data like for instance the energy or angular distribution of inelastic scattering). The 1-group sensitivity coefficients for 238U and 235U reactions are presented in Table 5 while the sensitivity profile as a function of neutron incident energy is plotted in Fig. 5 for the ITR obtained from the activation of 54Fe. The sensitivity coefficient breakdown shows a
predominant effect due to 238U(n,inel) in both
experiment. A saturation effect is observed in the cylinder experiment between ∆𝑥𝑥 = 9cm and ∆𝑥𝑥 = 18cm where the sensitivity coefficient of 238U(n,inel) is only multiplied by 1.5, while the sensitivity coefficient to 238U(n,el) shows a linear behaviour with the Uranium thickness. The contribution of 238U(n,f) stays rather small for intermediate energy dosimeters but it becomes equivalent to the sensitivity of 238U(n,el) for high energy threshold reaction like 56Fe(n,p) where the increase of 238U fission probability with neutron energy reduces the number of transmitted neutrons through the block.
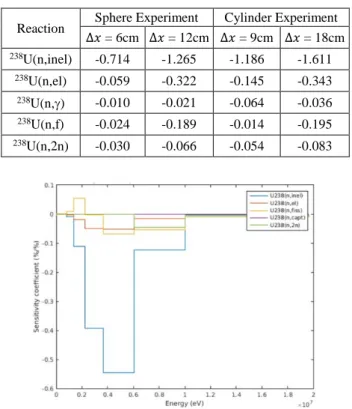
Table 5. Sensitivity coefficients for 54Fe activation
Reaction Sphere Experiment Cylinder Experiment ∆𝑥𝑥 = 6cm ∆𝑥𝑥 = 12cm ∆𝑥𝑥 = 9cm ∆𝑥𝑥 = 18cm 238U(n,inel) -0.714 -1.265 -1.186 -1.611 238U(n,el) -0.059 -0.322 -0.145 -0.343 238U(n,γ) -0.010 -0.021 -0.064 -0.036 238U(n,f) -0.024 -0.189 -0.014 -0.195 238U(n,2n) -0.030 -0.066 -0.054 -0.083
Fig. 5. Sensitivity energy distribution for 54Fe activation
5.2. Uncertainty analysis due to material data
The dimensions of each Uranium piece were measured with rather rudimentary means, using a rule and a caliper. They measurement uncertainty is supposed to be ±0.6mm, assuming a ±1mm tolerance with a constant probability distribution over this range. The mass of each Uranium piece (40-50kg) was measured with a weighing machine with an accuracy of 20g, so it is less than 0.1% in relative uncertainty. As a consequence, any change in the Uranium dimensions may be reported on the material density to stay consistent with the very accurate measurement of the total mass. Moreover, as the density of each piece is also very accurately known by the manufacturing process, there is an additional constraint for the dimensions to stay within the limits of the volume that is deduced from density and mass measurements. The positions of the dosimeters were controlled thanks to their position on the aluminium plates that hold them and based on the relative position of the stainless steel rod that hold these plates. The position uncertainty of the dosimeters with respect to the Uranium pieces are assumed to be ±1mm in X (as the dosimeters are placed in contact with the Uranium) and ±2mm in Y and Z, according to the axe definition of Fig. 3. The distance and vertical position of each Uranium piece with respect to the CALIBAN core is assumed to known at ±5mm. All these uncertainties have been propagated to the calculated ITR, by generating as many input files as input parameters to be tested. The range of variation for each parameter was enlarged to improve the statistical convergence of small differential effects.
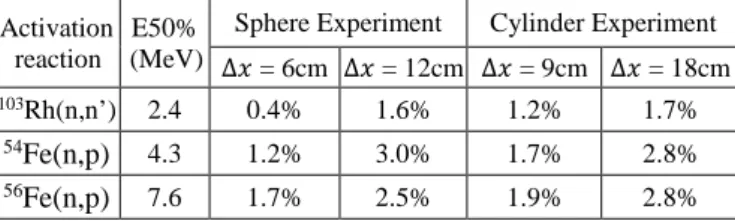
Tables 6 and 7 gather the most important factors in the uncertainty budget due to material data. Other sources of uncertainty have been shown negligible.
Table 6. Uncertainty component due to Uranium dimensions
Activation reaction
E50% (MeV)
Sphere Experiment Cylinder Experiment ∆𝑥𝑥 = 6cm ∆𝑥𝑥 = 12cm ∆𝑥𝑥 = 9cm ∆𝑥𝑥 = 18cm
103Rh(n,n’) 2.4 0.4% 1.6% 1.2% 1.7%
54Fe(n,p) 4.3 1.2% 3.0% 1.7% 2.8%
56Fe(n,p) 7.6 1.7% 2.5% 1.9% 2.8%
Table 7. Uncertainty component due to the dosimeter positions
Activation reaction
E50% (MeV)
Sphere Experiment Cylinder Experiment ∆𝑥𝑥 = 6cm ∆𝑥𝑥 = 12cm ∆𝑥𝑥 = 9cm ∆𝑥𝑥 = 18cm
103Rh(n,n’) 2.4 0.4% 2.9% 0.3% 0.2%
54Fe(n,p) 4.3 0.6% 2.9% 0.3% 0.3%
56Fe(n,p) 7.6 0.7% 3.3% 0.5% 0.7%
The uncertainty on Uranium dimensions is increasing with Uranium thickness as the logarithm of the ITR is almost linear with the Uranium thickness. Its contribution is larger in the sphere experiment than in the cylinder one, due to a greater number of parameters to describe the geometry of the piece, especially the diameter and height of the central cavity. The contribution of the position uncertainty of the dosimeters is found to be rather small for the cylinder experiment, typically less than 1%, but it is shown to be larger for the ∆𝑥𝑥 = 12cm position in the sphere experiment. This is related to a larger sensitivity of the mean migration distance for incoming neutrons that are getting through the Uranium material, due to the changes in the dosimeter position, which is more influenced by the spherical shape than by the cylindrical one.
Combining all these material data uncertainties, we end up with an overall uncertainty of 2-4% for the dosimeters in the sphere experiment and of 2-3% for the ones in the cylinder experiment. In spite of this, it seems that the difference in trends derived from the sphere and the cylinder experiments for the common dosimeters of rhodium, indium and iron, cannot be fully justify by the uncertainty budget.
6 Conclusions
This first interpretation of the EXCALIBUR experiment, that was designed to validate the inelastic scattering cross section of 238U, despite some inconsistent trends which are still needed to be addressed, is showing that the new evaluation that have been proposed through the CIELO project is giving great improvement in the prediction of a large set of experimental results, compared with what was obtained with JEFF-3.1.1. This is mainly due to a reduction of ~8% of the mean plateau value for 238U(n,inel) between 2 et 5 MeV.
The work is still ongoing to try to solve some of the inconsistencies that are observed between the two
experiments. Two solutions are considered
simultaneously. On the first hand, we are planning more accurate metrology to be done on the two Uranium pieces by the end of year 2016, in order to confirm the dimensions and reduce its contribution to the total uncertainty budget. On the second hand, a third experiment is scheduled to be performed in JRC Geel, using the GELINA neutron source and several thick Uranium disks available at JRC Geel.
The final goal of this project would be to produce an experimental correlation matrix on the different ITR, before being able to realize an integral data assimilation analyse with the CONRAD code, in order to provide multigroup trends and associated covariances that can be helpful for evaluation purpose just like for sensitivity analysis on a selection of reactor physics benchmarks.
Acknowledgments
The authors would like to acknowledge the TRIPOLI4 project team for the fruitful discussions on how to build the two-step calculation approach. Authors are also grateful to the CEA/DAM colleagues from Valduc for their involvement in this project. Authors would like also to acknowledge CEA partners EDF and AREVA for their financial support within the I3P institute.
References
1. A. Santamarina, P. Blaise, N. Dos Santos, C. Vaglio-Gaudard, Nuclear data uncertainty propagation on Power Maps, PHYSOR 2014, Kyoto, Japan, September 28 – October 3, 2014.
2. A. Santamarina, D. Bernard, P. Leconte, J-F. Vidal, Improvement of 238U Inelastic Scattering Cross-Section for an Accurate Calculation of Large Commercial Reactors, Nuclear Data Sheets 118(1):118–121, April 2014.
3. OECD/NEA, High Priority Request List.
4. N. Authier, B. Mechitoua, Bare, highly enriched uranium. Fast burst reactor CALIBAN, OECD/NEA/NSC/DOC/(95)03/II Volume II, HEU-MET-FAST-080.
5. D. Bernard, P. Leconte, P. Casoli et al., EXCALIBUR@CALIBAN: a neutron transmission experiment for 238U(n,n’
continuumγ) nuclear data validation, Proc. Of the Int. Conf. ANIMMA2015, Lisbone, Portugal, 20-24 April 2015.
6. E. Brun, F. Damian, C.M. Diop et al., TRIPOLI-4®, CEA, EDF and AREVA reference Monte Carlo code, Annals of Nuclear Energy, Volume 82, August 2015, Pages 151-160, ISSN 0306-4549.
7. G. Dejonghe, J. Gonnord, J.C. Nimal, Perturbation calculations by the correlated samples method. In: Proc. of the Int. Meeting on Advances in Nuclear Engineering Computational Methods, Knoxville, TN USA, 1985.