HAL Id: hal-00001333
https://hal.archives-ouvertes.fr/hal-00001333
Preprint submitted on 19 Mar 2004
HAL is a multi-disciplinary open access
archive for the deposit and dissemination of
sci-entific research documents, whether they are
pub-lished or not. The documents may come from
teaching and research institutions in France or
abroad, or from public or private research centers.
L’archive ouverte pluridisciplinaire HAL, est
destinée au dépôt et à la diffusion de documents
scientifiques de niveau recherche, publiés ou non,
émanant des établissements d’enseignement et de
recherche français ou étrangers, des laboratoires
publics ou privés.
An emission ring at 20 microns around the HAEBE star
AB Aurigae: unveiling the disc structure
Eric Pantin, Jeroen Bouwman, Pierre-Olivier Lagage
To cite this version:
Eric Pantin, Jeroen Bouwman, Pierre-Olivier Lagage. An emission ring at 20 microns around the
HAEBE star AB Aurigae: unveiling the disc structure. 2004. �hal-00001333�
ccsd-00001333 (version 1) : 19 Mar 2004
(DOI: will be inserted by hand later)
An emission ring at 20.5 µm around the HAEBE star
AB Aurigæ: unveiling the disc structure
E. Pantin
1, J. Bouwman
1, and P.O Lagage
1DSM/DAPNIA/Service d’Astrophysique, CEA/Saclay, F-91191 Gif-sur-Yvette, France Submitted to Astronomy & Astrophysics Letters
Abstract. Isolated HAEBE stars are believed to represent an intermediate stage of objects between young stellar objects surrounded by massive, optically thick, gaseous and dusty disks and Vega like stars surrounded by debris disks. The star AB Aurigæ is already known for being surrounded by an intermediate-stage dust disk emitting a fairly large infrared and (sub-)millimetric excess. Until now, the outer disk structure has only been resolved at millimeter wavelengths and at optical wavelength coronographic imaging. We have obtained 20 µm images which show an unexpected ellipse-shaped disk structure in emission at a distance of about 260 AU from the central star. Large azimuthal asymmetries in brightness can be noticed and the center of the ellipse does not coincide with the star. A simple, pure geometrical model based on an emission ring of uniform surface brightness, but having an intrinsic eccentricity succeeds in fitting the observations. These observations give for the first time clues on a very peculiar structure of pre-main-sequence disk geometry, i.e. a non uniform increase in the disk thickness unlike the common usual sketch of a disk with a constant flaring angle. They provide also valuable informations on the disk inclination as well as its dust composition; at such a large distance from the star, only transient heating of very small particles can explain such a bright ring of emission at mid-infrared wavelengths. Finally, the increase of thickness inferred by the model could be caused by disk instabilities; the intrinsic eccentricity of the structure might be a clue to the presence of a massive body undetected yet.
Key words.Circumstellar matter – Stars: formation – Stars: pre-main-sequence
1. Introduction
Herbig Ae/Be (HAEBE) stars represent a class of interme-diate mass, pre-main-sequence (PMS) stars, first described as a group by Herbig (1960). The circumstellar (CS) disks found around these stars are believed to be the sites of on-going planet formation. By studying the characteris-tics and evolution of the CS disk and its dust composi-tion, valuable insights can be obtained into the processes leading to the formation of planets, and put constraints on disk and planet formation models. Infrared spectroscopy obtained with the Infrared Space Observatory (ISO) has given us insight into the dust composition of sample of iso-lated HAEBE systems (e.g. Bouwman et al. 2000a, 2001; Meeus et al. 2001). While these spectra reveal a rich min-eralogy, no direct information concerning the spatial dis-tribution of the different dust species can be inferred from the ISO data. Most studies so far have used the available spectral energy distributions (SEDs) to put constraints on the spatial distribution of the CS material. Models for passively heated disks surrounding PMS stars are
success-Send offprint requests to: E. Pantin Correspondence to: epantin@cea.fr
ful in reproducing the ISO spectra (e.g. Dullemond et al. 2001; Dominik et al. 2003a), but these models cannot be uniquely constrained from SED fitting alone Bouwman et al. (2000b), for this spatially resolved imaging, as pre-sented in this paper, is required.
Among isolated HAEBE systems, the disk around AB Aurigæ is one of the most interesting and studied. Its star has a probable age of 2 Myr (van den Ancker et al. 1997), indicating that, according to current planet for-mation theories, planet building could still being ongo-ing in this system. ISO spectra show strong PAH emis-sion bands, and emisemis-sion from silicates, and carbonaceous dust grains (van den Ancker et al. 2000; Bouwman et al. 2000a). Though the inferred grain sizes are differing from interstellar grains, the dust around AB Aur seems to be relatively unprocessed, indicating an evolutionary young system. This seems also to be confirmed by combined ISO-SWS and sub-millimeter observations of H2and CO
rota-tional lines, demonstrating that the disk still has a large gas content (Thi et al. 2001). Its disk has been resolved in the millimeter range by Mannings & Sargent (1997), show-ing a structure consistent with a Keplerian disk. Its sur-rounding nebulae and outer disk structure were also
stud-2 E. Pantin et al.: An emission ring around AB Aurigæ 0000000000000000000000000 0000000000000000000000000 0000000000000000000000000 0000000000000000000000000 0000000000000000000000000 0000000000000000000000000 0000000000000000000000000 0000000000000000000000000 0000000000000000000000000 0000000000000000000000000 0000000000000000000000000 0000000000000000000000000 0000000000000000000000000 0000000000000000000000000 0000000000000000000000000 0000000000000000000000000 0000000000000000000000000 0000000000000000000000000 0000000000000000000000000 0000000000000000000000000 0000000000000000000000000 0000000000000000000000000 0000000000000000000000000 0000000000000000000000000 0000000000000000000000000 0000000000000000000000000 0000000000000000000000000 0000000000000000000000000 0000000000000000000000000 0000000000000000000000000 0000000000000000000000000 0000000000000000000000000 0000000000000000000000000 0000000000000000000000000 0000000000000000000000000 0000000000000000000000000 0000000000000000000000000 0000000000000000000000000 0000000000000000000000000 1111111111111111111111111 1111111111111111111111111 1111111111111111111111111 1111111111111111111111111 1111111111111111111111111 1111111111111111111111111 1111111111111111111111111 1111111111111111111111111 1111111111111111111111111 1111111111111111111111111 1111111111111111111111111 1111111111111111111111111 1111111111111111111111111 1111111111111111111111111 1111111111111111111111111 1111111111111111111111111 1111111111111111111111111 1111111111111111111111111 1111111111111111111111111 1111111111111111111111111 1111111111111111111111111 1111111111111111111111111 1111111111111111111111111 1111111111111111111111111 1111111111111111111111111 1111111111111111111111111 1111111111111111111111111 1111111111111111111111111 1111111111111111111111111 1111111111111111111111111 1111111111111111111111111 1111111111111111111111111 1111111111111111111111111 1111111111111111111111111 1111111111111111111111111 1111111111111111111111111 1111111111111111111111111 1111111111111111111111111 1111111111111111111111111
Fig. 1. Image of the AB Aurigae disk at 20.5 µm. The left figure shows the deconvolved image, with a pixel scale of 0.3′′/pixel. Clearly visible is a resolved central emission region surrounded by a ring like structure. The panels on
the right show the normalized intensity profiles along a cut through the CAMIRAS images of 2 reference stars and AB Aur. The upper right panel shows the comparison between two observations of reference stars, demonstrating the stability of the PSF. The panel on the lower right shows a comparison of AB Aur with the PSF, clearly showing that the central emission is extended and that a ring-like emission structure is also detected in non deconvolved data.
ied in the visible range using broad-band coronographic observations (Grady et al. 1999), showing a disk with spiral-shaped structures. Near-IR interferometric (Millan-Gabet et al. 1999, 2001; Eisner et al. 2003), have resolved the inner parts of the disk, showing it to be consistent with a passive disk with an inner hole, seen at a low (≤ 40◦)
inclination angle. Recent mid-IR imaging (Chen & Jura 2003), has also resolved the inner structure, showing it to originate from thermal emission from dust grains heated by the stellar radiation field near the central star. Here we present mid-IR imaging, not only resolving the ther-mal emission from dust close to the central star, but also an emission structure at the outer parts of the disk. In the next sections we will describe these observations and pro-pose a pure geometrical model for explaining our results, unlike the paradigm according to which gravitational in-teractions with massive bodies are inferred when observ-ing brightness asymmetries in dusty disks.
2. Data collection and Reduction
The observations were performed using the CEA mid-IR camera CAMIRAS (Lagage et al. 1992), equipped with a Boeing 128x128 pixels BIB detector sensitive up to a wavelength of ≈ 28 µm. AB Aurigæ was observed from the CFH 3.6m telescope on 1999 August 1 and between 2000
March 16 and March 20. During these two runs, seeing and weather conditions – humidity and amount of atmospheric precipitable water – were particularly favorable and ex-tremely stable in time. We spent a total integration time on AB Aurigæ of 2h split into several nights. Each dataset was reduced independently in order to avoid any erroneous conclusion due for instance to some corrupted dataset; it permits also to evaluate error bars on our results. The ori-entation of the array on the sky was carefully determined at the start of each observing run. The pixel size was 0.29′′.
In the 20 µm window, we used a filter centered at 20.5 µm and with a bandpass (FWHM) ∆λ = 1.11 µm. This fil-ter is free of any important atmospheric line contribution. The source was always observed at an airmass of less than 1.3. Standard chopping and nodding techniques were ap-plied with a chopping throw of 16′′ North and nodding
amplitude of 20′′West. A shift-and-add procedure was
ap-plied to each final cube of images using a correlation based method with a re-sampling factor of 4:1. In order to get the best spatial resolution in the dataset, the nodding di-rection was perpendicular to the chopping didi-rection, re-sulting in an image containing four times the image of the source. The four sources were extracted and co-added us-ing a cross-correlation method. Finally, each independent dataset was deconvolved separately before co-addition to
Fig. 2. The structure of the emission ring as an function of azimuth, compared with our best-fit model. Plotted are, from left to right, top to bottom, with the solid lines, the ring radius, its width (fwhm), and its intensity profile as a function of azimuthal angle (from the west direction, going counter clock wise). Over-plotted with dashed lines are the modeled ring radius, width and intensity profile. For the three solid line plots (data), the profiles have been smoothed by a 5 points (number of angle points being 36) boxcar in order to smooth high frequencies variations. The error bars indicate the formal 1 σ error. Also shown is the best fit model image (bottom right) with overlaid the rotation axis (link to the disc inclination) and the major axis of the intrinsic ellipse described in section 3.
produce the final image. The peak signal-to-noise ratio in the various datasets ranges from 225 to 255. The standard star α Tau was frequently monitored for further data pho-tometric calibration and for PSF measurements. Because final co-added images are strongly limited in spatial reso-lution by the seeing and above all by the 3.6m telescope diffraction-pattern (FWHM of 1.4′′ at 20.5 µm), the use
of deconvolution techniques is mandatory in order to re-cover the best spatial resolution in MIR images. We used the Multiscale Maximum Entropy Method developed by Pantin & Starck (1996) based upon wavelet analysis based on the concept of multiscale information. Shannon theo-rem prescription allows to pursue the deconvolution down to twice the pixel size, in this case down to ≈ 0.6′′, and
iterations are stopped according to the residual map (i.e. the data minus the re-convolved solution), which proper-ties should be consistent with noise characteristics. Each epoch dataset was processed (including image
deconvolu-tion) independently in order to check the consistency of the results.
3. Results and discussion
3.1. Emission structures and photometry
After deconvolution, the 20.5 µm image of AB Aurigæ shows two main structures, as can be seen in the left panel of Fig. 1. The most striking one is a narrow ring-like struc-ture slightly open (i.e. the flux is decreased by an order of magnitude) in the SW direction. It has a total flux of 2.7±0.3 Jy (taking into account deconvolution errors) and is located at an average distance of 1.8′′(260 AU,
assum-ing a distance of 144 pc) and with a typical width FWHM of 0.45 ′′(65 AU). The second structure, and brightest,
with a total flux of 48.7±5 Jy, is concentrated in the close vicinity of the star. By comparing AB Aurigæ and PSF profiles we find that the central emission is also resolved
4 E. Pantin et al.: An emission ring around AB Aurigæ
Table 1.Best fit model parameters of AB Aur. Listed are the model parameters defining the system orientation, the ring emission and central emission region.
Parameter Value ± 1σ error
system orientation†: Θ 65◦ ± 2.0◦ i -9◦ ± 1.0◦ ring parameters: e 0.13 ± 0.01 a 1.95′′ ± 0.01′′ Φ 129◦ ± 5.0◦ ∆R 0.12′′ ± 0.0034′′ H0 0.57′′ ± 0.038′′ ∆H 0.163′′ ± 0.012′′
Iring 1.98 Jy arcsec−2 ± 0.017 Jy arcsec−2
parameters central emission:
Rcenter 0.42′′ ± 0.0044′′
Icenter 38 Jy arcsec−2 ± 1.4 Jy arcsec−2
†angles are given in degrees counter clockwise with re-spect to the west direction (right direction)
with a FWHM (diameter) of 3 pixels or 0.9 ′′(130 AU),
probably due to thermally emitting dust grains in the in-ner regions of the circumstellar disk (note that the star emission (≈ 4 mJy) is negligible at that wavelength).
3.2. Interpretation: disk structure and the nature of
the emitting grain population.
The inner resolved structure, in our schematic view of the disk thermal emission, corresponds to thermal emission of hot grains at the inner parts of the disk, between 10 AU to about 65 AU from the star, where the temperature of the dust grains is such that they thermally emit efficiently at around 20 µm. We find a similar structure as reported by Chen & Jura (2003), which can be explained by thermal emission from either a disk or an envelope. We will dis-cuss and model this emission extensively in a forthcoming paper.
Here we will concentrate on the intriguing ring-like structure at about 260 AU from the star. First of all, “standard” thermal emission from “big grains” is dis-carded at such a large distance from the star, because the stellar radiation would heat them to a temperature around 100 K or less. These grains would then produce a flux in the range 30 to 60 µm inconsistent with the spectrum measured by ISO/SWS. Therefore, we must in-fer transient heating of very small (like PAH particles for instance) by UV radiation, that relax through emission of narrows bands. PAH bands were already found in the SWS spectrum of AB Aurigæ (van den Ancker et al. 2000; Bouwman et al. 2000a). Indeed, according to Schutte et al. (1993) and Draine & Li (2001), large PAH molecules (or small grains), consisting of a few thousand carbon atoms,
can efficiently emit infrared radiation with a “plateau”-like spectral shape around 20 µm producing then the observed emission of ≈ 3 Jy at 260 AU from the star; derived rela-tive band strength are also consistent with PAH emission models cited above.
The fact that the geometrical emission is arranged in a ring puts strong constraints on the disk geometry. In the following we call apparent or projected ellipse the ellipse directly seen on the 20 µm image. The most constrain-ing feature of this rconstrain-ing-like elliptical structure is that it is off-centered along the major axis of the projected el-lipse. In principle, inclining a circular structure leads to a projected elliptical structure that can be off-centered but always along the apparent minor axis. Also the systematic brightness variation along the ring is not symmetric with respect to the minor axis of the apparent ellipse meaning that either this brightness variation is intrinsic to the ring or that the orientation of the inclination axis is not the same as the major axis of the ellipse. This leads unavoid-able to the conclusion that we are looking at an intrin-sically elliptical structure seen under a small inclination angle.
To determine the main characteristics of the ring struc-ture as seen in the CAMIRAS image of AB Aurigæ, we constructed a simple, geometrical model based on the de-convolved image. Since the inferred very small grains need stellar UV or visible photons to be excited, their emission most likely originates from the disk surface layer, i.e. the disk photosphere, being directly illuminated by the central star. To mimic this emission from the disk surface layer, we used a uniform brightness ring, with an eccentricity e, semi major axis a, and orientation Φ, radial width ∆R, scale-height H0, vertical width ∆H, and surface
bright-ness Iring. The ring model is positioned such that the
cen-tral emission is in the focus of the ellipse. The cencen-tral emission is modeled with a uniform brightness disk with radius Rcenter and surface brightness Icenter. Further, the
disk model has a overall inclination i and orientation Θ. This “infinite resolution” mode is then convolved with a σ=0.25 gaussian filter to take into account the limited resolution of the deconvolved image (0.6”). Our best-fit model (using the 2D fitting procedure MPFIT2DFUN of IDL package written by Markwardt (2002)) is shown in Fig. 2 and the resulting fit parameters are listed in ta-ble 1. We checked also that the overall inverse modeling is correct by verifying that our solution corresponds also to an minimum of χ2in raw data (non deconvolved) space. A
sketch of the derived disk structure is shown in Fig. 3. The appearance of an emission ring can be linked to the disk geometry as follows: In a flaring disk model the amount of radiation intercepted and thus emitted is proportional to the angle at which the stellar light impinges onto the disk surface. This angle is a factor of 15 (with the parameters found in the case of AB Aurigæ) larger at the ring surface compared to a uniform flaring (wedge) disk. This implies that a factor of 15 more light is intercepted and conse-quently emitted at the disk surface, lifting it above the detection limit of the CAMIRAS instrument. This large
∆
H
R
center∆
R
R
ringH
0 disk surface disk midplane?
?
observer}
}
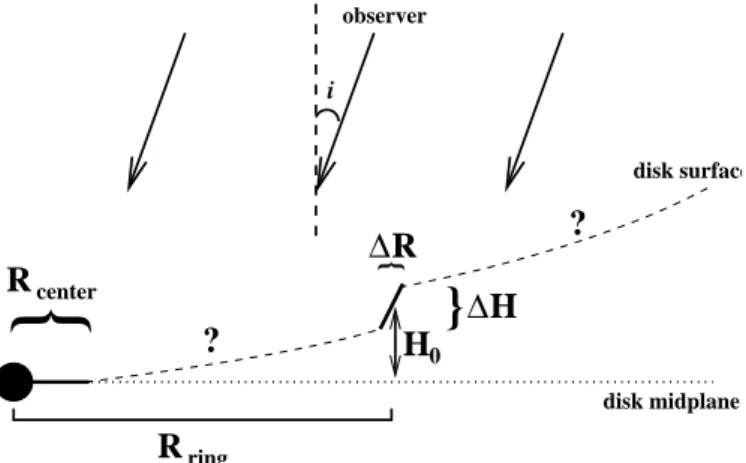
} iFig. 3. Schematic representation of the disk structure in the AB Aur system. Drawn is the derived geometry of the disk surface. Indicated in the figure are the model parameters defining this geometry as listed in Table 1. Rringis the distance to the star and varies between a(1−e)
and a(1 + e).
flaring angle of the disk surface can also explain the gap in the SW direction, as the disk surface becomes self shad-owed seen under a small inclination of −20◦. This kind of
“puffed-up” structure could be for instance the result of shadowing instabilities as described in paper by Dominik et al. (2003b). Other possibilities to explain a sudden in-crease of brightness at a distance of 260 AU, would be:
– dust sizes segregation (Takeuchi & Lin 2002) but one must infer a very peculiar structure of the gaseous disk to reproduce the observations.
– PAH photo-dissociation, but it is unlikely to occur to the inferred large PAH grains (e.g. Allain et al. (1996)). – an hollow spherical shell and its limb brightening, but
the off-centering can be hardly explained.
Remains to explain the origin of the intrinsic eccentric-ity of the ring-like structure assumed in the model de-scribed above. Some massive perturber on an eccentric orbit might produce the detected gravitational deforma-tions of the ring. A giant planet is relatively unlikely to be found one at such a high distance; a not yet detected brown dwarf could be one possible explanation.
4. Conclusions
We have presented in this paper a thermal infrared im-age at 20.5 µm of the AB Aurigæ dusty disk. The decon-volved image shows an inner resolved structure contain-ing the majority (95 %) of the thermal flux at this wave-length and an unexpected ring-like ellipse-shaped struc-ture. This ring is located at an average distance of 260 AU from the star, but its most interesting features lie in large scale asymmetries and a center that is offset with respect to the star. When modeling the ring structure using a purely geometrical model (in which asymmetries are essentially produced by inclination and shadowing ef-fects in a flared disk), we end with the conclusion that we
are in presence of an intrinsically ellipse-shaped ring that could trace the presence of puffed-up matter from a flared dust diskcontaining transiently heated particles. Self-shadowing instabilities perturbating the disk vertical thickness could produce such a ring. However, the origin of its intrinsic eccentricity remains unclear; massive bod-ies could be acting in gravitationally structuring the disk. Further detailed modelings still need to be investigated to fully understand the physics of this intriguing structure; further observations, including higher resolution imaging in several PAH bands and spatially resolved mid-IR spec-troscopy, are needed to better understand this object.
Acknowledgements. We are gratefully indebted to P. Masse, R.Jouan and M.Lortholary for their efficient assistance with the CAMIRAS instrument, A. Claret in efficiently sup-porting us in our observations, as well as to the staff of CFHT/Hawaii for their support during the observing runs. JB acknowledges financial support by the EC-RTN on “The Formation and Evolution of Young Stellar Clusters” (RTN-1999-00436, HPRN-CT-2000-00155) The observations prepa-ration was done using the SIMBAD database.
References
Allain, T., Leach, S., & Sedlmayr, E. 1996, A&A, 305, 602 Bouwman, J., de Koter, A., van den Ancker, M., & Waters, L.
2000a, A&A, 360, 213
Bouwman, J., de Koter, A., van den Ancker, M., & Waters, L. 2000b, in ASP Conf. Ser. 196: Thermal Emission Spectroscopy and Analysis of Dust, Disks, and Regoliths, 63–70
Bouwman, J., Meeus, G., de Koter, A., et al. 2001, A&A, 375, 950
Chen, C. H. & Jura, M. 2003, ApJ
Dominik, C., Dullemond, C. P., Waters, L. B. F. M., & Walch, S. 2003a, A&A, 398, 607
Dominik, C., Dullemond, C. P., Waters, L. B. F. M., & Walch, S. 2003b, A&A, 398, 607
Draine, B. T. & Li, A. 2001, ApJ, 551, 807
Dullemond, C. P., Dominik, C., & Natta, A. 2001, ApJ, 560, 957
Eisner, J. A., lane, B. F., Akeson, R. L., Hillenbrand, L. A., & Sargent, A. I. 2003, ApJ, 588, 360
Grady, C. A., Woodgate, B., Bruhweiler, F. C., et al. 1999, ApJ, 523, L151
Herbig, G. H. 1960, ApJS, 4, 337
Lagage, P. O., Jouan, R., Masse, P., Mestreau, P., & Tarrius, A. 1992, in Progress in Telescope and Instrumentation Technologies, 601–+
Mannings, V. & Sargent, A. I. 1997, ApJ, 490, 792
Markwardt, C. 2002, Markwardt IDL Programs,
http://cow.physics.wisc.edu/~craigm
Meeus, G., Waters, L., Bouwman, J., et al. 2001, A&A, 365, 476
Millan-Gabet, R., Schloerb, F. P., & Traub, W. A. 2001, ApJ, 546, 358
Millan-Gabet, R., Schloerb, F. P., Traub, W. A., et al. 1999, ApJ, 513, L131
Pantin, E. & Starck, J.-L. 1996, A&AS, 118, 575
Schutte, W. A., Tielens, A. G. G. M., & Allamandola, L. J. 1993, ApJ, 415, 397
6 E. Pantin et al.: An emission ring around AB Aurigæ Takeuchi, T. & Lin, D. N. C. 2002, ApJ, 581, 1344
Thi, W. F., van Dishoeck, E. F., Blake, G. A., et al. 2001, ApJ, 561, 1074
van den Ancker, M., Bouwman, J., Wesselius, P., et al. 2000, A&A, 357, 325
van den Ancker, M. E., The, P. S., Tjin A Djie, H. R. E., et al. 1997, A&A, 324, L33