Publisher’s version / Version de l'éditeur:
Vous avez des questions? Nous pouvons vous aider. Pour communiquer directement avec un auteur, consultez la
première page de la revue dans laquelle son article a été publié afin de trouver ses coordonnées. Si vous n’arrivez pas à les repérer, communiquez avec nous à PublicationsArchive-ArchivesPublications@nrc-cnrc.gc.ca.
Questions? Contact the NRC Publications Archive team at
PublicationsArchive-ArchivesPublications@nrc-cnrc.gc.ca. If you wish to email the authors directly, please see the first page of the publication for their contact information.
https://publications-cnrc.canada.ca/fra/droits
L’accès à ce site Web et l’utilisation de son contenu sont assujettis aux conditions présentées dans le site LISEZ CES CONDITIONS ATTENTIVEMENT AVANT D’UTILISER CE SITE WEB.
Analytical and Bioanalytical Chemistry, 412, 24, pp. 6257-6263, 2019-12-16
READ THESE TERMS AND CONDITIONS CAREFULLY BEFORE USING THIS WEBSITE. https://nrc-publications.canada.ca/eng/copyright
NRC Publications Archive Record / Notice des Archives des publications du CNRC :
https://nrc-publications.canada.ca/eng/view/object/?id=43b6160b-bf5b-4e63-a475-518494d0dee9 https://publications-cnrc.canada.ca/fra/voir/objet/?id=43b6160b-bf5b-4e63-a475-518494d0dee9
NRC Publications Archive
Archives des publications du CNRC
This publication could be one of several versions: author’s original, accepted manuscript or the publisher’s version. / La version de cette publication peut être l’une des suivantes : la version prépublication de l’auteur, la version acceptée du manuscrit ou la version de l’éditeur.
For the publisher’s version, please access the DOI link below./ Pour consulter la version de l’éditeur, utilisez le lien DOI ci-dessous.
https://doi.org/10.1007/s00216-019-02271-6
Access and use of this website and the material on it are subject to the Terms and Conditions set forth at
Determination of the isotopic composition of lutetium using MC-ICPMS He, Juan; Meija, Juris; Hou, Xiandeng; Zheng, Chengbin; Mester, Zoltán; Yang, Lu
Determination of the Isotopic Composition of Lutetium Using MC-ICPMS
Juan He1,2, Juris Meija1, Xiandeng Hou2, Chengbin Zheng2, 3, Zoltan Mester1 and Lu Yang1*
1 National Research Council Canada, 1200 Montreal Rd, Ottawa, Ontario, K1A 0R6, Canada.
2 Analytical & Testing Center, Sichuan University, 29 Wangjiang Rd, Chengdu, Sichuan 610064, China.
3 Key Laboratory of Green Chemistry and Technology of MOE College of Chemistry, Sichuan University, Chengdu, Sichuan 610064, China.
Abstract:
Despite the widespread applications of lutetium isotopes in geoscience and medical science, and the advances in multi-collector inductively coupled plasma mass spectrometry (MC-ICPMS), lutetium still lacks calibrated and SI traceable measurements of its isotope ratio and, in turn, isotopic abundances and atomic weight. In this study,we report the first independent
measurements of lutetium isotope ratio in four commercial lutetium materials, including a new NRC candidate lutetium isotopic reference material, LUIS-1. The state-of-the-art optimized regression model was used to correct for the instrumental isotopic fractionation/mass bias with NIST SRM 989 isotopic rhenium as a primary calibrator. The optimized regression model is based on a short (~15 min.) measurement session by measuring at increments of RF power. Isotope ratio of R176/175=0.026 554(13)k=1, which corresponds to isotopic abundances x176= 0.025 867(12)k=1, x175= 0.974 133(12)k=1 and an atomic weight of Ar(Lu) = 174.966 693(13)k=1 was obtained in LUIS-1.
Keyword: MC-ICPMS, isotope ratio, isotopic fractionation/mass bias, optimized regression model, isotope abundance, atomic weight.
1. Introduction
Lutetium is the last member of the lanthanide series and has two naturally occurring stable isotopes of 175Lu and 176Lu (a radiogenic isotope), with relative abundances of 97.41% and 2.59%, respectively [1]. The β de a of 176Lu to 176Hf (a half-life of about ∼37 billion years) makes the 176Lu–176Hf radiogenic isotopic system as a versatile chronometer[2] in the study of crust-mantle differentiation, providing important chronological information in rocks and minerals[3] and for the age dating and tracing of geological processes [4]. The isotopic
composition of Lu in meteorites and rocks is an implication for the decay constant of 176Lu [5]. In addition, the lutetium–hafnium (Lu-Hf) isotopic record has played key roles in the processes of partial melting [6], melt segregation and assimilation,and thus has the potential to offer fundamental insights into crustal evolution [7].
The lutetium isotopes also show important clinical applications, in 1960 Anderson et al. reported the first clinical use of 177Lu for the treatment of myelomatosis [8]. Since then, the application of Lu isotopes in radiopharmaceutical therapy has demonstrated spectacular growth in the recent years [9]. A wide variety of therapeutic radiopharmaceuticals,
phosphonate ligands, steroids, antibodies, particulates, peptides, and other small molecules have been radiolabeled with 177Lu for the treatment of cancer [10-13], neuroendocrine tumors [14], bone pain palliation [15] and even photodynamic therapy [16, 17]. Furthermore, research in Lu-based materials has grown significantly in recent years due to its superior properties. For example, bestowed to its high thermal conductivity and high density, Lu2O3 has particularly
promising applications in high-power lasers and in scintillators [18]. Lutetium-based trimetallic nitride endohedral metallofullerene has been used as a new contrast agent [19]. As the first chiral rare earth metal amidinate complex, lutetium benzamidinate complex is a suitable enantioselective catalyst for the hydroamination reactions [20]. Optical fibre sensor [21] and
ater‐solu le photose sitizer [22] were also proposed based on lutetium.
As a result of these wide variety of applications based on lutetium isotopes, the demand has increased dramatically for the high precision and accuracy determination of isotope
composition of lutetium. Thermal ionization mass spectrometry (TIMS) has been traditionally used for this purpose. Recent years have witnessed a major growth in the applications of multi-collector inductively coupled plasma mass spectrometry (MC-ICPMS) for the high precision determination of isotope ratios, because of its simple sample introduction, high ionization efficiency and high sensitivity. However, MC-ICPMS exhibits larger (10-fold) mass bias as compared to TIMS, which needs to be properly corrected for the accurate isotope ratio measurements. Various mass bias correction models, such as the linear, power-law [23], exponential [24], standard-sample bracketing (SSB), and combined SSB with internal standard models [25] have been employed. Majority geological applications in previous works were based on use of other elements such as W [26, 27], Yb [23] or Er [24] to correct the mass bias using the exponential law with the assumption of identical mass bias for the analyte and the reference isotope ratios. However, this assumption of identical mass bias for the analyte and the reference isotope ratios has been realized to be wrong, after all the mass bias for the Li is not the same for U [28], which in turn would produce biased results for the absolute isotope ratio measurements by MC-ICPMS.
Currently, lutetium still lacks calibrated and SI traceable measurements of its isotope ratio and, in turn, isotopic abundances and atomic weight. The most recent IUPAC value [29] is still based on measurements [30] by TIMS back in 2006 by using Yb for mass bias correction with the assumption of identical mass bias for the Yb and Lu ratios, which has proven to be incorrect [28]. In this vein, the aim of this study was to provide the first calibrated isotopic composition of lutetium by MC-ICPMS using the state-of-the-art optimized regression mass bias correction model and NIST SRM 989 isotopic rhenium as a primary calibrator, without assuming the identical mass bias for the Lu and Re. In turn, a new certified reference material LUIS-1 for Lu isotopic composition is produced which can be used not only as a mass bias correction primary standard, but also as a delta zero standard for lutetium isotope ratio measurements in
geological, environmental and medical sciences. 2. Experimental section
2.1. Instrumentation
The Thermo Fisher Scientific Neptune Plus (Bremen, Germany) MC-ICPMS equipped with nine Faraday cups, a quartz dual cyclonic spray chamber with a PFA self-aspirating nebulizer
(Elemental Scientific, Omaha, NE, USA) operated at 50 µL min-1, was used for all lutetium isotope ratio measurements in the low-resolution mode. The plug-in quartz torch with quartz injector was fitted with a platinum guard electrode. The instrument was tuned for the highest sensitivity, maintaining flat-top square peaks and stable signals. The gain calibration of the Faraday cups was then performed to ensure normalization of their efficiencies. Typical operating conditions are summarized in Table 1.
Table 1. MC-ICPMS operation condition Instrument settings
Radio-frequency power, P 1220 to 1268 W Plasma gas flow rate 16.0 L min-1 Auxiliary gas flow rate 1.00 L min-1
Carrier gas flow rate 1.015-1.025 L min-1 Sampler cone depth (H, Ni) 1.1 mm
Skimmer cone depth (Ni) 0.8 mm
Lens settings Optimized for maximum and stable analyte signal intensity while maintaining a flat top peak Data acquisition parameters
Faraday cup configuration L4 (174Yb), L3 (175Lu), L2 (176Lu), C (179Hf), H2 (185Re), H3 (187Re), H4 (189Os)
Mass resolution, m/Δ (at 5% and 95% peak height)
300 Signal integration time 2.097 s Numbers of integrations, cycles, and
blocks
1,8,7
2.2. Reagents and solutions
High-purity nitric and hydrochloric acids (Fisher Scientific, Ottawa, ON, Canada) were purified prior to use by a sub-boiling distillation system (Milestone Inc., Shelton, CT, USA) of reagent grade feedstocks. High purity (18.5 MΩ deio ized ater as o tai ed fro a Milli-Q ion exchange system (Sigma Aldrich, Oakville, ON, Canada). All labwares, including Savillex® containers and disposable plastic bottles, was cleaned in 5% HNO3 solution and rinsed with deionized H2O prior to use. All acids and standards were prepared under class-100 clean laboratory conditions.
Four lutetium materials were purchased from different commercial vendors. One lutetium standard solution SRM 3130a (Lu-1) at 9979 mg kg–1 in 1.6 M HNO3 prepared from lutetium oxide was sourced from National Institute of Standards & Technology (NIST, Gaithersburg, MD, USA). The second Lu standard solution (Lu-2) at 1004 mg L–1 in 4 % HNO3 was purchased from SCP Science (Baie-D'Urfé, QC, Canada), prepared from Lu2O3. The third Lu standard solution (Lu-3), ISOSPEC Lu at 999 mg L–1 in 2 % HNO3 was obtained from Delta Scientific (Ottawa, ON,
Canada), prepared from Lu2O3. A fourth Alfa Aesar Lu standard solution at 10000 mg L–1 in 5% HNO3 was sourced from Sigma Aldrich (Oakville, ON, Canada), prepared from Lu2O3. This solution was diluted 10-fold in 2 % HNO3 and then bottled in 2 mL glass ampules as NRC candidate lutetium isotopic standard, LUIS-1.
The calibrator of NIST SRM 989 Re with certified value of rhenium isotope ratio, R187/185 = N(187Re)/N(185Re) = 1.67398(53)
k=1, was prepared by dissolution of an appropriate amount of the material in aqua regia (mixture of HCl and HNO3 in a volume ratio of approximately 3:1) at room temperature and diluted with DIW to yield mass fraction w(Re) = 256 mg kg-1.
2.3. Sample preparation and analysis
Replicate test solutions with w(Lu) = 0.75 mg kg-1 were prepared by diluting the stock solution in 2% HNO3 followed by spiking with the stock solution of rhenium isotopic standard yielding a mass fraction of 1mg kg-1 for Re. A self-aspiration mode was used for the sample introduction at a flo rate of 5 μL i -1. Isotopes 174Yb, 175Lu, 176Lu, 179Hf, 185Re, 187Re and 189Os were
measured using the Faraday cup configuration (see Table 1). Similar to our previous studies [31-33], the instrument plasma radio frequency (RF) power was increased from the optimum value P0 (which corresponds to the highest sensitivity and stable signal, typically at 1220 W) to Pmax wherein the lutetium isotope signal decreased by approximately 25 %, compared to the initial value at P0. The purpose for incrementally increasing the RF power during a measurement session is to induce a shift in the mass bias in a shorter measurement time (10–30 min per session). In comparison, normal mass bias drift at the optimum P0 RF power requires 6–15 h to observe similar drift [28]. The isotopic composition of all samples was determined by
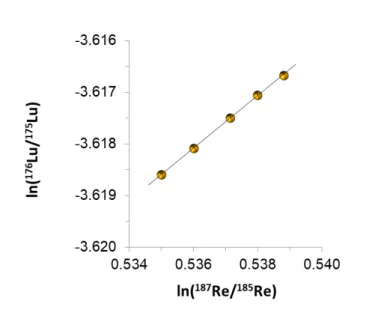
incrementally increasing RF power with values of P = (Pmax– P0 ∙N/4 where N = 0, 1, 2, 3 and 4 for a measurement session which forms a linear regression data set (Figure 1). Each session of measurement takes about 15 min. Signals of all measured isotopes obtained from a blank solution of 2% HNO3 at the optimum RF power, P0, were subtracted from those of all samples measured at P0 to Pmax. A static run was employed for simultaneous collection of all isotope signals using the conditions as shown in Table 1. Each measurement session yields five pairs of isotope ratios of Lu and Re. The quality of each set of data was monitored via the determination coefficients (R2) for the regressions of ln(r
176/175) against ln(r187/185)with R2> 0.999. All data sets
reported in this study were collected between November 2018 and February 2019. 2.3. Spectral interferences
Potential spectral interferences from 160Dy16O+, 158Dy16O1H+
, 159Dy16O+, 176Hf+, 176Yb+, on Lu isotopes and interferences of 171Yb16O+, 170Yb16O1H+, and 187Os+ on Re isotopes, could occur in samples containing these elements which would degrade the accuracy of the lutetium isotope ratio and require elimination or correction. Quantitative analysis of sample solutions
containing 5 mg kg-1 lutetium and rhenium revealed that the mass fractions of Dy, Hf and Os were less than 50 ng kg-1, while Yb was present at level of 1 µg kg-1. The concentrations of Dy, Hf and Os are insignificant to form isobaric interferences since the mass fractions of lutetium
and rhenium in the analyzed samples were several orders of magnitude higher. Although the concentration of Yb was somewhat higher, it only produced 0.00027 mV for 174Yb in the 0.75 mg kg–1 Lu and 1.0 mg kg–1 Re test solutions, as compared to intensities of 33.6, 0.90, 15.1 and 25.7 V for 175Lu, 176Lu, 185Re and 187Re, respectively. Such interference on 176Lu isotope was observed to be insignificant (see details in the following Results and Discussion section); nevertheless, this isobaric interference of 176Yb on 176Lu was corrected by subtracting its contribution based on the following equation:
�Lu1 = �1 − �
Yb1 /1 4∙ �Yb1 4 (1)
where �Lu1 is net intensity for 176Lu, �
Yb1 /1 4is the measured ratio in a 1 mg kg–1 Yb standard solution and �Yb1 4is the intensity for 174Yb.
3. Results and discussion
3.1. Correction for instrumental fractionation (mass bias)
Calibration of isotope ratios are typically performed with the use of gravimetric mixtures of near-pure isotopes [28, 34].This primary measurement method requires separated isotopes in weighable quantities which are not always feasible. For the precise and accurate determination of Lu isotope ratio, the cost-effective alternative optimized regression model was employed with use of NIST SRM 989 rhenium isotopic standard as the calibrator. This regression mass bias correction model is based on the observed correlated temporal drift in isotope ratios of two elements occurring in MC-ICPMS using the following equation:
ln �1��⁄1 = + ln �1��⁄1 (2)
where coefficients aand bare the intercept and slope of the corresponding linear regression, which is obtained using the least squares fitting of data, ln(�1��⁄1 ) vs ln(�1��⁄1 ). Eq. 2 is derived from �1�� ⁄1 = �1��⁄1 · �1��⁄1 and �1�� ⁄1 = �1 /1�� · �1 /1�� , where K is the isotope ratio correction factor that links the measured isotope ratio (r) with the mass bias corrected isotope ratio (R). The corrected isotope ratio can be obtained [31-33, 35]:
�1�� ⁄1 = � · �1�� ⁄1 (3)
Note that this optimized regression calibration model is not derived from either the exponential or the Russell’s isotope fractionation law as it was perceived and originally presented [36]. As detailed elsewhere [28], the regression model effectively calibrates the lutetium isotope ratio from the known isotope ratio of rhenium without assuming that lutetium and rhenium must have identical mass bias (they do not). Both the analyte and the calibrator are measured simultaneously in a same solution, thus eliminating any effect of the sample matrix and alleviating the need in matching the mass fractions of the analyte and calibrant [31]. This optimized regression model has been validated in two ways. First, the use of two independent calibrators (Re and Tl) for iridium isotope ratio measurements [31] produces results identical to
within few parts in 104. Second, the regression model has been compared with the full gravimetric isotope mixture method (a primary calibration method) in molybdenum isotope ratio measurements [37] and lead isotope ratio measurements [33], both showing excellent agreement between the results to within few parts in 104. This state-of-the-art optimized regression model has since been applied on a few cases to achieve accurate and precise isotope ratio measurements for Mo, Ir, Os, Pb and Hf [31-33, 37, 38].
Taking advantage of these features, in this study we tested the reliability of this optimized regression model using the primary isotopic calibrator, NIST SRM 989 rhenium, for the characterization of lutetium isotopic composition. As evident from Figure 1, the measured
�1��⁄1 and �1��⁄1 isotope ratios show a well-defined log-linear relationship in accordance with Eq 2.
Figure 1. Temporal drift of the lutetium and rhenium isotope ratios. The log-linear regression plot is the basis for
calibration of the lutetium isotope ratio via the certified reference value of �1�� ⁄1 in NIST SRM 989. 3.2. Uncertainty evaluation
Uncertainty estimation for the calibrated lutetium isotope ratio was done in accordance with the JCGM : 8 Guide to the E pressio of U ertai t i Measure e t [39] and its Supplement 1 [40]. In brief, lutetium isotope ratio for each regression set was calculated using an ordinary least-squares fit, and the corresponding intercept and slope and their uncertainties were obtained. From these values, the lutetium isotope ratio was calculated using Eq 3. The values for the three input variables in the measurement model (Eq 3; �1�� ⁄1 , a, and b) were modelled as random numbers drawn from the probability distributions representing the available knowledge about them. In particular, �1�� ⁄1 was modelled as normal distribution with the mean �1�� ⁄1 and the reported standard uncertainty u(�1�� ⁄1 ) whereas a and b for each measurement set are modelled jointly as a bivariate normal distribution with the mean estimates and covariance matrix deriving from the least-squares fitting of the data. This
procedure was repeated 5000 times, and the best estimate of the calibrated lutetium isotope ratio and its uncertainty were obtained from the resulting histograms.
3.3. Isotopic abundances and atomic weight of lutetium
Atomic weight and isotopic abundances of lutetium were calculated from the isotope ratio. The uncertainty of isotopic abundances and the atomic weight of lutetium were propagated from the corresponding isotope ratio uncertainty, while covariances were taken into account [40]. Uncertainty propagation of the isotope ratios into the corresponding isotopic abundances and atomic weight were done using the R package CIAAW consensus [41]. The atomic masses of lutetium isotopes (m175 and m176) used for calculations in this report are from the 2017 Atomic Mass Evaluation [42], where m175 = 174.940 7773(13)k=1 Da and m176 =175.942 6918(13)k=1 Da with standard uncertainties quoted in parentheses.
3.4. Measurement results
During the preliminary studies, Lu and Re isotope ratios in LUIS-1 solution were measured without the correction of isobaric interferences of 176Yb and 176Hf, since LUIS-1 was prepared from high purity standard. 86 sets of lutetium-rhenium regressions were collected, and a value of R176/175=0.026 553(7)k=1 in the LUIS-1 lutetium standard was obtained. However, as
mentioned earlier, small amount Yb was present in the sample and the contribution of 176Yb was thus corrected in the final measurements as described in Section 2.3 Spectral
interferences. As for the final lutetium isotope ratio measurements, replicate solutions containing 0.75 mg kg-1 of lutetium and 1.0 mg kg–1 of rhenium were prepared and each was measured under the optimized experimental conditions during a four-month period from November 2018 to February 2019 with five different sets of ICP cones used. A total of 160 sets of lutetium-rhenium regressions were obtained with the correction of small ytterbium
interference (in all cases, the coefficient of determination R2 > 0.999) in LUIS-1 Lu standard, as shown in Figure 2. A value of R176/175=0.026 554(13)k=1 in the LUIS-1 was obtained, in excellent agreement with the value of R176/175=0.026 553(7)k=1 obtained without 176Yb correction, confirming 176Yb interference was insignificant. The corresponding abundances and atomic weight were derived from the calibrated R176/175 In LUIS-1, as shown in Table 2.
Table 2. Isotopic composition of lutetium in the NRC LUIS-1 standard Atomic mass number, i Isotope ratio, Ri/175 Isotopic abundance, x(i Lu) 175 1(exact) 0.974 133(12) 176 0.026 554(13) 0.025 867(12) Atomic weight Ar(Lu) = 174.966 693(13)
Values are presented in a concise notation whereby the combined standard uncertainty is given in parenthesis. For example, R176/175 = 0.026 554(13) represents a mean value of R176/175 = 0.026 554 with standard uncertainty u(R176/175) = 0.000 013.
Figure 2. Calibrated lutetium isotope ratio measurement results for LUIS-1. The vertical error bar represents the
combined standard uncertainty.
3.5. Effect of the sample provenance
In addition to the Alfa Aser lutetium (LUIS-1), relative isotope ratios (isotope deltas) of three other sources of lutetium standards were measured against the LUIS-1 standard using the combined standard-sample bracketing and rhenium internal standard approach as detailed elsewhere [28]. The results, summarized in Table 3, show small variation in δ 176/175Lu)
LUIS-1 = 0.017 ‰ to + . 32 ‰ relati e to the LUI“-1.
Table 3. Relative isotope ratios (isotope deltas) of lutetium in several commercial materials against the NRC LUIS-1, δLUIs-1(176/175Lu).a
Lutetium sample (X) Isotope delta, δLUIS, X(176/175Lu), ‰
LUIS-1 0 (exact)
NIST Lu 0.017(15)
ISOSPEC Lu 0.032(13)
SCP Lu 0.027(16)
a. Values are presented in a concise notation whereby the repeatability standard deviation (N = 10) is given in parenthesis next to the least significant digits to which it applies.
This isotope ratio variation from these four materials is incorporated in the best estimate of the Lu isotope ratio to obtain the average value for Lu isotope ratio as follows:
�1 ⁄1 = 1 + �LUIS−1,X (Lu1 /1 ) × �1 ⁄1 ,LUIS−1 (4)
where R176/175 is the a erage isotope ratio of lutetiu a ross the four aterials. For simplicity, δLUIS-1,X(176/175Lu) was modeled as a random variable distributed uniformly between –0.00005 and +0.00005. Using R176/175=0.026 554(13)k=1 in the LUIS-1, the uncertainty propagation yields identical values for isotope ratio, abundances and atomic weight, presented in Table 2. The obtained average atomic weight of lutetium of Ar(Lu)=174.96669 ± 0.00003 (k=2) from these four commercial materials is in agreement with the current standard atomic weight of lutetium, Ar(Lu) = 174.9668 ± 0.0001 (k=2) recognized by the IUPAC [43], within the expanded
uncertainty. It is clear that the precision of our measurement is about 3-fold better than the current value. Since the IUPAC current value is classified as a non-calibrated measurement which was based on TIMS measurements in 2006, we suggest replacing the current non-calibrated estimate.
4. Conclusion
To the best of our knowledge, this is the first report of calibrated measurement of isotopic composition of lutetium using MC-ICPMS with the highest precision and accuracy based on the optimized regression mass bias correction model. We report lutetium isotope ratio R176/175 = 0.026 554(26)k=2 in a single commercial material of lutetium (NRC LUIS-1) with the relative uncertainty of few parts in 104. This value corresponds to an atomic weight Ar(Lu) = 174.966 69(3)k=2 and isotopic abundances of x176=0.025 867(24)k=2 and x175=0.974 133(24)k=2. Our results on four commercial lutetium reagents provide a consensus isotope ratio R176/175 = 0.026
554(26)k=2 along with the corresponding isotopic abundances of x176=0.025 867(24)k=2 and x175=0.974 133(24)k=2, and atomic weight of lutetium, Ar(Lu) = 174.96669± 0.00003 (k=2) which we suggest as a revision of the current standard atomic weight, 174.9668 ± 0.0001 (K=2).
Acknowledgements
We thank Dr. Robert D. Vocke, Jr. from National Institute of Standards and Technology (Gaithersburg, MD, USA) for the courtesy of NIST SRM 989 isotopic standard of rhenium. The National Natural Science Foundation of China (grant no. 21529501) and China Scholarship Council for financial support of J. He during the study are gratefully acknowledged.
References
1. Banerjee S, Pillai M, Knapp F. Lutetium-177 therapeutic radiopharmaceuticals: linking chemistry, radiochemistry, and practical applications. Chem Rev. 2015;115(8):2934-2974.
2. Iizuka T, Yamaguchi T, Hibiya Y, Amelin Y. Meteorite zircon constraints on the ulk Lu− Hf isotope composition and early differentiation of the Earth. Proc Natl Acad Sci. 2015;201501658.
3. Scherer E, Münker C, Mezger K. Calibration of the lutetium-hafnium clock. Science. 2001;293 (5530):683-687.
4. Duchêne S, Blichert-Toft J, Luais B, Télouk P, Lardeaux JM, Albarede F. The Lu–Hf dating of garnets and the ages of the Alpine high-pressure metamorphism. Nature. 1997;387(6633):586.
5. Komura K, Sakamoto K, Tanaka S. The half-life of long-lived 176Lu. Nucl Phys A. 1972;198(1):73-80. 6. Gardiner NJ, Johnson TE, Kirkland CL, Smithies RH. Melting controls on the lutetium–hafnium
evolution of Archaean crust. Precambrian Res. 2018;305:479-488.
7. Vervoort JD, Patchett PJ, Söderlund U, Baker M. Isotopic composition of Yb and the determination of Lu concentrations and Lu/Hf ratios by isotope dilution using MC-ICPMS. Geochem Geophy Geosy. 2004;5(11).
8. Anderson J, Farmer F, Haggith J, Hill M. The Treatment of Myelomatosis with Lutecium 177. Br J Radiol. 1960;33(390):374-378.
9. Basu S. Clinical applications of lutetium based radiopharmaceuticals in molecular targeted therapy of cancer. In: Proceedings of the fourteenth DAE-BRNS biennial Trombay symposium on radiation and photochemistry. 2018.
10. Meredith RF, Partridge EE, Alvarez RD, Khazaeli M. Intraperitoneal radioimmunotherapy of ovarian cancer with lutetium-177-CC49. J Nucl Med. 1996;37(9):1491.
11. Delker A, Fendler WP, Kratochwil C, Brunegraf A, Gosewisch A, Gildehaus FJ, Tritschler S, Stief CG, Kopka K, Haberkorn U. Dosimetry for 177 Lu-DKFZ-PSMA-617: a new radiopharmaceutical for the treatment of metastatic prostate cancer. Eur J Nucl Med Mol Imaging. 2016;43(1):42-51.
12. Baum RP, Kulkarni HR, Schuchardt C, Singh A, Wirtz M, Wiessalla S, Schottelius M, Mueller D, Klette I, Wester HJ. Lutetium-177 PSMA radioligand therapy of metastatic castration-resistant prostate cancer: safety and efficacy. J Nucl Med. 2016;115:168443.
13. Kratochwil C, Giesel FL, Eder M, Afshar-Oro ieh A, Be ešo á M, Mier W, Kopka K, Ha erkor U. [177 Lu] Lutetium-labelled PSMA ligand-induced remission in a patient with metastatic prostate cancer. Eur J Nucl Med Mol Imaging. 2015;42(6):987-988.
14. Kam BLR, Teunissen JJM, Krenning EP, de Herder WW, Khan S, van Vliet EI, Kwekkeboom DJ. Lutetium-labelled peptides for therapy of neuroendocrine tumours. Eur J Nucl Med Mol Imaging. 2012;39(1):103-112.
15. Solá GAR, Argüelles MG, Bottazzini DL, Furnari JC, Parada IG, Rojo A, Ruiz HV. Lutetium-177-EDTMP for bone pain palliation. Preparation, biodistribution and pre-clinical studies. Radiochim Acta. 2000;88 (3-4):157-162.
16. Hsi RA, Kapatkin A, Strandberg J, Zhu T, Vulcan T, Solonenko M, Rodriguez C, Chang J, Saunders M, Mason N, Hahn S. Photodynamic therapy in the canine prostate using motexafin lutetium. Clin Cancer Res. 2001;7(3):651-660.
17. Sessler JL, Dow WC, O'Connor D, Harriman A, Hemmi G, Mody TD, Miller RA, Qing F, Springs S, Woodburn K. Biomedical applications of lanthanide (III) texaphyrins Lutetium (III) texaphyrins as potential photodynamic therapy photosensitizers. J Alloys Compd. 1997;249(1-2):146-152.
18. An L, Ito A, Goto T. Fabrication of transparent lutetium oxide by spark plasma sintering. J Am Ceram Soc. 2011;94(3):695-698.
19. Iezzi EB, Duchamp JC, Fletcher KR, Glass TE, Dorn HC. Lutetium-based trimetallic nitride endohedral metallofullere es: new contrast agents. Nano Lett. 2002;2(11):1187-1190.
20. Benndorf P, Jenter J, Zielke L, Roesky PW. Chiral lutetium benzamidinate complexes. Chem Commun. 2011;47(9):2574-2576.
. Bariai C, Matıas I, Fernandez-Valdi ielso C, Arregui F, Rodrıguez-Méndez M, De Saja J. Optical fiber sensor based on lutetium bisphthalocyanine for the detection of gases using standard
telecommunication wavelengths. Sensors Actuat B Chem. 2003;93 (1-3):153-158.
22. Young S, Woodburn K, Wright M, Mody T, Fan Q, Sessler J, Dow W, Miller R. Lutetium texaphyrin (PCI-0123): A near-infrared, water-soluble photosensitizer. Photochem Photobiol. 1996;63(6):892-897.
23. Yuan HL, Gao S, Zong CL, Dai MN. Sectional power-law correction for the accurate determination of lutetium by isotope dilution multiple collector-inductively coupled plasma-mass spectrometry. Spectrochim Acta B. 2009;64(11-12):1228-1234.
24. Lapen TJ, Mahlen NJ, Johnson CM, Beard BL. High precision Lu and Hf isotope analyses of both spiked and unspiked samples: a new approach. Geochem Geophy Geosy. 2004;5(1).
25. Wimpenny JB, Amelin Y, Yin QZ. Precise determination of the lutetium isotopic composition in rocks and minerals using multicollector ICPMS. Anal Chem. 2013;85(23):11258-11264.
26. Wimpenny J, Amelin Y, Yin QZ. The Lu isotopic composition of achondrites: Closing the case for accelerated decay of 176Lu. Astrophys J Lett. 2015;812(1):L3.
27. Kleinhanns IC, Kreissig K, Kamber BS, Meisel T, Nägler TF, Kramers JD. Combined chemical separation of Lu, Hf, Sm, Nd, and REEs from a single rock digest: precise and accurate isotope determinations of Lu− Hf a d “ − Nd using multicollector-ICPMS. Anal Chem. 2002;74(1):67-73.
28. Yang L, Tong S, Zhou L, Hu Z, Mester Z, Meija J. A critical review on isotopic fractionation correction methods for accurate isotope amount ratio measurements by MC-ICP-MS. J Anal At Spectrom. 2018;33 (11):1849-1861.
29. Meija J, Coplen TB, Berglund M, Brand WA, De Bièvre P, Gröning M, Holden NE, Irrgeher J, Loss RD, Walczyk T. Isotopic compositions of the elements 2013 (IUPAC technical Report). Pure Appl Chem. 2016;88(3):293-306.
30. De Laeter J, Bukilic N. Solar abundance of Lu 176 and s-process nucleosynthesis. Physical Review C. 2006;3(4):045806.
31. Zhu Z, Meija J, Zheng A, Mester Z, Yang L. Determination of the isotopic composition of iridium using Multicollector-ICPMS. Anal Chem. 2017;89(17):9375-9382.
32. Zhu Z, Meija J, Tong S, Zheng A, Zhou L, Yang L. Determination of the isotopic composition of osmium using MC-ICPMS. Anal Chem. 2018;90(15):9281-9288.
33. Tong S, Meija J, Zhou L, Methven B, Mester Z, Yang L. High-precision measurements of the isotopic composition of common lead lsing MC-ICPMS: comparison of calibration strategies based on full gravimetric isotope mixture and regression models. Anal Chem. 2019;91(6):4164-4171.
34. Meija J. Calibration of isotope amount ratios by analysis of isotope mixtures. Anal Bioanal Chem. 2012;403(8):2071-2076.
35. Yang L, Meija J. Resolving the germanium atomic weight disparity using multicollector ICPMS. Anal Chem. 2010;82(10):4188-4193.
36. Maréchal CN, Télouk P, Albarède F. Precise analysis of copper and zinc isotopic compositions by plasma-source mass spectrometry. Chem Geol. 1999;156(1-4):251-273.
37. Malinovsky D, Dunn PJ, Goenaga-Infante H. Calibration of Mo isotope amount ratio measurements by MC-ICPMS using normalisation to an internal standard and improved experimental design. J Anal At Spectrom. 2016;31(10):1978-1988.
38. Tong S, Meija J, Zhou L, Mester Z, Yang L.Determination of the isotopic composition of hafnium using MC-ICPMS. Metrologia. 2019. Accepted.
39. JCGM J. Evaluation of measurement data-Guide to the expression of uncertainty in measurement. Int Organ Stand Geneva ISBN. 2008;50:134.
40. Meija J, Mester Z. Uncertainty propagation of atomic weight measurement results. Metrologia. 2008;45(1):53.
41. Meija J, Possolo A, Data reduction framework for standard atomic weights and isotopic compositions of the elements. Metrologia. 2017;54(2):229.
42. Wang M, Audi G, Kondev F, Huang W, Naimi S, Xu X. The AME2016 atomic mass evaluation (II). Tables, graphs and references. Chinese Physics C. 2017;41(3):030003.
43. Meija J, Coplen TB, Berglund M, Brand WA, De Bièvre P, Gröning M, Holden NE, Irrgeher J, Loss RD, Walczyk T. Atomic weights of the elements 2013 (IUPAC Technical Report). Pure Appl Chem. 2016;88(3):265-291.