HAL Id: hal-01068080
https://hal.archives-ouvertes.fr/hal-01068080
Preprint submitted on 24 Sep 2014
HAL is a multi-disciplinary open access archive for the deposit and dissemination of sci-entific research documents, whether they are pub-lished or not. The documents may come from teaching and research institutions in France or abroad, or from public or private research centers.
L’archive ouverte pluridisciplinaire HAL, est destinée au dépôt et à la diffusion de documents scientifiques de niveau recherche, publiés ou non, émanant des établissements d’enseignement et de recherche français ou étrangers, des laboratoires publics ou privés.
Modelling outputs from a stakeholders’ self-modeling to
catch environmental uncertainty
Jérémy Bourgoin, Patrick Daquino
To cite this version:
Jérémy Bourgoin, Patrick Daquino. Modelling outputs from a stakeholders’ self-modeling to catch environmental uncertainty: A case study in the Sahel. 2014. �hal-01068080�
Modelling outputs from a stakeholders’ self-modeling to catch environmental uncertainty
A case study in the Sahel
Jérémy Bourgoin (Cirad-Tetis), Patrick d’Aquino (Cirad-Green), Alassane Bah
(UCAD-UMISCO Abstract
A participatory modeling approach called “self-design” has been experimented in Senegal with the aim of letting farmers design their own model of the local natural resources management issues. The success of the experiment and its outputs led to a new participatory modeling approach based on the central principle of letting stakeholders design and use their own conceptual model of environmental management. This unusual endogenous design resulted in a qualitative but nevertheless worthy model of the Sahelian environmental uncertainty, which is currently enriching the debate about the value of local worldviews for environmental modeling.
Key words
Participatory modeling – uncertainty – drylands – Sahel –indigenous – local knowledge – environmental management
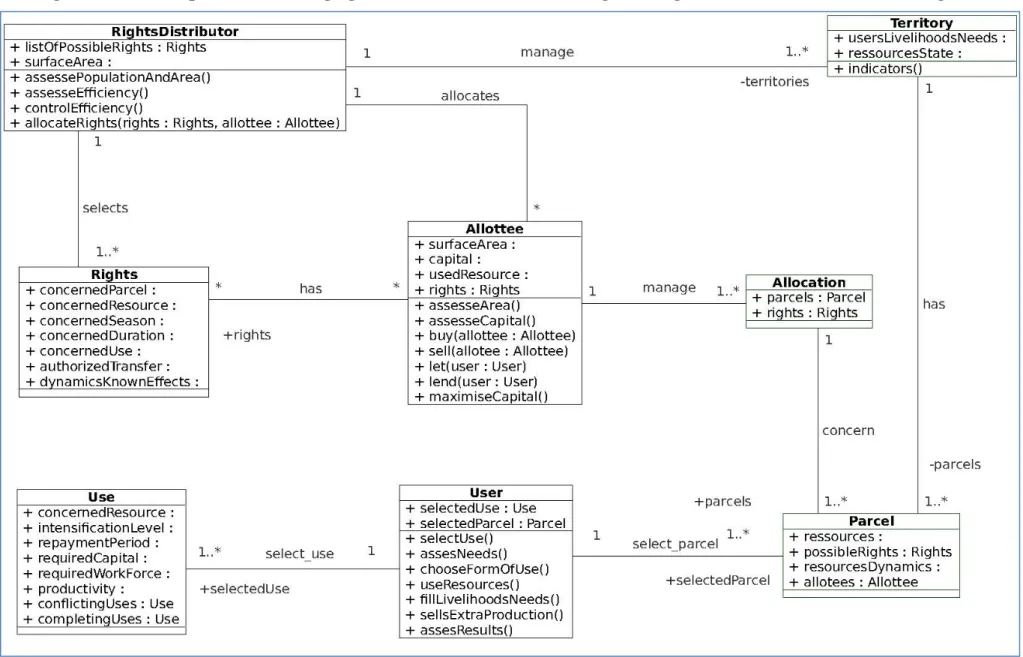
Figure 1 displays the UML class diagram that has been created by the facilitation team to transfer the RPG structure and contextual elements into the agent-based model. The simulation platform, called SelfLandPolicy, is built using the Cormas meta-model (Bousquet et al., 1998, Le Page et al., 2012). The computational model is spatially structured in three embedded spatial entities (parcel, community land base, and territory), with the specific aim of letting the participants tailor complex management options with different levels of responsibility. For the same reason, two social entities are used to represent the two types of actors of the land tenure system, users and distributors of rights. Lastly, specific agent-objects, operated by the agent-actors, are distinguished: types of use, types of rights, and seasons. The spatial interface is designed using the game map as basis. In each new simulation, ecological units can be dispatched and structured differently depending on the participants’ wishes and on the type of Sahelian region they wish to represent. Each spatial cell has four basic natural resource attributes, water, soil, grass, and trees, whose value depends on the ecological unit allocated to the cell. During the use of the role playing game and even the computerized version, other types of ecological units can be added if needed. The model designed by these stakeholders provides an interesting endogenous representation of Sahelian uncertainty. A sensitivity analysis was performed to calibrate the model and test its robustness. A single-factor analysis was run across all base parameters including environmental and demographic variables.
Running this model demonstrated the ability of the participants to integrate complex representations of uncertainty such as:
1. Peculiar effects of resources scarcity on productivity
The stakeholders’ modeling specifications led to a simple and intuitive model which is nevertheless able to highlight the specific and extreme uncertainty of Sahelian scarce environment. First, the self-designed model shows that in the uncertainty context modeled:
• Only the rare rainy years allow sufficient profit to compensate for the usual deficit in other years;
• In the worst scarcity conditions (right part of Figure 2), productivity is higher when the natural resources are exploited less intensively.
2. Highly changeable productivity depending on complex combined effects of environmental conditions and uses
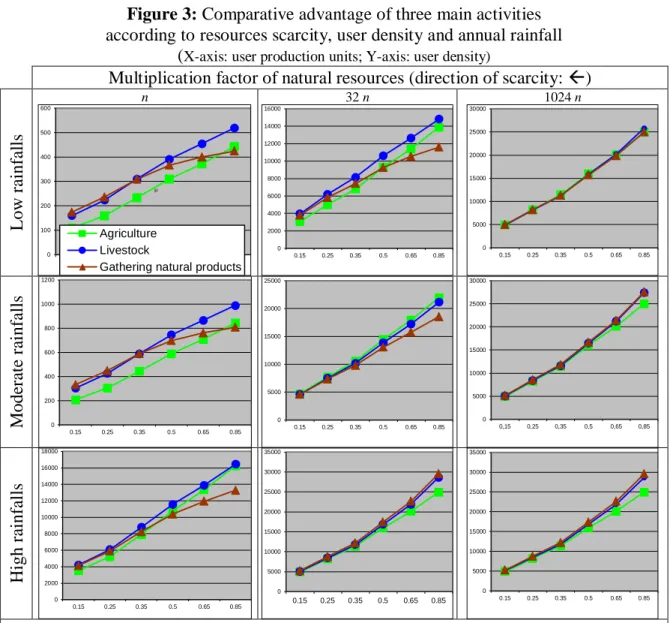
In this model, there is no “most economically efficient” activity. Each activity may turn out to be the most efficient, depending on rainfall, user density, and the scarcity of natural resources (Figure 3).
• Gathering natural products becomes less efficient than the other activities when user density increases and when resources become scarce: in Figure 3, when rainfall is low or moderate, the productivity curve of gathering flattens out as scarcity increases; on the other hand, gathering is highly efficient when there are sufficient resources and rainfall (i.e. in the far right column in figure 3).
• Pastoralism appears to be most efficient in the worst conditions.
Therefore, the uncertainty context emerging from the self-designed model proposes climate, geographical and environmental conditions in which “being most adaptable” means incorporating flexible and adaptable shifts from one activity to another.
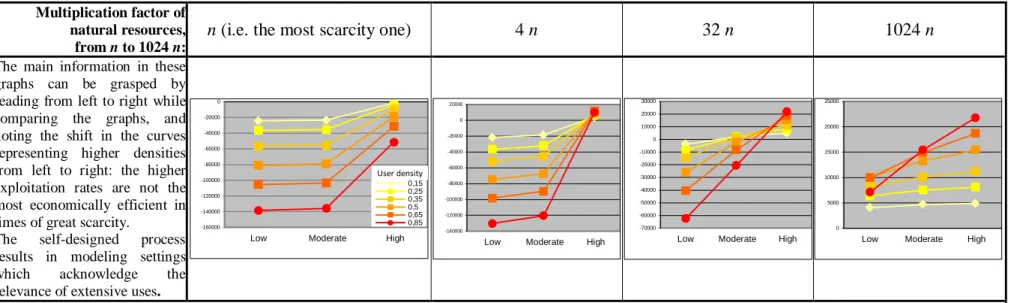
Figure 2: Effect of exploitation rate (user production unit) on productivity, according to natural resources scarcity and annual rainfall (X-axis: annual rainfall scenarios; y-axis: user production units)
Multiplication factor of natural resources,
from n to 1024 n:
n (i.e. the most scarcity one) 4 n 32 n 1024 n
The main information in these graphs can be grasped by reading from left to right while comparing the graphs, and noting the shift in the curves representing higher densities from left to right: the higher exploitation rates are not the most economically efficient in times of great scarcity.
The self-designed process
results in modeling settings
which acknowledge the
relevance of extensive uses.
N.B.: The units of productivity are qualitative and only the relative difference is relevant.
Multiplication factor of natural resources: each graph shows the results of simulations under different resources availability. From left to right, available natural resources (soil, grass, water, trees) in the model increased from 1 to 1024 (45).
On the X-axis are the three rainfall scenarios designed by stakeholders during the game and then run in the model. So « high » rainfall years were defined as having a beneficial impact on users’ yields which were 8 to 10 times higher than in a « moderate » year, while yields in a « moderate » year were around twice as high as in a “low” year: this is the Sahelian people’s perception of the effect of the annual rainfall variability on the environment and production.
On the Y-axis are the qualitative units of productivity (or user density) per spatial unit, a computerized representation of the tokens used by stakeholders in the board game.. As these productivity units are relative and qualitative data, only their relative difference is relevant not their amount.
-160000 -140000 -120000 -100000 -80000 -60000 -40000 -20000 0
Low Moderate High
0,15 0,25 0,35 0,5 0,65 0,85 User density -140000 -120000 -100000 -80000 -60000 -40000 -20000 0 20000
Low Moderate High
-70000 -60000 -50000 -40000 -30000 -20000 -10000 0 10000 20000 30000
Low Moderate High
0 5000 10000 15000 20000 25000
Figure 3: Comparative advantage of three main activities
according to resources scarcity, user density and annual rainfall
(X-axis: user production units; Y-axis: user density)
Multiplication factor of natural resources (direction of scarcity: )
L ow r ai n fal ls n 32 n 1024 n M o d er at e ra in fa lls Hi g h r ain fa lls
N.B.: The units of productivity are qualitative and only the relative difference is relevant.
The frame of the chart combines the two past features of environmental uncertainty: rainfall (in rows) and resources scarcity (in columns). Environmental conditions worsen from right to left (resources scarcity) and from the bottom to the top (rainfall scarcity). Therefore the worst conditions are in the top left panel and the best in the bottom right panel.
3. Spatial variability with complex effects on the uncertainty of productivity
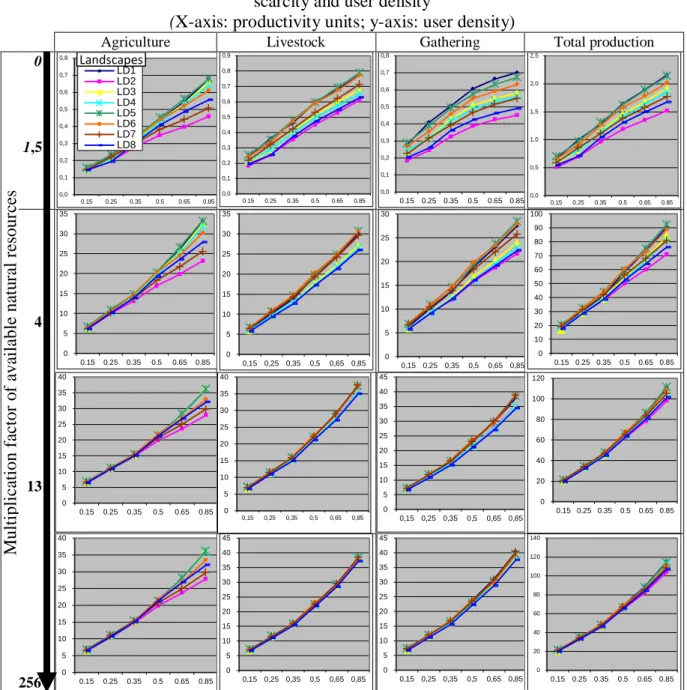
The model also brings into focus the complex impacts of spatial variability on users’ productivity (Figure 4). A summary list of the aspects the model integrates is provided below:
• The performance and productivity of each land use depends on a complex combination of contextual factors, including season, other existing activities, density of users, and annual rainfall levels.
• The difference in performance between landscapes is greater when environmental conditions deteriorate (see the top rows of the chart in Figure 4).
0 100 200 300 400 500 600 0,15 0,25 0,35 0,5 0,65 0,85 Agriculture Livestock
Gathering natural products
µ 0 2000 4000 6000 8000 10000 12000 14000 16000 0.15 0.25 0.35 0.5 0.65 0.85 0 5000 10000 15000 20000 25000 30000 0.15 0.25 0.35 0.5 0.65 0.85 0 200 400 600 800 1000 1200 0.15 0.25 0.35 0.5 0.65 0.85 0 5000 10000 15000 20000 25000 0.15 0.25 0.35 0.5 0.65 0.85 0 5000 10000 15000 20000 25000 30000 0,15 0,25 0,35 0,5 0,65 0,85 0 2000 4000 6000 8000 10000 12000 14000 16000 18000 0.15 0.25 0.35 0.5 0.65 0.85 0 5000 10000 15000 20000 25000 30000 35000 0.15 0.25 0.35 0.5 0.65 0.85 0 5000 10000 15000 20000 25000 30000 35000 0.15 0.25 0.35 0.5 0.65 0.85
Figure 4: Effects of landscape conditions on user productivity, according to environmental
scarcity and user density
(X-axis: productivity units; y-axis: user density)
Agriculture Livestock Gathering Total production
M u ltip lic atio n f act o r of av ai lab le n at u ral r es o u rces 0 1,5 4 13 256
N.B.: The units of productivity are qualitative and only the relative difference is relevant.
‘LD’ (Local Districts) stands for the different local landscapes distinguished in the spatialized setting (see figure 2). Each of these local geographical units differs in both its ratio and in the spatial distribution of its basic ecological units. In this fig, each differently coloured curve represents one of these local landscapes. The environmental scarcity decreases from top to bottom in the figure (see arrow on the left). The most advantageous local landscape varies depending on the degree of scarcity and on the activity concerned, but is the result of a complex combination which changes in each different context.
• Landscape vocation: the modeled agricultural performance of a landscape is proportional to the wetlands it contains, which is only noticeable beyond a certain user density. Conversely, in the model some landscapes are more favorable for pastoralism and gathering. But unlike the agricultural vocation, this sylvopastoral vocation is only noticeable when natural resources become sufficiently scarce. It is no longer noticeable when user density becomes too high.
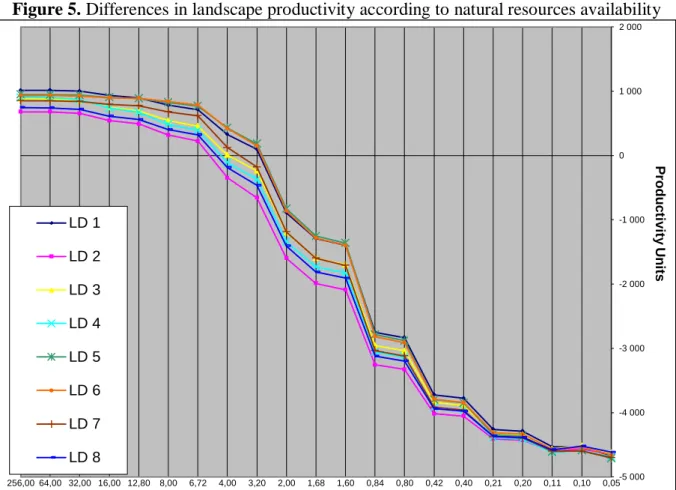
• Figure 5 adds a last facet to the complex impact of the spatial variability of productivity’s uncertainty. The outputs of the model show that when environmental conditions
0,0 0,1 0,2 0,3 0,4 0,5 0,6 0,7 0,8 0.15 0.25 0.35 0.5 0.65 0.85 LD1 LD2 LD3 LD4 LD5 LD6 LD7 LD8 Landscapes 0,0 0,1 0,2 0,3 0,4 0,5 0,6 0,7 0,8 0,9 0.15 0.25 0.35 0.5 0.65 0.85 0,0 0,1 0,2 0,3 0,4 0,5 0,6 0,7 0,8 0.15 0.25 0.35 0.5 0.65 0.850,0 0,5 1,0 1,5 2,0 2,5 0.15 0.25 0.35 0.5 0.65 0.85 0 5 10 15 20 25 30 35 0.15 0.25 0.35 0.5 0.65 0.85 0 5 10 15 20 25 30 35 0,15 0,25 0,35 0,5 0,65 0,85 0 5 10 15 20 25 30 0,15 0,25 0,35 0,5 0,65 0,85 0 10 20 30 40 50 60 70 80 90 100 0.15 0.25 0.35 0.5 0.65 0.85 0 5 10 15 20 25 30 35 40 0.15 0.25 0.35 0.5 0.65 0.85 0 5 10 15 20 25 30 35 40 0,15 0,25 0,35 0,5 0,65 0,85 0 5 10 15 20 25 30 35 40 45 0,15 0,25 0,35 0,5 0,65 0,85 0 20 40 60 80 100 120 0.15 0.25 0.35 0.5 0.65 0.85 0 5 10 15 20 25 30 35 40 0.15 0.25 0.35 0.5 0.65 0.85 0 5 10 15 20 25 30 35 40 45 0,15 0,25 0,35 0,5 0,65 0,85 0 5 10 15 20 25 30 35 40 45 0,15 0,25 0,35 0,5 0,65 0,85 0 20 40 60 80 100 120 140 0.15 0.25 0.35 0.5 0.65 0.85
deteriorate, the productivity of some landscapes decreases faster than others, hence increasing the diversity of the impact of spatial variability on productivity. Moreover, this sensitivity has complex features, as the productivity of some of the most sensitive landscapes decreases only when resources decrease, whereas in others, productivity only decreases with an increase in user density. In addition, we can note that some landscapes show particular sensitivity only at the highest densities.
Figure 5. Differences in landscape productivity according to natural resources availability
N.B.: The units of productivity are qualitative and only the relative difference is relevant.
Reading from the left to right, one can see that some curves decrease more abruptly than others (in particular between 2.0 and 1.6 on the x axis). This means some landscapes are more sensitive to a drop in available resources. Thus, landscapes LD2 and LD8 are sensitive the soonest, with a first drop in productivity as early as at a factor of 32, and so on. Some curves even present two thresholds of sensitivity. For example LD3 first shows a slight drop at 12.8 then another at 3.2. In contrast, some landscapes, like LD1, 5 and 6, show no specific sensitivity to scarcity. These phenomena add another complex variability of spatial conditions according to the environmental uncertainty.
Thus, the very qualitative but stakeholder-designed model accurately sets out the complexity of the impact of Sahelian spatial variability on the uncertainty of productivity. Far beyond simply being the result of the availability of natural resources, the uncertainty of productivity is the product of a complex combination of spatial variability, scarcity, and uses.
4. Sustainability of user production depends on some well- delimited resource hot spots
Leaving aside spatial diversity and examining the modeling outputs at a global scale, a direct relationship can be observed between the overall production and the proportion of wetlands, particularly due to the specific value of wetlands for agriculture in high rainfall years. The same kind of resource hot spot was also identified not only in space but also in time. For instance some crucial water points or particular pastures have a major impact on productivity
-5 000 -4 000 -3 000 -2 000 -1 000 0 1 000 2 000 256,00 64,00 32,00 16,00 12,80 8,00 6,72 4,00 3,20 2,00 1,68 1,60 0,84 0,80 0,42 0,40 0,21 0,20 0,11 0,10 0,05 P roduc tiv it y U ni ts LD 1 LD 2 LD 3 LD 4 LD 5 LD 6 LD 7 LD 8
if they are available at a particular season or a certain kind of annual rainfall. Again, this is a very peculiar feature of Sahelian uncertainty, where the use efficiency is based on some key resources which are strictly delimited in space and time.
As a result, since there is no direct correlation between the above mentioned variability factors, the resulting qualitative model proposes a specific and complex spatial diversity of opportunities and constraints, which vary in a complex way with the season, the combination of activities, the availability of resources, the user density, etc.. Hence, this method seems to be an interesting modeling support to test the best ways to manage deep environmental uncertainty.
References
d’Aquino P., A. Bah, 2012a. Land policies for climate change adaptation in West Africa: a multi-level Companion Modeling approach. Simulation and Gaming, 20, (10), 1-18.
d’Aquino P., A. Bah, 2012b.A bottom-up participatory modeling process for a multi-level agreement on environmental uncertainty management in West Africa. Journal of Environmental Planning and Management, 1-15.
d'Aquino, P., 2007a. Empowerment and Participation: How Could the Wide Range of Social Effects of Participatory Approaches be Better Elicited and Compared? The Icfai Journal of Knowledge Management. 5 (6), 76-87.
d'Aquino, P., 2007b. Some Novel Information Systems for the Empowerment of a Decision-Making Process on a Territory: Outcomes from a Four Years Participatory Modeling in Senegal. The Icfai Journal of Knowledge Management, 5, (4), 80-89.
d'Aquino, P., Le Page C., Bousquet, F., Bah, A., 2003. Using self-designed role-playing games and a multi-agent system to empower a local decision-making process for land use management: The SelfCormas experiment in Senegal. Journal of Artificial Societies and Social Simulation. 6 (3), 5. http://jasss.soc.surrey.ac.uk/6/3/5.html
d'Aquino P., C. Le Page, F. Bousquet, 2002. A novel mediating participatory modeling: the "self-design" process to accompany a collective decision-making. Int. Jrnl. Agric. Res. Gov. Ecol. (IJARGE), 2, 1: 59-74.
Barreteau, O., Bousquet, F., Attonaty, J-M., 2001. Role-playing games for opening the black box of a multi-agent systems: method and lessons of its application to Senegal River Valley irrigated systems. Journal of Artificial Societies and Social Simulation. 4 (2), 5 <http://www.soc.surrey.ac.uk/JASSS/4/2/5.html>
Barreteau, O., Le Page, C., d'Aquino, P., 2003a. Role-Playing Games, Models and Negotiation Processes. Journal of Artificial Societies and Social Simulation. 6 (2), 2 http://www.soc.surrey.ac.uk/JASSS/6/2/2.html
Barreteau O., Antona M., D'Aquino P., Aubert S., Boissau S., Bousquet F., Daré W., Etienne M., Le Page C., Mathevet R., Trébuil G., Weber J. 2003b. Our companion modeling approach Journal of artificial societies and social simulation, 6 (1) : <http://jasss.soc.surrey.ac.uk/6/2/1.html>.
Bousquet, F., Bakam, I., Proton, H., Le Page, C., 1998. Cormas: common-pool resources and multi-agent simulations. Lecture Notes in Artificial Intelligence. 1416, 826-837. International Conference on Industrial and Engineering Applications of Artificial Intelligence and Expert Systems (IEA-98-AIE). 11, Castellon.
Carlsson, L., Berkes, F., 2005. Co-management: concepts and methodological implications. Journal of Environmental Management. 75, 65–76.
Dray, A., Perez, P., Jones, N., Le Page, C., d’Aquino, P., White, I., Auatabu, T., 2006. The AtollGame experience: from Knowledge Engineering to a Computer-assisted Role Playing Game. Journal of Artificial Societies and Social Simulation. 9 (1), 6. <http://jasss.soc.surrey.ac.uk/9/1/6.html>
Ellis, J.E., Swift, D.M., 1988. Stability of African pastoral ecosystems: alternate paradigms and implications for development. Journal of Range Management. 41, 450-459.
Étienne, M., (ed.), 2011. Companion Modeling. A Participatory Approach to Support Sustainable Development. QUAE editions, Collection Update, Sciences & technologies.
Le Page, C., Becu, N., Bommel, P., Bousquet, F., 2012. Participatory agent-based simulation for renewable resource management: the role of the Cormas simulation platform to nurture a community of practice. Journal of artificial societies and social simulation, 15 (1), 16. <http://www.soc.surrey.ac.uk/JASSS/15/1/16.html>
Lynam, T., Bousquet, F., d'Aquino, P., Barreteau, O. Le Page, C., Chinembiri, F., Mombeshora, B., 2002. Adapting science to adaptive managers: spidergrams, belief models, and multi-agent systems modeling. Conservation Ecology, 5 (2) 24.
Lynam, T., De Jong, W., Sheil, D., Kusumanto, T., Evans, K., 2007. A review of tools for incorporating community knowledge, preferences and values into decision-making in natural
resources management. Ecology and Society, 12, (1), 5.