Publisher’s version / Version de l'éditeur:
Vous avez des questions? Nous pouvons vous aider. Pour communiquer directement avec un auteur, consultez la première page de la revue dans laquelle son article a été publié afin de trouver ses coordonnées. Si vous n’arrivez Questions? Contact the NRC Publications Archive team at
PublicationsArchive-ArchivesPublications@nrc-cnrc.gc.ca. If you wish to email the authors directly, please see the first page of the publication for their contact information.
https://publications-cnrc.canada.ca/fra/droits
L’accès à ce site Web et l’utilisation de son contenu sont assujettis aux conditions présentées dans le site LISEZ CES CONDITIONS ATTENTIVEMENT AVANT D’UTILISER CE SITE WEB.
PLoS ONE, 14, 12, 2019-12-31
READ THESE TERMS AND CONDITIONS CAREFULLY BEFORE USING THIS WEBSITE. https://nrc-publications.canada.ca/eng/copyright
NRC Publications Archive Record / Notice des Archives des publications du CNRC :
https://nrc-publications.canada.ca/eng/view/object/?id=a42633de-22fe-4133-8273-34869820d7ec https://publications-cnrc.canada.ca/fra/voir/objet/?id=a42633de-22fe-4133-8273-34869820d7ec
NRC Publications Archive
Archives des publications du CNRC
This publication could be one of several versions: author’s original, accepted manuscript or the publisher’s version. / La version de cette publication peut être l’une des suivantes : la version prépublication de l’auteur, la version acceptée du manuscrit ou la version de l’éditeur.
For the publisher’s version, please access the DOI link below./ Pour consulter la version de l’éditeur, utilisez le lien DOI ci-dessous.
https://doi.org/10.1371/journal.pone.0226593
Access and use of this website and the material on it are subject to the Terms and Conditions set forth at
Binding and functional profiling of antibody mutants guides selection
of optimal candidates as antibody drug conjugates
Zwaagstra, John C.; Sulea, Traian; Baardsnes, Jason; Radinovic, Stevo;
Cepero-Donates, Yuneivy; Robert, Alma; O’Connor-McCourt, Maureen D.;
Tikhomirov, Ilia A.; Jaramillo, Maria Luz.
Binding and functional profiling of antibody
mutants guides selection of optimal
candidates as antibody drug conjugates
John C. ZwaagstraID1*, Traian Sulea1, Jason Baardsnes1, Stevo Radinovic1, Yuneivy Cepero-Donates1, Alma Robert1, Maureen D. O’Connor-McCourt2, Ilia
A. Tikhomirov2, Maria Luz. Jaramillo1*
1Human Health Therapeutics Research Centre, National Research Council Canada, Montreal, Quebec, Canada, 2 Forbius, Montreal, Quebec, Canada
*john.zwaagstra@nrc-cnrc.gc.ca(JZ);maria.jaramillo@nrc-cnrc.gc.ca(MJ)
Abstract
An increasingly appreciated conundrum in the discovery of antibody drug conjugates (ADCs) is that an antibody that was selected primarily for strong binding to its cancer target may not serve as an optimal ADC. In this study, we performed mechanistic cell-based experiments to determine the correlation between antibody affinity, avidity, internalization and ADC efficacy. We used structure-guided design to assemble a panel of antibody mutants with predicted Her2 affinities ranging from higher to lower relative to the parent anti-body, Herceptin. These antibodies were ranked for binding via SPR and via flow-cytometry on high-Her2 SKOV3 cells and Her2 MCF7 cells, the latter acting as a surrogate for low-Her2 normal cells. A subpanel of variants, representative of different low-Her2-binding affinities (2 strong, 2 moderate and 3 weak), were further screened via high-content imaging for inter-nalization efficacies in high versus low-Her2 cells. Finally, these antibodies were evaluated in ADC cytotoxicity screening assays (using DM1 and MMAE secondary antibodies) and as antibody-drug conjugates (DM1 and PNU159682). Our results identified specific but weak Her2-binding variants as optimal candidates for developing DM1 and PNU ADCs since they exhibited high potencies (low to sub-nM) in high-Her2 SKOV3 cells and low toxicities in low-Her2 cells. The 2 strong-affinity variants were highly potent in SKOV3 cells but also showed significant toxicities in low-Her2 cells and therefore are predicted to be toxic in normal tis-sues. Our findings show that pharmacological profiling of an antibody library in multiple bind-ing and functional assays allows for selection of optimal ADCs.
Introduction
The efficacy of an ADC relies on numerous factors including characteristics of the ADC itself as well as the biologic features of the target and tumor cell. Key factors include the binding affinity of the antibody, internalization and trafficking of the ADC, transport and release of the
a1111111111 a1111111111 a1111111111 a1111111111 a1111111111 OPEN ACCESS
Citation: Zwaagstra JC, Sulea T, Baardsnes J,
Radinovic S, Cepero-Donates Y, Robert A, et al. (2019) Binding and functional profiling of antibody mutants guides selection of optimal candidates as antibody drug conjugates. PLoS ONE 14(12): e0226593.https://doi.org/10.1371/journal. pone.0226593
Editor: Israel Silman, Weizmann Institute of
Science, ISRAEL
Received: June 20, 2019 Accepted: November 30, 2019 Published: December 31, 2019
Copyright:© 2019 Zwaagstra et al. This is an open
access article distributed under the terms of the
Creative Commons Attribution License, which permits unrestricted use, distribution, and reproduction in any medium, provided the original author and source are credited.
Data Availability Statement: All relevant data are
in the manuscript and its supporting information files.
Funding: Forbius provided support for this study in
the form of salaries for authors Maureen O’Connor-McCourt and Ilia Tikhomirov. The specific roles of these authors are articulated in the ‘author contributions’ section. Forbius had no role in study design, data collection and analysis, decision to publish, or preparation of the manuscript.
drug from the endocytosed compartment to the cytosol, the cytosolic concentration and mode of action of the drug [1,2].
The commonly used payload drugs in ADCs are highly potent cytotoxic molecules. Some examples are derivatives of calicheamicin (DNA targeting) and microtubule inhibitors such as maytansine (i.e. DM1 and DM4) and auristatins (i.e. monomethyl auristatin E, MMAE). Off-target platform-related toxicities are frequently seen for ADCs that incorporate these potent drugs, largely due to premature drug release in the blood stream and subsequent systemic exposure. The typical clinical manifestations seen with conventional ADCs containing aurista-tins and maytansines are bone marrow toxicity and peripheral neuropathy [3,4]. Furthermore, on-target (off-tumor) toxicity, due to specific binding of an ADC to normal tissues expressing low levels of target antigen, presents another formidable challenge and is not always predict-able [5,6]. One example is an early clinical trial with AML (acute myeloid leukemia) patients treated with an anti-CD33 calicheamicin (gentuzumab ozogamicin, aka Mylotarg) [7]. Severe bone marrow hypoplasia and myelosuppression (neutropenia) were observed and one patient died. This was attributed to on-target binding of CD33 on the surface of myeloid progenitor cells. Other examples are; bivatuzumab mertansine, which induced severe skin toxicities due to binding to CD44v6 target on normal keratinocytes, and MEDI-547 (anti-Ephrin A2 recep-tor antibody-auristatin) which caused significant bleeding and coagulation, requiring termina-tion of clinical development of these ADCs [8,9]. Toxicity concerns are further compounded when using more potent anthracycline-based drugs such as PNU159682 which intercalate DNA and can target non-dividing cells [10]. Hence, it is important to minimize these serious side-effects and find the right balance between ADC potency and toxicity in order to achieve the optimal therapeutic window.
Recent seminal reports have demonstrated that there is a significant interplay between anti-body affinity, target density/avidity and antianti-body valency. Harms et al [11] used kinetic computational models and flow cytometry measurements to evaluate the effect of different EGFR target densities on the binding of anti-EGFR Fab and full-size antibodies (FSAs) on cells. Strength of binding was shown to be strongly augmented by high target density/avidity. Another group examined a panel of EGFR single-chain Fv (scFv) and Fab antibody fragments that bind to the same EGFR epitope with varying affinities [12]. Binding measurements of the respective monovalent scFv or Fab versus bivalent FSA versions to EGFR-expressing cells showed a dramatic increase in apparent binding affinities (by 100- to 1000-fold) for the weak-affinity Fabs/scFvs when converted to bivalent FSA formats. Large-magnitude changes in apparent affinity due to avidity effects were observed in another study that tested the binding of affinity variants of an anti-Her2 monoclonal antibody to Her2-expressing cancer cells [13]. Beyond cell surface binding, this above mentioned study also showed that both affinity and rate of Her2 internalization dictate the intracellular distribution of anti-Her2 antibodies, thus determining their catabolic fate.
More recently, target avidity was exploited in terms of developing better T cell-dependent bispecific (TDB) antibodies. In this study, the strong contribution of target avidity for promot-ing Her2 tumor selectivity was shown uspromot-ing anti-Her2/CD3 bispecific TBD constructs havpromot-ing one arm comprised of a bivalent-Fab with a range of monovalent Her2 affinities [14]. Low affinity TDBs showed cell surface binding and enabled selective killing of high-Her2 tumor cells (SKBr3) while exhibiting no binding to, or killing of, low-Her2 cells (MCF7). High affinity TBDs readily killed both cell types.
The above studies, which dealt with non-conjugated antibodies as therapeutics, convey the importance of evaluating a wide affinity range and exploiting differential target density/avidity effects at the cell surface. Considering that ADC targets are typically chosen due to differential expression in tumor versus normal tissue, it follows that similar assessments should be
Competing interests: Forbius provided support for
this study in the form of salaries for authors Maureen O’Connor-McCourt and Ilia Tikhomirov. There are no products in development or marketed products associated with this research to declare. Some mutants shown inTable 1are disclosed in US patent USP10,208,129, which is assigned to the National Research Council Canada. This does not alter our adherence to PLOS ONE policies on sharing data and materials.
incorporated upfront in any procedure for screening antibodies for their potential as ADCs. Since high target density on the surface of a cancer cell has been shown to promote binding of low-affinity antibodies, it is apparent that weaker antibodies should not be de-prioritized in the early-phase ADC selection processes.
We proposed to develop a predictive in vitro screening approach to assess antibodies with varying affinities for their potential as ADCs. Our method begins with the classification of antibodies based on binding affinities and target avidity at the cell surface. This is followed by assessments focused on the intracellular mechanisms required for ADC activities. Notably, after binding to the cell surface, an ADC must internalize efficiently and traffic to the appropri-ate cellular compartment (e.g. endosome, lysosome) for processing and drug release. Accord-ingly, in this study candidate ADC antibodies were evaluated for internalization efficiency, intracellular accumulation and cytotoxic potency.
As proof-of-principle, we applied our screening procedure to a rationally designed panel of Herceptin variants ranging from high to low affinity for Her2. These antibodies were ranked based on relative binding affinity to cells having high or low-Her2 densities and were classified as strong, moderate or weak binders. Representative variants from each group were further tested for internalization, followed by cytotoxicity testing with three drugs; DM1, MMAE and PNU159682 (PNU). Our results demonstrate that weak binding antibodies, with affinity KDs
of ~70 nM or more, can exhibit significant ADC potencies in high-Her2 cancer cells while hav-ing low toxicities in low-Her2 cells. In contrast, strong bindhav-ing Her2 antibodies with affinity KDs of ~1 nM or less exhibit high toxicities on both high- and low-Her2 cells, which may be
disadvantageous particularly in the context of very potent payload drugs such as PNU.
Results
Design of Herceptin Fab variants with a wide range of antigen binding
affinities
We set out to assemble a panel of about 20 mutational variants of Herceptin Fab that would cover over 4 orders of magnitude in antigen binding affinity as indicated by the monovalent dissociation constant, KD. It proved to be a challenge to find mutations that increased binding
affinity above that naturally occurring with Herceptin (KDof 0.5 nM) [15]. However, we
iden-tified a few variants with higher affinity and a large number of variants with a wide range of weakened antigen binding affinities. Together, these variants enabled us to examine the prem-ise that a weakened monovalent binding affinity, coupled with the avidity potential of bivalent mAbs, would confer preferential targeting of cells overexpressing the antigen and thus lead to reduced ADC toxicity on cells expressing a low level of antigen.
The panel included Herceptin Fab (termed Parent 1) and derived variants generated by structure-based computational design. As well, a previously characterized Herceptin-derived variant, bH1 Fab, which is a dual-action Fab (DAF) that binds both Her2 and VEGF, was included. This phage-display-derived bH1 Fab, which we term Parent 2, is a variant of Hercep-tin with a 4-amino-acid residues insertion in the CDR-L1 loop as well as a few point muta-tions. It has a binding affinity to Her2 of 20 nM (40-fold weaker relative to Herceptin Fab) [15].
Computational design was initiated with the Her2-complexed crystal structures of Parent 1 and Parent 2 aiming to generate variants with altered antigen binding affinities that can be binned into 4 classes: Strong, Wild-Type-like (WT), Moderate and Weak. In this classification, Parent 1 belongs to the WT class whereas Parent 2 (40-fold increase in KD, equivalent to 2.15
kcal/mol increase in binding free energy) is placed in the Moderate class.Table 1lists the pre-dicted binding affinity ranking and classes for an additional 18 mutants derived from Parent 1
(15 variants) and Parent 2 (3 variants). According to these structure-based computational predictions, the distribution in the Strong, WT, Moderate and Weak classes is 4, 4, 5 and 7 var-iants, respectively. This meets the design criteria for the Fab panel. No significant destabiliza-tion of Fab folding was predicted for any of the designed variants. One or more of 7 amino-acid positions located in the CDR loops were utilized to derive the variants originating from Parent 1 (Fig 1Aupper panel) and 2 positions for the variants derived from Parent 2 (Fig 1A
bottom panel). Overall, mutagenesis targeted only 4 sites in either the heavy chain (D31, Y57, D98 and G99) or the light chain (D28, N30, F53 and Y92) of the Fab.
Various molecular mechanisms were engaged in the design of mutants in these affinity clas-ses. The affinity-improved variants in the Strong class, which originated from an ADAPT affinity maturation campaign of Parent 1 [16], are double- and triple-point mutants that elimi-nate electrostatic repulsions with D586 and E598 of Her2 (Fig 1Bupper panel) by replacing some negatively charged residues of Parent 1 with non-polar or positively charged residues (L-D28K, H-D31K/M, H-D98F). Because single-point mutants at these Fab positions led to smaller affinity-strengthening effects they were placed in the WT class (Table 1).
The eight affinity-weakened variants in the Moderate and Weak classes derived from Parent 1 were based on a completely distinct strategy (Fig 1Bmiddle panel). This relied on removing a few favorable non-polar packing contacts between one or more aromatic residues of the Fab
Table 1. Structure-based computational design of the Fab-mutant set with varied binding affinities to Her2 ectodomain.
ID Mutations Relative binding affinity (Gbind)b Consensus scorec Predicted classd
FoldX Rosetta SIE-Scwrl SUBSET 1 12–9 H-D98F, H-D31K, L-D28K -1.60 -0.92 -0.83 -1.10 Strong 11–9 H-D98F, H-D31M, L-D28K -1.12 -0.90 -0.61 -0.86 Strong 11–1 H-D98F, H-D31K -0.96 -0.44 -0.81 -0.79 Strong 12–1 H-D98F, H-D31M -0.60 -0.42 -0.60 -0.59 Strong 10–1 H-D98F -0.23 -0.48 -0.26 -0.33 WT 2–9 L-D28K -0.43 -0.47 0.06 -0.21 WT 2–1 Parent 1 (Herceptin-Fab); KD= 0.5 nMa 0.00 0.00 0.00 0.00 WT 2–4 L-Y92A 0.38 1.73 0.70 0.97 WT 7–1 H-Y57A 2.07 1.07 0.49 1.07 Moderate 2–3 L-F53N 1.92 1.88 0.39 1.22 Moderate 2–6 L-N30D 3.09 0.86 1.57 1.84 Moderate 2–5 L-F53N, L-Y92A 2.07 3.61 0.78 1.97 Moderate
7–4 H-Y57A, L-Y92A 2.26 2.81 1.69 2.27 Weak
7–3 H-Y57A, L-F53N 3.98 2.95 0.87 2.28 Weak
7–6 H-Y57A, L-N30D 5.18 1.93 2.06 2.91 Weak
7–5 H-Y57A, L-F53N, L-Y92A 4.30 4.68 1.65 3.28 Weak
SUBSET 2
2–13 Parent 2 (bH1-Fab); KD= 20 nMa 0.00 0.00 0.00 0.00 Moderate
15–13 H-G99D 7.71 2.11 0.24 1.37 Weak
16–13 H-G99R 9.44 13.73 -0.93 1.47 Weak
14–13 H-D98W, H-G99D 10.19 1.77 0.31 1.71 Weak
aData from Ref. [15] b
Calculated data with indicated methods, in kcal/mol units.
cAverage of Z-scores for indicated methods, relative to respective Parent, in standard deviation (SD) units (seeMethodssection).
dConsensus score increments between classes are of +1 SD, except for the Strong class with a -1/2 SD increment, relative to respective Parent.
and several Pro residues of Her2 (P557, P571, P603 and P605). Size-reduction mutations at three Fab positions (L-F53N, L-Y92A, H-Y57A) led to mild reductions of Fab binding affinity with this Pro-rich region of the antigen’s protein-protein interface. Double- and triple-point combinations of these mutations had larger effects than individual single-point mutants (Table 1).
The three affinity-weakened variants in the Weak class derived from Parent 2 (itself in the Moderate class, seeTable 1) also implicated a distinct mechanism. For these variants, a combi-nation of size increase in the CDR-H3 loop of the Fab (H-G99D/R, H-D98W) and modulation of electrostatic interactions with the charged residue D570 of Her2 (Fig 1Bbottom panel) were utilized in order to only mildly weaken the affinity of Parent 2.
SPR measurement of Her2 binding affinities and ranking of Herceptin
full-size antibody variants
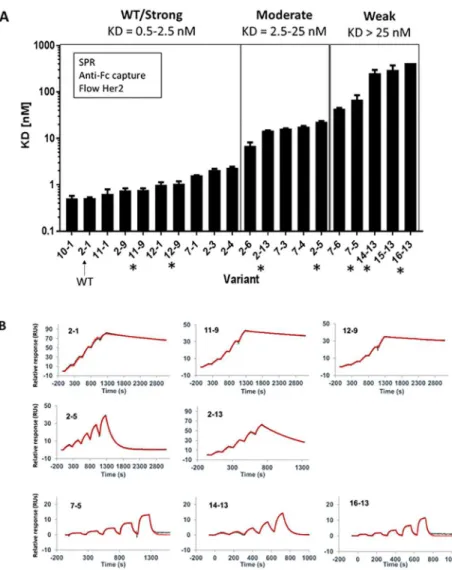
Full-size antibody (FSA) versions of the 20 variants were produced and then analyzed via SPR to determine Her2 binding affinities. Prior to our assays, we also monitored the quality of the FSA samples via size exclusion chromatography (SEC) to ensure purity and rule out biophysi-cal aberrations (i.e. aggregation) that could cause artifacts (S1 Fig). Capturing the antibody on an immobilized anti-Fc antibody surface, followed by flowing soluble Her2 ectodomain in a dilution series, allowed us to measure monovalent Her2 binding.Table 2andFig 2Ashow the SPR-based affinity KDvalues and the ranking of variants from lowest to highest KD. The
vari-ants were classified into three main groups; WT/strong (KD= 0.5–2.5 nM), moderate (KD=
2.5–25 nM) and weak (KD> 25 nM) Her2 binders (Fig 2A). Most variants predicted
computa-tionally to be moderate or weak binders (Table 1) fell into their predicted classes when
Fig 1. Structure-based computational design of a Fab mutant set with varied binding affinity to Her2 ectodomain.
(A) Structural overview of the parent antibodies Herceptin and bH1 binding the same epitope of the Her2 antigen. Crystal structures with PDB codes 1N8Z and 3BE1 are used for Herceptin-Fab/Her2 and bH1-Fab/Her2 complexes, respectively (seeMaterials and methods). Measured Her2 binding affinities of the corresponding Fab fragments are from Bostrom et al. [15] Only the antigen-binding Fv domains of the antibodies are shown as ribbons colored cyan and magenta for the heavy and light chains, respectively. The epitope of the Her2 antigen is rendered as black ribbon inside a translucent gray molecular surface. Mutated positions of the antibodies are shown as CPK models and labeled. The position of a four-residue insert in the CDR-L1 of bH1 relative to Herceptin is also indicated. (B) Molecular details of interactions at the mutated positions of selected antibody mutants. Each sub-panel includes an overlay of molecular models for several antibodies (mutants vs. parent). Mutated antibody residues are labeled and shown as sticks with C atoms colored cyan and magenta for the heavy and light chains, respectively. Her2 residues interacting with mutated Fab positions are shown as stick with white C atoms and labeled in italics.
categorized by SPR. The exceptions are 7–1 and 2–3 which were predicted to be moderate but are WT/strong binders, and 7–3 and 7–4 which were predicted to be weak but are moderate binders. Furthermore, the variants predicted to be strong binders (12–9, 11–9, 11–1, 12–1) were not distinguished via SPR from WT-like binders. This may be due to the fact that high affinities in this range may exceed the ability of SPR to distinguish between very slow off-rates. Overall, there was generally a good correlation between the predicted affinity differences, and the affinity differences determined by SPR.
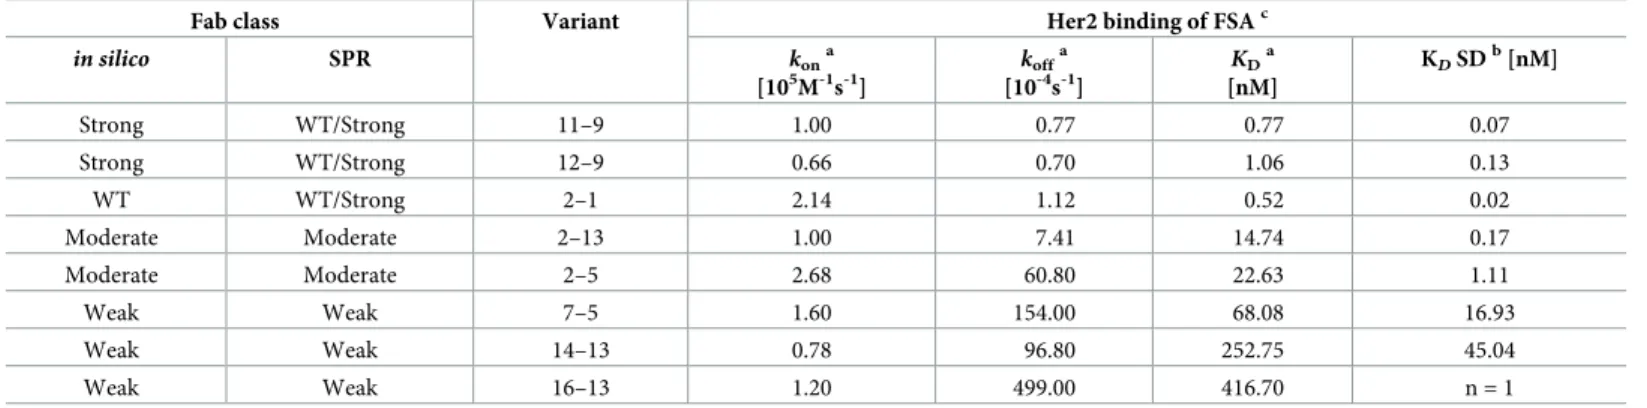
Fig 2BandTable 3show representative Her2 binding sensorgrams and binding kinetic val-ues, respectively, for selected FSA variants from each class. Overall the on-rate for every variant is similar to WT ranging only 5–fold from 6.7 × 10⁶to 2.7 × 10⁵M-1s-1. As mentioned above, the variants predicted to be strong binders (12–9, 11–9) were not distinguished via SPR from WT, possibly due to the fact that these antibodies exhibit very slow off rates (Table 3) that approach the kofflimit (10−5s-1) of the SPR instrument used here (Biacore T200, [17]).
Nota-bly, moderate variants 2–5 and 2–13 show faster off-rates and ~30-40-fold higher KDs,
com-pared to WT. Even faster off-rates are apparent for weak variants 7–5, 14–13 and 16–13 and KDs between ~130-800-fold higher than WT.
Flow cytometry binding assessments of Herceptin variants panel in cells
with high versus low Her2 density
In the following studies, cell lines having very low (MCF7), low (JIMT-1) and high (SKOV3) Her2 densities were used to further screen the mutant panel and distinguish binding affinities,
Table 2. Antibody variants ranked according to monovalent Her2 binding affinities measured by SPR.
Binding strength Variant Mutations Her2 binding of FSAc
KD[nM]a SDb WT/Strong 10–1 H-D98F 0.51 0.07 2–1 Parent 1 (Herceptin-Fab) 0.52 0.02 11–1 H-D98F, H-D31K 0.64 0.16 2–9 L-D28K 0.76 0.08 11–9 H-D98F, H-D31M, L-D28K 0.77 0.07 12–1 H-D98F, H-D31M 1.01 0.12 12–9 H-D98F, H-D31K, L-D28K 1.06 0.13 7–1 H-Y57A 1.60 0.01 2–3 L-F53N 2.10 0.11 2–4 L-Y92A 2.32 0.13 Moderate 2–6 L-N30D 6.85 1.36 2–13 Parent 2 (bH1-Fab) 14.74 0.17 7–3 H-Y57A, L-F53N 16.12 0.33 7–4 H-Y57A, L-Y92A 17.97 0.64 2–5 L-F53N, L-Y92A 22.63 1.11 Weak 7–6 H-Y57A, L-N30D 43.24 2.07 7–5 H-Y57A, L-F53N, L-Y92A 68.08 16.93 14–13 H-D98W, H-G99D 252.75 45.04 15–13 H-G99D 297.75 73.19 16–13 H-G99R 416.70 n = 1 a
Average values, and
b
standard deviations, from duplicate runs except for variant 16–13.
c
Monovalent binding of Her2 ectodomain to FSA variants immobilized on the SPR surface.
including avidity effects, using flow cytometry of live cells.Table 4shows the relative Her2 densities as determined by monovalent binding of Herceptin Fab on these cells, which range from 1,800 to 200,000 receptors per cell. In cell binding assays, we predicted that the lower receptor density of Her2 on MCF7 or JIMT-1 cells should minimize avidity effects and allow assessment of monovalent binding, whereas the higher Her2 density of SKOV3 cells may reveal avidity effects as evidenced by relative apparent binding affinities (KD) and maximal
binding levels (saturation binding levels, Bmax= maximum Median Fluorescence Intensity
(MFI)). Jurkat cells are virtually Her2 negative and provide a good negative control to evaluate the Her2 specificity.
Table 5andS2 Figpanels A-D show the apparent binding KDs and maximum binding
lev-els (Bmax) for the antibody variant classes in the low-Her2 density MCF7 and high-Her2
den-sity SKOV3 cells, as determined by flow cytometry. For ease of comparison, the order of variants inTable 5- corresponds to the SPR ranking order shown above inFig 2A. Four of the 5 weak variants (7–5, 14–13, 15–13 and 16–13) exhibited poor binding in MCF7 cells with
Fig 2. SPR ranking of FSAs and sensorgrams. (A) SPR monovalent KDmeasurements and classification of Herceptin
antibody variants. The asterisks indicate variants selected for further analysis. (B) Representative sensorgrams from WT/Strong (top), Moderate (middle) and Weak (bottom) variant classifications. The red line indicates the fit modelled to a 1:1 interaction with Her2.
their KDs only being approximated (� 200 nM). In MCF7 cells, the apparent cell-binding KDs
for the moderate Her2 binders were significantly higher (range = 0.47–0.87 nM) compared to WT/strong binders (KDrange = 0.02–0.52 nM). Notably, variants 11–9 and 12–9,
computa-tionally predicted as the strongest Her2 binders, showed the lowest apparent KDs (0.02 and
0.04 nM, respectively) compared to the other binding variants. Overall, scanning the classes of Her2 binding variants from WT/strong to weak (left to right,S2 Figpanel A), the progressive
trend is an increase in KD.
In the high-Her2 SKOV3 cells, WT Herceptin (variant 2–1) exhibited a slightly weaker binding affinity relative to that observed in MCF7 cells (1.7 nM versus 0.4 nM) (Table 5). Importantly, the binding of weak variants 7–5, 14–13 and 15–13 on SKOV3 cells significantly improved compared to MCF7 cells, with KDs ranging between 2.8–6.4 nM (versus � 200 nM
on MCF7 cells). The weakest variant, 16–13, also bound better to SKOV3 cells compared to MCF7 cells. This suggests that, on high Her2 density SKOV3 cells, avidity promotes cell sur-face binding of the weak antibodies.
Based on in silico predictions and the SPR and flow cytometry screens, the following sub-panel was selected as representative of the different binding classes: strong (12–9, 11–9), mod-erate (2–5, 2–13) and weak (14–13, 7–5, 16–13). These candidates were further analyzed in competitive cell-binding, internalization, and ADC assays, and were benchmarked against WT Herceptin (2–1).
Table 3. Her2 binding kinetics of selected antibody variants measured by SPR.
Fab class Variant Her2 binding of FSAc kona [105M-1s-1] koffa [10-4s-1] KDa [nM] KDSDb[nM] in silico SPR Strong WT/Strong 11–9 1.00 0.77 0.77 0.07 Strong WT/Strong 12–9 0.66 0.70 1.06 0.13 WT WT/Strong 2–1 2.14 1.12 0.52 0.02 Moderate Moderate 2–13 1.00 7.41 14.74 0.17 Moderate Moderate 2–5 2.68 60.80 22.63 1.11 Weak Weak 7–5 1.60 154.00 68.08 16.93 Weak Weak 14–13 0.78 96.80 252.75 45.04 Weak Weak 16–13 1.20 499.00 416.70 n = 1 a
Average values, and
b
standard deviations, from duplicate runs except for variant 16–13.
c
Monovalent binding of Her2 ectodomain to FSA variants immobilized on the SPR surface.
https://doi.org/10.1371/journal.pone.0226593.t003
Table 4. Relative Her2 receptor levels on cells determined via flow cytometry.
Cells MFIa % Her2b Molecules/cellc
SKOV3 7280 100.0 200,000
JIMT1 400 5.5 11,000
MCF7 68 0.9 1,800
Jurkat 13 0.2 400
a
Mean fluorescence index determined by cell binding of WT-Herceptin-Fab + AlexaFluor488-(Fab)2secondary.
b
Her2 percentage is based on assumed 1:1 binding of Herceptin Fab. On high density Her2 cells (e.g. SKOV3) this may be underestimated due to crosslinking of Fabs by AlexaFluor488-(Fab)2.
c
Value based on calculated number of molecules in SKOV3 cells (derived from Ref. [18]).
Cell-binding behavior of selected candidates
Fig 3A and 3Cshow binding curves for the 8 selected antibodies in low-Her2 MCF7 and high-Her2 SKOV3 cells, respectively, as determined by flow cytometry. Synagis antibody (aka Pali-vizumab), which is directed against an antigen encoded by respiratory syncytial virus (RSV), was included as an IgG1 isotype, negative control to assess non-specific binding. For Her2 binders 11–9 and 12–9, the last 1 or 2 points were above the WT binding plateau in MCF7 cells (>1 nM antibody concentration), likely due to some non-specific binding on this cell line at the high concentrations, and were excluded from the generated curves. The curves were used to determine the binding affinity KDs and Bmaxvalues reported inTable 5. The binding
classes and KDvalues in MCF7 cells are summarized inFig 3B. Together,Fig 3A and 3B
illus-trate the clear distinction between the different classes of Her2 binders on MCF7 cells. Strong variants 11–9 and 12–9 exhibit similar binding affinities (KD= 0.02 and 0.04 nM, respectively)
while moderate variants 2–5 and 2–13 have affinities approximately one order of magnitude lower and are similar to WT (KDrange ~ 0.3–0.9 nM). The weak variants bind poorly (KDs are
greater than 200 nM and cannot be determined accurately for the concentration range of anti-body used in the study).
In contrast to MCF7 cells, and as expected for higher avidity being exhibited by SKOV3 cells, the KDs for most of the variants (from strong to weak) fall into a similar range of apparent
affinity (KD~ 1–6 nM) (Fig 3C). Noticeably, only the weakest variant 16–13 stands out from
the others, with a KDgreater than 200 nM (Table 5). In SKOV3 cells, there is an apparent
decrease in the Bmaxlevels for the weaker variants compared to WT and strong variants
Table 5. Binding parameters KDand Bmaxdetermined from flow cytometry.
FSA class
(based on SPR & flow cytometry)
Variant MCF7 cells SKOV3 cells
Bmax[MFI] KD[nM] Bmax[MFI] KD[nM]
WT-similar 10–1 697 0.28 26698 1.26 WT 2–1 668 0.36 27418 1.67 WT-similar 11–1 710 0.20 26888 1.02 WT-similar 2–9 746 0.43 26946 1.29 Strong 11–9 700 0.02 28223 0.80 WT-similar 12–1 644 0.19 27497 0.98 Strong 12–9 763 0.04 32350 0.90 WT-similar 7–1 673 0.52 27121 2.27 WT-similar 2–3 636 0.30 27790 1.95 WT-similar 2–4 656 0.39 27379 1.98 Moderate 2–6 588 0.51 26948 2.58 Moderate 2–13 644 0.87 26549 2.41 Moderate 7–3 527 0.67 26546 2.34 Moderate 7–4 539 0.47 27027 2.41 Moderate 2–5 532 0.69 26561 1.98 Weak 7–6 503 0.95 26361 3.16 Weak 7–5 455 594a 21903 3.50 Weak 14–13 NR 200a 21950 2.76 Weak 15–13 260a 293a 20420 6.42 Weak 16–13 NR 2075a 18072a 289a aApproximated value. NR: not reached. https://doi.org/10.1371/journal.pone.0226593.t005
(Fig 3CandS3 Figpanel B), suggesting differences in their engagement of Her2 receptors at
the cell surface (see theDiscussionsection).
In the cell binding assays presented so far, it is possible that, in the case of weak binders with fast off-rates, the washing procedure may have unintentionally removed some of the bound antibody. In order to measure relative binding strengths of the mutants in a manner that is less sensitive to fast off-rates, we performed competitive binding. This assay measures the ability of variant antibodies to compete with fluorescently-labeled WT antibody for bind-ing to SKOV3 cells. Increasbind-ing concentrations of variant antibody were combined with a constant subsaturating amount of fluorescently-labelled WT. The sample mixture was then added to SKOV3 cells, incubated a 4˚C to allow surface binding and cells were subsequently analyzed by flow cytometry to measure the effect on surface-bound fluorescence signal.S4 Figshows the competition binding curves and respective IC50s for each variant antibody, as
compared to WT (homologous binding) and Synagis controls. Strong binders 12–9 and 11–9 both competed more strongly for binding than the WT control. Moderate binders 2–5 and 2–13 competed less strongly than the WT control. Weak binders 7–5 and 14–3 competed even less strongly, with 16–13 appearing as the weakest. The competition IC50s reveal a clear
discrimination amongst the Her2 binding antibody classes in accord with the increased com-petitive binding strengths of the variant antibodies. Together these results confirm the rank-ing order of the chosen candidate variants and designated classifications. In addition, the ability of these antibodies to compete with WT Herceptin (2–1) for binding to Her2 on SKOV3 cells verifies that their mutated residues did not alter specificity for their shared Her2 epitope.
Fig 3. Saturation binding curves and apparent binding affinities (KDs) of selected antibody variants in low-Her2
(MCF7) and high-Her2 (SKOV3) cells, as determined via flow cytometry. (A, B) MCF7 cells. (C, D) SKOV3 cells.
Internalization screens of candidate antibodies using high content imaging
To assess the contribution of Her2 binding affinity on cell internalization, endocytosed anti-body was detected using anti-human IgG secondary antianti-body labelled with pH-sensitive dye pHAb and quantified using high-content imaging methodology. This dye emits a strong fluo-rescence signal in the low pH environment in endosomes and lysosomes but not at neutral pH (pH ~7) exterior to the cell. In this indirect assay, increasing concentrations of antibody were combined with pHAb secondary antibody and then the mixture was added to high-Her2 SKOV3 cells in 96-well plate format. The cells were incubated at 37˚C for 18 h to allow for internalization, followed by detection of fluorescence using an ImageXpress imager. This method indirectly measures the total intracellular accumulation of internalized antibody over time.
The top ofFig 4Ashows the pHAb fluorescence signals in SKOV3 cells treated with the dif-ferent antibody variants. Shown are duplicate well-view images of cells at selected doses (2 and 6 nM) from the concentration series. The bottom ofFig 4Ashows representative, processed images showing antibody fluorescence (yellow) and cell nuclei (blue, Hoechst stain). Imaging software identifies and quantifies fluorescence signals from small punctate objects, which rep-resents internalized antibody. This is measured as a total integrated Fluorescence Intensity which is normalized to the nuclear count (FI/nucleus).Fig 4Bshows dose-dependent, internal-ization response curves for the mutants in SKOV3 cells. Internalinternal-ization efficiencies derived from these curves (measured as EC50, concentration at which the amount of internalized
anti-body is 50% relative to the maximum), are summarized inFig 4CandS1 Table.
The internalization curves for strong (12–9, 11–9) and moderate variants (2–5, 2–13) appear to be distinct from each other (Fig 4B). Noticeably, internalization levels are higher at every dose for strong Her2 binders, compared to the moderate and WT antibodies. Neverthe-less, internalization EC50s of strong and moderate variants are similar to WT (EC50range =
0.41–1.08 nM,Fig 4C). In contrast, internalization of the weak variants (14–13, 7–5, 16–13) is less efficient (EC50range ~2–5 nM) although maximum accumulated levels after 18 h are
simi-lar compared to moderate and WT Her2 binders (~4 × 10⁶integrated FI/nucleus,Fig 4B).Fig 4Dcompares the fluorescence levels between the different variants at 2 selected doses (2 and 6 nM) that are typically below the target-independent toxicity IC50s normally observed for
irrel-evant ADCs in an ADC cytotoxicity assay (e.g. Synagis-DM1 IC50~ 40 nM). At these
effica-cious doses, the level of internalized antibody correlates directly with binding strength of the mutants.
To validate our indirect internalization screening results, which used a pHAb-labelled sec-ondary antibody, we next performed direct internalization in SKOV3 cells using antibody vari-ants directly conjugated to pHAb. Following conjugation, the dye/antibody ratios (DARs) were similar between the variants (~1.4–2.3 dye molecules/antibody) and sample aggregation was checked via SEC (> 93% monomer content,S2 Table). It should be noted that image acquisition parameters were adjusted according to the lower background signal and a wider dynamic range was achieved in this direct assay, compared to the indirect assay.
Fig 5Ashows DAR-normalized, internalization curves for pHAb-antibody variants in SKOV3 cells treated at 37˚C for 18 h.Fig 5C, left panel, andS1 Tablesummarize the EC50s
derived from these curves. The wider dynamic range allowed us to distinguish between the EC50s of strong/WT versus moderate and weak Her2-binding antibody classes more readily
than observed in the indirect internalization screen (compare direct,Fig 5C, with indirect,
Fig 4C).
We next attempted to assess Her2 avidity effects on internalization of antibody variants by comparing SKOV3 versus MCF7 cells. However, in both direct and indirect internalization
Fig 4. Internalization of antibody variants in SKOV3 cells as measured using indirect detection by pHAb-secondary antibody and high content imaging. (A) Well-view images of SKOV3 cells treated with the indicated
variant antibody plus pHAb-labelled secondary antibody at 37˚C for 18 h (top panel). 2nd= secondary antibody alone, Synagis = IgG1 control. The bottom panel shows representative processed images (yellow = antibody; blue = nuclei).
(B) Internalization dose response curves, plotting integrated fluorescence intensity/nucleus versus Log10concentration
of antibody. (C) Internalization EC50s (concentration at which the amount of internalized antibody is 50% relative to
maximum accumulation) of variants derived from dose response curves. (D) Intracellular fluorescence intensities at selected concentrations of antibody (2 and 6 nM).
assays, fluorescence signals for moderate and weak mutants were not sufficiently above back-ground in MCF7 cells, likely due to their low Her2/binding levels (S5 Fig). We decided to use JIMT-1 cells, which have Her2 levels that are low, but are ~6-fold higher than in MCF7 cells (Table 4). In contrast to SKOV3 cells, in JIMT-1 cells the direct internalization curves for mod-erate variants 2–5 and 2–13 were well separated from strong variants and WT (Fig 5B), i.e. internalization efficiencies of the moderate Her2 binding variants were markedly lower than strong variants and WT (by ~ 60-370-fold,Fig 5C, right panel,S1 Table). Internalization for the weak binding variants in JIMT-1 cells was very low and not measurable.
Fig 5. Internalization in SKOV3 and JIMT-1 cells as measured by direct detection of pHAb-labelled antibody variants and high content imaging. Internalization dose response curves of variants in (A) SKOV3 cells and (B)
JIMT-1 cells, following treatment with antibody at 37˚C for 18 h. (C) Internalization EC50s of variants.
Together, our binding and internalization results indicate that high Her2 density and avid-ity at the cell surface greatly improves Her2 binding and internalization of moderate variants to levels approaching that of WT Herceptin. Weak variants also bind better when Her2 den-sity/avidity is high and this promotes internalization, although the levels of internalized anti-bodies are less than for WT and moderate variants. Strong mutants always bind well and internalize efficiently, independently of avidity.
Drug-conjugate screens of antibody variants in cells with different Her2
densities
The antibody variants were next evaluated for ADC potential using an indirect ADC cytotoxic-ity assay, comparing activities in SKOV3, JIMT-1 and MCF7 cells and using two different drugs; DM1 and MMAE. MCF7 cells were used as a surrogate for ‘normal’ low-Her2 tissue cells and an indicator of potential ADC toxicity [19]. We compared MCF7 and JIMT-1 cells in order to explore possible thresholds of Her2-mediated avidity. We wished to determine whether the slightly higher Her2 levels on JIMT-1 cells might be sufficient to promote ADC activity of the weaker variants, as suggested above in our internalization data with JIMT-1 cells.
Control Her2-negative Jurkat cells were first tested to assess for Her2-specific versus non-specific ADC effects. In the indirect ADC assay, increasing concentrations of antibody variant complexed with DM1-conjugated secondary antibody was added to cells in a 384-well plate format, followed by incubation at 37˚C for 5 days. DM1 drug alone was also tested as a positive control. Cell viability was measured via ATP detection using Cell Titer-Glo as a readout. In Jurkat cells, no cytotoxicity was detected up to 10 nM for any of the antibody variants, indicat-ing that the ADC responses reported below in SKOV3, JIMT-1 and MCF7 cells are indeed Her2 specific (S6 Fig). Only the active DM1 drug control resulted in significant cytotoxicity in the sub-nM range.
S7A–S7C Figshows growth inhibition curves from the secondary-DM1 ADC screening assay for antibody-treated SKOV3, JIMT-1 and MCF7 cells, plotted as % surviving fraction (relative to non-treated cells) versus antibody concentration. The DM1 ADC IC50s derived
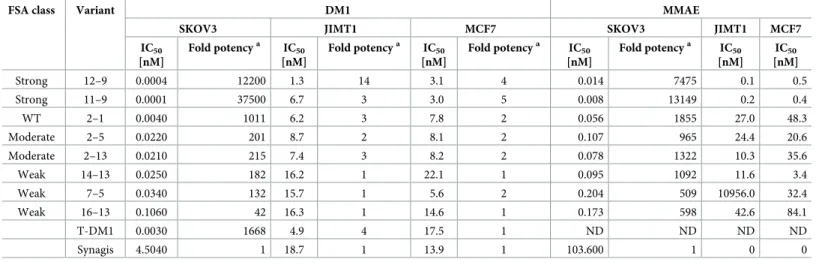
from these curves are summarized inS8 Figpanels A-C andTable 6. In SKOV3 cells, the moderate and weak variants all show lower potencies (IC50range = 0.022–0.106 nM)
com-pared to either WT Herceptin (2–1; IC50= 0.004 nM) or the direct DM1-conjugated Herceptin
control (T-DM1; IC50= 0.003 nM). In contrast, the strong variants are highly potent (IC50
range = 0.0001–0.0004 nM), exhibiting IC50s approximately one order of magnitude lower
than WT. The ADC potencies for all the variants are well above background, as determined by the isotype antibody control (Synagis; IC50= 4.5 nM).
In the DM1 ADC screen with JIMT-1 and MCF7 cells, the strong variants again exhibited the highest potencies (low nM), that were ~2-5-fold more potent than WT and moderate anti-bodies. Nevertheless, the DM1 potencies for WT and moderate variants were slightly (2-3-fold) stronger than the irrelevant antibody control (Synagis) background in these low-Her2 cells (Table 6,S8B and S8C Fig). In contrast, in most cases the DM1 potencies for the weak antibodies were closer or identical to that seen with the irrelevant antibody control (Synagis) background in these low-Her2 cells.
A similar relative ranking of the antibody variants is observed between the DM1 and MMAE screens in the high-Her2 SKOV3 cells (compare DM1 and MMAE,S8 Figpanels A
and D, respectively). Similar to DM1, with MMAE the strong variants showed the highest potencies in SKOV3 cells (MMAE IC50s ~ 0.01 nM) and moderate and weak variants also
JIMT-1 and MCF7 cells the moderate and weak (and WT) antibodies all showed low potencies (majority > 10 nM,S8E and S8F Fig,Table 6). These results indicate that with MMAE the WT antibody and all the weaker Her2 binding variants showed only low, background toxicities in JIMT-1 and MCF7 cells, hence they are not likely to exibit target-dependent toxicity with this drug in low-Her2 tissues.
In order to validate the ADC activities of the variants seen in our ADC screens and the advantage of Her2 avidity-mediated selectivity for SKOV3 cells, we performed ADC assays using antibodies directly conjugated to two different drugs and linkers; SMCC-DM1 and the highly potent vc-PNU159682 (PNU). It should be noted that SPR-based assessments of the drug-conjugated antibodies (S3 Table) indicated that Her2 binding of variant 12-9-DM1 was significantly impaired, likely due to amine/drug-coupling to one or both of the two substituted lysines within the binding site of this particular mutant (Table 1). Consequently, 12–9 was not included in our direct ADC assays. The drug-conjugated antibodies were tested for their rela-tive cytotoxic potencies in SKOV3 cells versus JIMT-1 and MCF7 cells (Fig 6A–6C,Table 7,S9 Fig). In the direct ADC assay with DM1-conjugated variants in SKOV3 cells, the variants dif-fered as predicted from the above binding, internalization and indirect ADC assays, having IC50s that ranged from 0.003 to ~ 8 nM (Fig 6A,Table 7,S9 Figpanel A). However, in the
low-Her2 JIMT-1 and MCF7 cells, the potencies of the DM1-conjugated variants could not be distinguished from the control Synagis-DM1 (S9 Figpanels B and C), perhaps due to
over-rid-ing, non-target mediated ADC uptake by pinocytosis. We proposed that we would see higher on-target potency in the low-Her2 cells if the variants were coupled to a stronger payload, such as PNU, and this would enable separation between the specific versus non–specific effects.
Fig 6, panels A and B show the IC50s for the DM1 and PNU conjugated antibodies,
respec-tively, in SKOV3 cells. The rank orders of the DM1 and PNU antibodies, based on potency, were similar and coincided with that observed in the indirect conjugated-DM1 ADC screen using SKOV3 cells. As previously seen in the internalization assays, the relative potencies between the different variant classes were more clearly separated for the directly conjugated antibodies compared to the ADC screen using a drug-conjugated secondary antibody (com-pare direct,Fig 6, panels A and B, with indirect,S7 Figpanel A). This is likely due to the
addi-tional avidity effect caused by the secondary antibodies and this appears more pronounced on
Table 6. Potencies of antibody variants indirectly conjugated to the DM1 and MMAE cytotoxic drugs.
FSA class Variant DM1 MMAE
SKOV3 JIMT1 MCF7 SKOV3 JIMT1 MCF7 IC50 [nM] Fold potencya IC50 [nM] Fold potencya IC50 [nM] Fold potencya IC50 [nM] Fold potencya IC50 [nM] IC50 [nM] Strong 12–9 0.0004 12200 1.3 14 3.1 4 0.014 7475 0.1 0.5 Strong 11–9 0.0001 37500 6.7 3 3.0 5 0.008 13149 0.2 0.4 WT 2–1 0.0040 1011 6.2 3 7.8 2 0.056 1855 27.0 48.3 Moderate 2–5 0.0220 201 8.7 2 8.1 2 0.107 965 24.4 20.6 Moderate 2–13 0.0210 215 7.4 3 8.2 2 0.078 1322 10.3 35.6 Weak 14–13 0.0250 182 16.2 1 22.1 1 0.095 1092 11.6 3.4 Weak 7–5 0.0340 132 15.7 1 5.6 2 0.204 509 10956.0 32.4 Weak 16–13 0.1060 42 16.3 1 14.6 1 0.173 598 42.6 84.1 T-DM1 0.0030 1668 4.9 4 17.5 1 ND ND ND ND Synagis 4.5040 1 18.7 1 13.9 1 103.600 1 0 0 a
Fold potency = IC50Synagis / IC50Variant.
ND: not determined.
weaker variants than for WT, moderate or stronger Her2 binders (compare fold-potency effects for direct versus secondary DM1-labelled antibodies in SKOV3 cells, Tables7and6,
respectively).
In SKOV3 cells, ADC variant 11–9 was very potent, having IC50s either ~ 10-fold lower or
similar to WT (IC50= 0.003 and 0.041 nM when conjugated to DM1 and PNU, respectively, Table 7). However, PNU-conjugated 11–9 and WT both showed significant potencies (low to sub-nM) in MCF7 and JIMT-1 cells, indicating they are likely to be toxic in low-Her2 normal tissues (Table 7). Moderate (2–5, 2–13) and weak (14–13, 7–5) variants also had significant PNU potencies (low to sub-nM) in SKOV3 cells. In contrast to WT and the strong variant, their potencies were low in MCF7 and JIMT-1 cells and ranged either ~2-16-fold above (2–5, 2–13, moderate class) or similar (14–13, 7–5, weak class) to the Synagis background range (~8–10 nM) in these cells, indicating a low toxicity for these variants in low-Her2 cells. The weakest antibody, 16–13, showed the lowest potencies, close to background with both DM1 and PNU in SKOV3 cells.
Fig 6. Direct ADC cytotoxicity of DM1 and PNU conjugated variants in Her2 cells. IC50s of DM1-antibodies (A)
and PNU-antibodies (B) in SKOV3 cells. (C) Survival curves in SKOV3, JIMT-1 and MCF7 cells treated with the indicated antibody-PNU variant or Synagis-PNU. Double-head black arrows denote the therapeutic window (concentration range between high-Her2 SKOV3 and low-Her2 MCF7 cells). The data are normalized, based on DAR (Drug Antibody Ratio), to account for small DAR differences between antibody variants.
Fig 6Cshows survival curves for the three different cell lines for PNU-conjugated WT and representative variants from each class, compared to Synagis-PNU. The different variant clas-ses were readily distinguished based on the pattern of their potencies in the high versus low Her2 cell lines. Specifically, it can be seen that WT exhibited similar potencies in MCF7 (blue), JIMT-1 cells (red) and SKOV3 cells (black circle). A similar cytotoxicity profile for the three cell lines can also be seen for the strong affinity 11-9-PNU ADC. In contrast, the potencies observed for moderate 2-5-PNU and weak 14-13-PNU ADCs in MCF7 and JIMT-1 cells are close or identical with Synagis-PNU IC50s (shown in grey). The right-shift towards
non-spe-cific toxicity is most pronounced for weaker variants 14–13 and 7–5, however this is at the expense of lower potency in SKOV3 cells (weak variant IC50range ~ 1.5–2.1 nM) compared to
moderate variants 2–5 and 2–13 (IC50range ~ 0.08–0.14 nM) (see SKOV3 PNU values, Table 7). Together, these results illustrate a wider therapeutic window for the moderate anti-body variants when conjugated to PNU, as compared to weak variants, but at the expense of some toxicity in the low-Her2 cells above background levels (Fig 6C). Notably, variant 16-13-PNU showed no significant toxicity above Synagis-PNU background in all cell lines examined.
In summary, our results indicate that the antibody variants fall into 3 classes based on affin-ity and avidaffin-ity driven effects on binding, internalization and ADC activaffin-ity: 1) Strong Her2-binding antibodies (12–9 and 11–9) are highly potent ADCs but have the potential to exhibit toxicity in normal cells/tissues, based on their high-binding and toxicity in low-Her2 cells. 2) The moderate and weak classes of antibodies are potent ADCs in high-Her2 cancer cells (e.g. SKOV3) with less potential to be toxic in normal tissues, based on their low ADC potencies in low-Her2 cells (� 11,000 Her2/cell). This selective activity on high versus low Her2 cells results from low affinity variants being dependent on Her2 avidity. 3) A further distinction between the relative potencies of moderate (2–5, 2–13) and weak (14–13, 7–5) antibodies was seen when conjugated to payloads DM1 and PNU. With PNU, antibodies 14–13 and 7–5 showed the lowest toxicity on low-Her2 cells, having IC50s similar to isotype control antibody.
Discussion
This study describes a comprehensive regimen for pharmacological characterization and opti-mal selection of ADC candidates based on their intrinsic binding properties. Selection is based
Table 7. Potencies of antibody variants directly conjugated to the DM1 and PNU cytotoxic drugs.
FSA class Variant DM1 PNU
SKOV3 SKOV3 JIMT1 MCF7
IC50 [nM] Fold potencya IC 50b [nM] Fold potencya IC 50b [nM] Fold potencya IC 50b [nM] Fold potencya Strong 11–9 0.003 12610 0.041 123 0.08 102 1.24 8 WT 2–1 0.034 1117 0.022 229 0.13 63 0.56 17 Moderate 2–5 0.161 239 0.138 37 3.38 2 4.72 2 Moderate 2–13 0.075 512 0.077 66 0.50 16 2.02 5 Weak 14–13 2.658 14 1.525 3 9.66 1 12.75 1 Weak 7–5 2.007 19 2.078 2 11.80 1 13.66 1 Weak 16–13 8.033 5 3.993 1 9.29 1 15.05 1 Synagis 38.360 1 5.038 1 8.08 1 9.61 1 a
Fold potency = IC50Synagis / IC50Variant
bMean IC50 for n = 3 experiments using PNU conjugated variants
on quantitative measurements of cell-surface binding, internalization efficiency and ADC cytotoxicity. Our test panel was comprised of structure-based computationally-designed Her-ceptin variants that bind to the same Her2 epitope with different affinities. This evaluation focused particularly on the contributions of varied affinity, in the context of an identical anti-body scaffold, and varied cell-surface Her2 density/avidity.
Despite their high activity in cell line models, preclinical studies using naked antibodies have shown that antibodies with very strong affinity for their respective target can exhibit poor tumor penetration, hence low therapeutic efficacy against solid tumors in vivo. This is attrib-uted to strong binding to target antigen on the cells at the tumor periphery, thus preventing further diffusion of the antibody into the tumor mass, a phenomenon termed the “binding-site barrier” [20,21]. Furthermore, it was noted in the case of anti-Her2 antibodies, that after bind-ing target antigen in the peripheral tumor cells, strong-affinity antibodies promoted enhanced internalization and degradation [13]. When purposing an antibody as an ADC, such routing towards degradation and drug release is preferred. Hence, we deemed it important to consider both strong and weak affinity Herceptin antibodies in our evaluation, combined with a careful determination of their relative ADC efficacies and toxicities.
In our criteria for selection of ADCs, we sought antibody candidates that were ‘just right’ in terms of selective binding, intracellular accumulation, and cytotoxicity in high-Her2 SKOV3 cells versus low-Her2 cells (MCF7 cells were chosen as a surrogate for low-Her2 normal cells). Taken together, our results identified two weak Her2-binding antibody candidates (7–5, 14– 13) that best fit these criteria, as exemplified for the PNU class of ADCs. Nevertheless, if a less potent drug is used, the moderate variants may be preferred in order to achieve efficient killing of high-Her2 tumors in vivo. For example, the moderate variants (2–5, 2–13) conjugated to DM1 showed significant potencies against SKOV3 cells (IC50range ~ 0.08–0.16 nM) (Table 7).
Our cell-binding experiments showed that both moderate (2–5, 2–13) and weak (7–5, 14– 13) antibodies exhibited binding in SKOV3 cells that was similar to WT (KDrange ~1–4 nM, Fig 3D). In contrast, the weak antibodies bound poorly to MCF7 cells (KDs of weak antibodies
were > 100-fold higher than for moderate and WT antibodies,Fig 3B). These results show the significant contribution of Her2 avidity in SKOV3 cells for improving binding of the weak antibodies. The selective binding of the weak antibodies to high-Her2 cells versus weak bind-ing to low-Her2 cells suggests a better safety profile compared to the moderate class and WT. Paradoxically, the apparent KDvalues determined for WT Herceptin, WT-similar, strong
and moderate variants, by cell-binding to SKOV3 cells were somewhat higher than for MCF7 cells (Table 5). This is counterintuitive, based on the respective high versus low Her2 densities on these cells and expected avidity effects. This behavior was previously seen for an anti-EGFR antibody and was attributed to experimental limitations due to an insufficient incubation period for the antibody to achieve equilibrium binding (estimated to require several days) [12]. In addition, we anticipate some contribution of antibody depletion at low antibody doses (i.e. <1 nM), resulting in less available antibody per Her2 receptors on SKOV3 cells compared to MCF7 cells. Despite this limitation, the cell-binding assays were informative as a screening tool for ranking antibodies and identifying Her2 avidity effects.
The maximum binding levels (Bmax) attained by the weak antibodies 7–5 and 14–13 were
lower than Bmaxlevels seen for strong, moderate and WT antibodies in SKOV3 cells (Fig 3C).
This is likely due to differential receptor engagement by the weak versus stronger binders, as alluded to by Harms et al. [11] based on their cell-binding assays using EGFR-binding anti-bodies with different affinities [11]. As illustrated inFig 7A, at high concentrations, bivalent crosslinking of Her2 receptors by an antibody with strong affinity (e.g. 12–9) is presumably competed away by monovalent binding, giving rise to a higher number of antibodies bound at the cell surface. WT (2–1) antibody, being weaker than 12–9, exhibits less monovalent binding
and hence a lower number of antibodies bind to the surface (i.e. lower Bmax, compared to 12–
9). In contrast to strong and WT antibodies, weak antibody (e.g. 7–5) can only bind bivalently, due to fast intrinsic dissociation rate of monomer, resulting in the lowest Bmax. Support for
high intrinsic binding and receptor occupancy of the strong variants (11–9 & 12–9) and WT was seen in binding experiments with SKOV3 cells using monovalent Fab versions (S10 Fig) in which the strong and WT Fabs reached a similar maximum binding level (presumably full receptor occupancy), with the strong variants exhibiting higher affinity (binding curves shifted left compared to WT). In the absence of avidity, monovalent moderate and weak Fab variants did not attain maximum binding even at the highest concentration used (1 μM). Despite weaker binding compared to stronger antibodies (and WT), it is apparent that the decreased number of Her2 receptors engaged by bivalent 7–5 and 14–13 antibodies on the surface of SKOV3 cells was sufficient for their internalization and growth inhibition in these cells when coupled to potent drugs.
The internalization assays demonstrated that weak antibodies 7–5 and 14–13 internalize moderately well in SKOV3 cells whereas internalization was very low and not measurable in low-Her2 JIMT-1 cells when detected using pHAb fluorescence (Fig 5C). In contrast, the mod-erate affinity antibodies did internalize in JIMT-1 cells, although with reduced efficacies com-pared to SKOV3 cells. These results suggest that minimal thresholds of antibody binding and Her2 receptor engagement are required for efficient internalization and ADC activity and that full receptor occupancy on the surface of the cells is not necessary for maximal effect, as eluci-dated in the “spare receptor” concept in pharmacology [22]. In the case of the strong antibod-ies (and WT), presumably these thresholds are attained even in the lower Her2 JIMT-1 cells, based on the significant internalization observed for these variants (strong and WT antibody internalization EC50s < 1 nM in JIMT-1 cells,S1 Table).
As expected, and based on both the indirect ADC screens and assays using drug-conjugated antibodies, strong antibodies 12–9 and 11–9 exhibited the highest potencies compared to the lower affinity antibody classes in all Her2 cell lines tested (S7 FigandFig 6). These strong vari-ants were extremely potent in SKOV3 cells and also showed significant toxicities in the low-Her2 MCF7 cells with all 3 drugs tested; DM1, MMAE and PNU (Tables6and7). These results flag these strong variants as likely to show toxicity as ADCs in normal cells and tissues.
Based on the indirect ADC screens alone, the weak and moderate class of variants showed similarly potent cytotoxicities in SKOV3 cells (DM1 and MMAE IC50s ~ sub-nM range) and
much lower potencies on low-Her2 cells, indicating their high potential as ADCs (Table 6). Using directly DM1-conjugated antibodies in SKOV3 cells, the potencies of the moderate and weak classes of antibodies were further distinguished, differing by ~ one log (IC50s of
moderate (2–5, 2–13) and weak (14–13, 7–5) variants ranged ~ 0.1–0.2 nM and 2–3 nM, respectively,Fig 6A,Table 7). These results illustrate that ADC screens using secondary anti-bodies conjugated to drugs such as DM1 and MMAE are useful as a first-round tool to identify ADC hits. Subsequently, direct drug conjugation is required to resolve ADC potency differ-ences between lower affinity candidates (in this case KDs ranging ~ 20–250 nM).
It should be noted that, for antibodies conjugated to DM1 or MMAE, it is important to evaluate potencies attributed to the different linker-drug combinations. For example, DM1 conjugated 2–1 (WT) and 2–13 (moderate) antibodies showed high potencies that were distin-guishable in SKOV3 cells (IC50s = 0.03 and 0.08 nM, respectively) and were well above
Syna-gis-DM1 background (IC50= 38 nM) (Table 7). In contrast, the potencies of MMAE
conjugated 2–1 and 2–13 antibodies were similarly low in SKOV3 cells (IC50s ~ 100 nM, S11 Fig) and close to Synagis-MMAE background.
Overall, our results indicate that Herceptin antibody variants with moderate and weak affinity for Her2 are good ADC candidates with potential advantage over strong antibodies. In
particular, weak variants 7–5 and 14–13 are identified as the most promising PNU ADC candi-dates for treating high Her2 cancers based on the following criteria: 1) they show selective binding to SKOV3 cells and significant (sub nM) ADC potencies and 2) they exhibit the lowest toxicities in low-Her2 cells compared to strong, moderate and WT Herceptin.Fig 7B summa-rizes the concept of exploiting Her2 avidity to achieve selective binding and cytotoxicity using weak-affinity ADCs. The low binding and minimal toxicity of weak-affinity ADCs in low-Her2 cells should enhance their safety profile and mitigate against low-Her2-mediated adverse effects, such as hepatotoxicity noted for T-DM1 [23]. At the same time, it is recognized that T-DM1 can elicit off-target effects attributed to its payload, e.g. thrombocytopenia and ele-vated liver transaminases [24–28]. Nevertheless, our results support a strategy that can be
Fig 7. (A) Saturation binding of affinity-modulated antibodies on high-density Her2 cells. Shown are binding
curves for strong (12–9) and weak (7–5) affinity variants and WT antibody that show the different Bmaxlevels attained
by these antibodies on SKOV3 cells, as determined via flow cytometry. The schematics (boxes) illustrate how affinity affects the number of antibodies and Her2 receptors (brown oval circles) engaged at the cell surface. (B) Schematic
that illustrates Her2 avidity resulting in selective binding of weak-affinity ADC to Her2 receptors on SKOV3 tumor cells and cytotoxicity. Left panel: strong-affinity ADC (e.g. variant 11–9 or 12–9) readily binds Her2 receptors
on both SKOV3 and MCF7 cells, resulting in cytotoxicity and cell death. Right panel: weak affinity ADC (e.g. variant 7–5 or 14–13) binds well to SKOV3 cells, due to high-density Her2 avidity, but binds poorly to low-density Her2 MCF7 cells, resulting in low cytotoxicity in MCF7 cells.
applied to a large number of “dirty” targets in which target expression is present at high density on tumor tissue, yet still quite significant on normal host tissue, such as CD44.
Interestingly, the Her2 affinity range of the 7–5 and 14–13 antibody candidates (KDrange
of ~70–255 nM,Table 2), chosen for SKOV3 versus MCF7 selectivity, is modestly weaker than that proposed by Slaga et al. [14], for Her2/CD3 T-cell dependent bispecific (TDB) anti-bodies (KD= 23–49 nM), which also rely on avidity binding to promote tumor selectivity.
However, these differences in affinity may be related to the different high-Her2 density cell line models chosen (SKBr3 for the TBDs versus SKOV3), different modes of action (T-cell-mediated killing versus ADC) or the antibody formats (fusion of anti-Her2 Fab to the N-termi-nus of the IgG heavy chain versus conventional ADC). The affinity for an optimal ADC target-ing Her2 tumors will also depend on the drug utilized. For example, a higher affinity may be required for an antibody coupled to a less potent drug such as DM1 compared to PNU, e.g. KD
in the range of the moderate variants (KD~15–25 nM).
Based on their weakened affinities relative to Herceptin, it is anticipated that 7–5 and/or 14–13 ADCs will provide the added benefit of improved drug delivery into solid tumors. A recent report compared the in vivo efficacies of 3 ADCs based on different antibodies that tar-get tissue factor (TF) and differed in binding affinities by ~ 10–70 fold (KDrange ~ 0.5–35
nM) [29]. Treatments with the lowest-affinity (35 nM) ADC resulted in a modest improve-ment in pancreatic tumor (BxPC-3) reduction compared to the highest-affinity (0.5 nM) ADC. This improvement was only seen at early stages and was attributed to better ADC diffu-sion when tumors were small. In the case of Herceptin antibody variant 14–13 reported here, its affinity for Her2 is ~500-fold weaker than WT (KD= 253 versus 0.5 nM, respectively)
(Table 3). Hence, we expect 14–13 will be even more efficacious in terms of overcoming the binding site barrier (i.e. dissociating from Her2 at the tumor periphery) and penetrating deeply into large tumors.
In summary, we have shown that, given appropriate drug selection, exploiting avidity effects can be a powerful benefit in terms of improving tumor selectivity and widening the therapeutic index of ADCs under development.
Materials and methods
Cell lines
All cell lines were obtained from ATCC. SKOV3 and JIMT-1 cells were cultured in McCoy’s and DMEM media, respectively. MCF7 and Jurkat cells were cultured in RPMI 1640 media. In each case, media was supplemented with 10% fetal bovine serum (FBS).
Antibody productions and purification
cDNAs for the designed, full-size heavy and light human IgG chains were ordered from a com-mercial vendor (ThermoFisher Scientific/Life Technologies Inc., Burlington, ON; GENEART, Regensburg, Germany). The antibodies were produced by co-transfection of CHO-3E7 cells. CHO-3E7 cells in were grown to a density of 2 × 10⁶cell/mL in 150 mL of F17 medium in 1.0 L shaker flasks. The cells were transfected with 2 μg total DNA (containing 500 ng each of the heavy and light chain constructs) using PEI MAX™ (Polysciences, Inc., Warrington, PA). The cells were maintained at 37˚C for 24 h and then fed with Tryptone N1 at 1% w/v, after which they were transferred to 32˚C for 6 days. The cell culture supernatant was harvested and ana-lyzed by SDS-PAGE for expression. Antibody was captured on MabSelect Sure column (GE Healthcare Life Sciences, Mississauga, ON), followed by elution using 100 mM Citrate, 50 mM NaCl, pH 3.0 and neutralization with 1M HEPES. Desalting and PBS exchange was achieved using ZebaSpin columns (ThermoFisher Scientific, Waltham, MA).
Antibody quality control (QC)
Unconjugated and drug/dye-conjugated antibodies were assessed for purity and monomer sta-tus via HPLC-size exclusion chromatography (SEC) in a Superdex S200 column (GE Health-care Life Sciences). The mobile phase was D-PBS, 0.2 M Arginine pH 7.2 run at a flow rate of 0.25 mL/min.
Dye and drug conjugations
pHAb conjugation: Antibody variants were adjusted to 2 mg/mL in PBS. pHAb amine
reac-tive dye (Promega, Madison, WI) was dissolved in DMSO at a concentration of 5 mg/mL and then added to antibody at 10:1 ratio (pHAb:antibody), followed by incubation at 25˚C for 1 h. Excess dye was removed be ZebaSpin desalting column (ThermoFisher Scientific) equilibrated in PBS. The sample was centrifuged at 20,000×g for 10 min and supernatant containing the conjugate was retained. Dye-to-antibody ratio (DAR) was determined by OD readings at A280 and A532 nm using a NanoDrop 2000 spectrophotometer (ThermoFisher Scientific).
AlexaFluor-488 (AF488) conjugation: WT Herceptin was adjusted to 2 mg/mL in PBS.
AF488 (Invitrogen Molecular Probes, Eugene, OR) was dissolved in N,N-Dimethyl-formam-ide. The conjugation reaction, purification and DAR analysis were carried out according to the manufacturer’s specifications.
DM1 conjugation: Primary or secondary antibody variants were combined with
SMCC-DM1 (Levena Biopharma, San Diego, CA) in 1XNRC4 buffer (100 mM sodium phos-phate, 20 mM NaCl, 3 mM EDTA, pH 7.4) and incubated at 25˚C, 18 h. Polysorbate-20 was added to final concentration of 0.02% w/v. The reaction was passed through 3 successive ZebaSpin columns (ThermoFisher Scientific), equilibrated with 20 mM sodium-succinate, 0.02% polysorbate-20, pH 6.0. Trehalose was added to the final sample at 6% w/v. The drug-to-antibody ratio (DAR) was determined by measuring OD readings at A280 nm and A252 nm using NanoDrop 2000 and HPLC-SEC analysis.
MMAE and PNU conjugations: Prior to conjugation, the anti-human IgG antibody was
reduced using TCEP (Tris(2-carboxyethyl)phosphine, Sigma-Aldrich, Oakville, ON) to make reactive thiols accessible. The degree of conjugation with MMAE was controlled by adjusting the molar ratio of TCEP:antibody. The reduction mixture was incubated at 37˚C for 3 h with no agitation. To this was then added an 8-fold molar excess (relative to antibody) of MC-vc-PAB-MMAE (Levena Biopharma) bearing a maleimide thiol reactive group. This mixture was further incubated at 25˚C for 1 h. The reaction was stopped by buffer exchange into 20 mM succinate, 0.02% w/v Polysorbate-20, 6% w/v Trehalose pH 6.0. The DAR was determined by measuring A280 nm and 248 nm. Direct conjugation of antibody variants to PNU was per-formed with MA-PEG4-VC-PAB-DMAE-PNU159682 (PNU) (Levena Biopharma). Each antibody (2 mg/mL) was incubated with TCEP in buffer containing 500 mM potassium phos-phate, 200 mM sodium chloride, 20 mM EDTA, pH 7.2 at 37˚C for 2 h. PNU was then added at 10× molar excess and incubated at 25˚C for 2 h. The reaction samples were then purified via ZebaSpin columns as described above for DM1 conjugations.
Structure-based computational design of Fab variants
The Her2-bound crystal structures of Herceptin Fab [30], and its 40-fold affinity-weakened variant bH1 [15,31], (also termed Parent 1 and Parent 2, respectively) were retrieved from the Protein Data Bank (entries 1N8Z and 3BE1, respectively). These crystal structures were used as starting points for the design of additional Fab variants with Her2 binding affinities evenly distributed within a wider range of KDthat spans several orders of magnitude. Structural