Document downloaded from:
http://hdl.handle.net/10459.1/68411
The final publication is available at:
https://doi.org/10.1007/s00442-006-0379-2
Copyright
The role of below-ground competition during early stages of secondary
1
succession: the case of Scots pine (Pinus sylvestris L) seedlings in an
2
abandoned grassland
3 4 5 6Catherine Picon-Cochard1,4, Lluis Coll2,3 and Philippe Balandier2
7 8
1. INRA, Agronomy Research Unit, Grassland Ecosystem Research Team, 234 Avenue du
9
Brézet, 63039 Clermont-Ferrand Cédex, France
10
2. CEMAGREF, DFCF Research Unit, Applied Ecology of Woodlands Research Team, 24
11
Avenue des Landais, BP 50085, 63172 Aubière Cédex, France
12
3. Present address: Groupe de Recherche en Écologie Forestière Interuniversitaire (GREFi),
13
Université du Québec à Montréal, C.P. 8888, Succ. Centre-Ville, Montréal, H3C3P8, Qc,
14
Canada
15
4. Corresponding author, E-mail: picon@clermont.inra.fr, tel: +33 4 73 62 45 84, fax: +33 4 73
16
62 44 57
17 18
5. Running headline: Scots pine performance in grassland
Abstract
20
In abandoned or extensively managed grasslands the mechanisms involved in pioneer tree
21
species success are not fully explained. Resource competition among plants has been emphasised
22
as one possible mechanism to explain variation of survivorship and growth. Asymmetric
23
competition between grass vegetation and seedlings of tree species is expected because of aerial
24
dominance of the former, while below-ground competition is generally considered symmetric. In
25
this study we evaluated a number of mechanisms that may lead to successful survival and growth
26
of seedlings of a pioneer tree species (Scots pine) in a grass-dominated ecosystem. Three
year-27
old Scots pines were planted in an extensively managed grassland of the French Massif Central
28
and for two years were either maintained in bare soil or subjected to aerial and below-ground
29
interactions induced by grass vegetation. The tall grass canopy reduced light transmission by
30
77% at ground level and by 20% in the upper part of Scots pine seedlings. Grass vegetation
31
presence also significantly decreased soil volumetric water content (Hv) and soil nitrate in spring
32
and in summer. In these conditions the average tree height was reduced by 5% compared to trees
33
grown in bare soil, and plant biomass was reduced by 85%. Scots pine intrinsic water-use
34
efficiency (A/g), measured by leaf gas-exchange, increased when Hv decreased owing to a rapid
35
decline of stomatal conductance (g). This result was also confirmed by δ13C analyses of needles.
36
A summer 15N labelling of seedlings and grass vegetation confirmed the higher NO3 capture
37
capacity of grass vegetation in comparison with Scots pine seedlings. Our results provide
38
evidence that these Scots pine seedlings experienced asymmetric competition from grasses for
39
below-ground resources. Despite this, its success was linked to tolerance of resource depletion
40
induced by grass vegetation based on morphological and physiological plasticity.
41 42
Key-words: light, soil water and N, δ13
C, 15N, asymmetric competition
Introduction
44
Understanding the mechanisms driving woody plant seedlings establishment and growth is an
45
important first step in the comprehension of shifts from grass to woody plant domination during
46
secondary succession caused by cessation of agricultural activities in grassland ecosystem.
47
Natural patterns of seedling establishment (germination and emergence) in grasslands are well
48
documented and have been related to different biotic (seed bank and dormancy, predation) and
49
abiotic variables (climate change, fire regimes, livestock grazing frequency) (Van Auken 2000).
50
In many cases seedling emergence can be severely restricted in an intact grass canopy and many
51
species require gaps to establish (McConnaughay and Bazzaz 1991). Once established, survival
52
and growth are further influenced by interactions with the grass vegetation (McConnaughay and
53
Bazzaz 1991). The role of such interactions during succession is well documented (Connell and
54
Slayter 1977; Tilman 1985; Wilson 1988). However these interactions are complex: they can be
55
positive, negative or neutral, and they can change through time and space in relation to specific
56
phenologies, resource availability and climatic conditions (Balandier et al. 2005a). Negative
57
interactions are generally described by the word “competition”, even if used to describe such
58
interactions at vastly different study levels (i.e. ecosystem, community, species or individuals;
59
Grace and Tilman 1990). At the individual scale competition between plants occurs when the
60
supply of shared resource is limited, leading to a reduction of growth, survival or reproduction
61
(Begon et al. 1990). Here we used this term in accord with a functional meaning: resource
62
competition occurs when plant individuals utilize the same pool of growth-limiting resources
63
(Grime 2001).
64
One aspect of resource competition that has important consequences for individual and
65
population dynamic is the degree to which the competition represents symmetrical or
66
asymmetrical interaction (Schwinning and Weiner 1998; Freckleton and Watkinson 2001).
67
Asymmetric competition means that the negative effect of a plant i on a plant j has a
disproportionate intensity compared to the effect of the plant j on the plant i. Competition for
69
light between plants of unequal sizes can be a typical example of asymmetric competition (Rees
70
and Bergelson 1997): the tallest plant intercepts much of the radiation resulting in reduced
71
growth of the shorter plant, while shade caused by the latter has no influence on the former. In
72
contrast, competition for below-ground resource is generally considered symmetric, in that
73
resources are used equally or in proportion to the size of the root system (Weiner 1990;
74
Schwinning and Weiner 1998; Bauer et al. 2004). Thus, in asymmetric competition few resource
75
are available for the subordinate species. Consequently their success depends on the capacity to
76
acclimate to resource depletion through morphological and physiological plasticity (e.g. lower
77
tissue turnover, reduction of nutrient losses, lower stomatal conductance, etc) (Goldberg, 1990;
78
Köchy and Wilson 2000; Connolly et al. 2001; Peltzer and Köchy 2001).
79
In the case of the grassland ecosystems, it has largely been shown that grasses (which are the
80
dominant species) are highly competitive, and most have been determined to have the
81
competitive strategy (C) or a combination of two or three strategies among the C-S-R
82
(competitor, stress tolerator and ruderal, respectively) classifications of Grime (2001). Such
83
grasses are generally assumed to be more competitive for below-ground resource (Grime et al.
84
1990; Harmer 1996), but their effect above ground is less evident. For example, the influence of
85
grasses on light availability is unclear because most have thin erected leaves that may or may not
86
significantly alter light penetration to ground level. However, in fertile grasslands characterised
87
by a tall and dense grass canopy competition for light is more conspicuous (Soussana and
88
Lafarge 1998). Others have also suggested that extreme temperature fluctuations, induced by
89
grass vegetation, may have dramatic consequences for seedlings survival and growth (Ball et al.
90
1997; Ball et al. 2002). From these examples we can conclude that in many cases grasses are
91
probably unfavourable to tree establishment and growth.
Pioneer tree species are characterized as having broad physiological responses to
93
environmental variations (Bazzaz 1979; Sands and Nambiar 1984; Caldwell and Richards 1986;
94
Casper and Jackson 1997). Their success despite the presence of grasses can only be realised if
95
they survive and grow by avoiding or tolerating resource depletion. As they are smaller than
96
grasses in their younger stages, it is likely that they must face an asymmetric competition for
97
light and/or symmetric competition for soil resources. Both possibilities have yet to be truly
98
determined, as well as the underlying competition mechanisms that enable seedlings to out
99
compete grasses (Tilman 1987).
100
In the present experiment we studied Scots pine (Pinus sylvestris L.), which is able to rapidly
101
colonize open areas (Hansen et al. 2002; de Chantal et al. 2003) and during the second half of the
102
past century has naturally established in abandoned pastures of the French Massif Central (Bazin
103
et al. 1983; Prévosto et al. 2000). Our main objective was to understand why and how this
104
species (considered a pioneer tree) succeeds in grasslands during secondary succession while
105
other species like beech (Fagus sylvatica), a late successional species, does not (Coll et al. 2003;
106
Balandier et al. 2005c). Determination of these mechanisms was achieved by measurements of
107
aerial and below-ground resource acquisition and resource use efficiency of the different
108
competitors. Evaluations were based on plant functional traits (leaf gas exchange, needles bulk
109 δ13
C, SLA, N%), plant growth (height, biomass) and short-term 15N labelling experiments for N
110
mineral acquisition.
111
Specific questions addressed were:
112
• To what extent was the intensity of aerial and below-ground resource depletion driven by
113
grass vegetation?
114
• How did Scots pine seedlings respond to this resource depletion?
115
•
Is the competition between Scots pine seedlings and grass vegetation asymmetric or116
symmetric and which resource is most affected (light, water or nutrients)?
Materials and methods
118
Site and experimental plots
119
In March 2000, a grassland dominated by herbaceous species (mainly grasses) and extensively
120
grazed by sheep prior the experiment was fenced (20 x 20 m2) to prevent predation by wild
121
animals. The experiment was situated in the southern part of the ’Chaîne des Puys‘ in the French
122
Massif Central (900m a.s.l.; 45°43’ N, 2°59’ E), where the montane climate experiences oceanic
123
influences (820 mm annual rainfall, 7°C annual mean air temperature). Soil is developed on a
124
substrate of basaltic ash-fall deposits or lava blocks. It is characterised by a loamy silt texture
125
(pHwater = 6) with a rich-organic upper horizon (average thickness of 23cm). Scorias appear
126
between 40 and 60 cm deep, which constitute a well-drained layer, whereas the upper horizon
127
presents risk of rapid summer dehydration.
128
Thirty-six small plots (2 x 2 m2) were established to create four experimental treatments: (1)
129
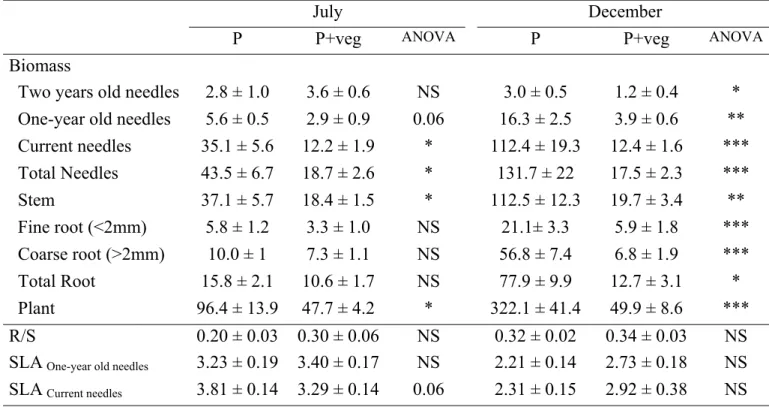
’bare soil‘ created by a glyphosate application (RoundUp, Monsanto) and thereafter maintained
130
by manual weeding (six replicates), (2) ’pine (P)’ by planting 3 year-old bare rooted Scots pine
131
(Pinus sylvestris, St-Bonnet-le-Château‘ Provenance, France) in bare soil (ten replicates), (3)
132
’pine+vegetation (P+veg)’ by planting Scots pine within the grass vegetation (ten replicates) and
133
(4) ’vegetation‘ corresponding to the natural grass vegetation of the plot (ten replicates).
134
In the two treatments with pines, five individuals were planted per replicate. The planting
135
occurred late in the season (May 2001) because the first planting (November 2000) failed due to
136
the winter dryness (only 16.4 mm in December 2000).
137
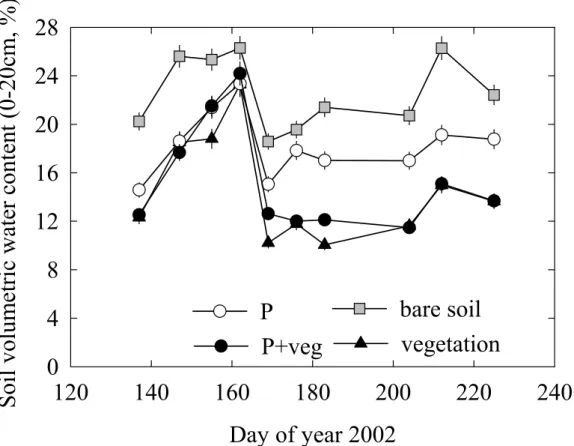
The replicates were randomly assigned to the four treatments within the site.
138
Vegetation composition and management
139
The botanical composition of the vegetation was evaluated in June 2001 in order to quantify the
140
proportion of herbaceous groups. All the species observed in a circle of 50cm diameter in the
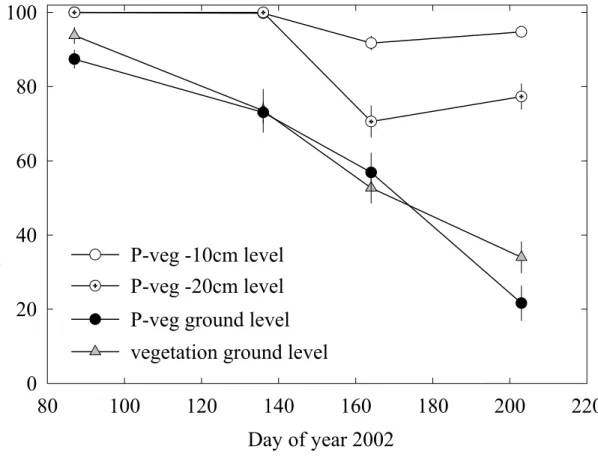
(mainly Arrhenatherum elatius, Agrostis capillaris, Festuca heterophylla, Holcus latanus,
143
Dactylis glomerata, Poa pratensis), 26% non N-fixing dicots (Achillea millefolium, Galium
144
verum, Taraxacum officinale) and 13% legumes (Vicia sativa, Trifolium pratense, Lathyrus
145
pratensis, Lotus corniculatus).
146
The herbaceous vegetation was cut with manual battery powered clippers at 6cm height in
147
November 2000 and in March 2002 in order to promote development of grasses that are
148
considered to be the most competitive vegetation group (Grime et al. 1990).
149
Resources measurements
150
Soil water content
151
In February 2001, thin-walled plastic TDR tubes (80cm length, 4cm diameter) were inserted
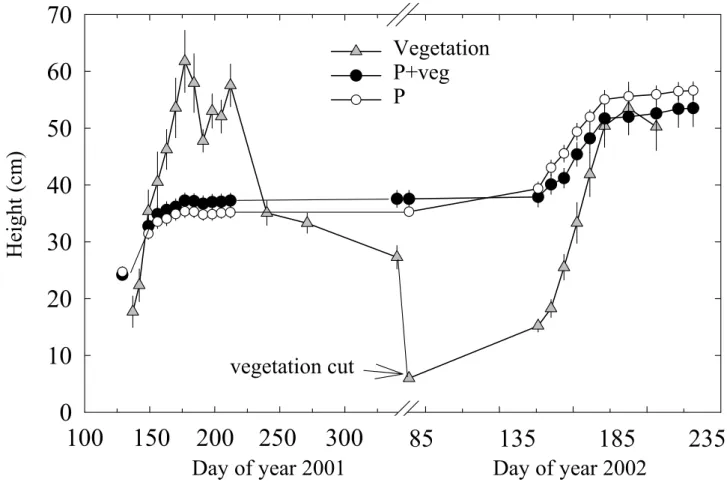
152
vertically in the soil at 20 cm away from the seedling located in the centre of the replicate. These
153
were used to measure the profile of soil volumetric water content (Hv, %) with a TDR probe
154
(Trime T3, IMKO, Ettlingen, Germany). Because the scoria layer at around 40cm depth disrupts
155
too much the Hv measurement, values were only used from the 0-20 cm layer of the soil.
156
Measurements were done weekly or every two weeks from day of year (DOY) 137 until DOY
157
225 in six to seven replicates of P, P+veg and vegetation treatments and in three replicates for
158
the bare soil treatment. For each replicate, the mean of three measurements, performed in three
159
different directions, was used for the calculation of Hv. Only the results of 2002 are shown in
160
this paper because those of 2001 showed the same pattern of variation among treatments.
161
Soil nitrate availability
162
Ion-exchange resins bags were incubated in treatment soils in 2002 and NO3- captured on the
163
resins was measured. According to Gloser et al. (2000), 6.19-6.205g of wet mixed bed resin
164
(Amberlite IRN-150, Sigma, France) were placed in nylon mesh bags (5x10cm, mesh size 50
165
µm). Three (bare soil, P treatments) and four (vegetation, P+veg) bags were buried vertically at
166
15cm depth at a distance of 20cm from the stem of the central Scots pine seedling in five
replicates of P, P+veg and vegetation treatments and in three replicates of the bare soil treatment.
168
Two sets of bags were incubated for 28 and 22 days, May to June (DOY 136-164, spring) and
169
June to July (DOY 175-197, summer), respectively. After the incubation period, all bags for a
170
given replicate were pooled and the resin washed with 50ml of de-ionised water. Inorganic N
171
was extracted by shaking the resin for five minutes in 100ml of 2M NaCl in 0.1M HCl. The
172
extract was filtered through ashless paper and frozen before determination of NO3- with a flow
173
analyser (Aquatec, France). Nitrate exchanged in the resin bag was expressed in µg g-1 resin for
174
the two periods.
175
Light
176
The photosynthetic active radiation (PAR) was measured with a sunfleck ceptometer (Decagon
177
Devices, Pullman, WA, USA) at three vertical heights, -10cm and -20cm from the apex of the
178
pine and at ground level. The transmitted PAR was calculated as the ratio of PAR measured in
179
the grass vegetation to the incident PAR above the grass vegetation. In the grass vegetation
180
treatment, measurements were only performed at the ground level. Two vertical profiles were
181
performed on either side of the Scots pine seedlings in an East-West orientation, and the mean of
182
these two measurements was used. Measurements were performed at noon (solar time) on
183
cloudless days four times during the 2002 growing season and on ten replicates for each
184
treatment. No measurements were performed in P and bare soil treatments.
185
Growth measurements and functional traits
186
Growth and biomass
187
The heights of the pines and of the grass vegetation were measured weekly during the two
188
growing seasons (April-August 2001 and 2002). For P+veg and grass vegetation treatments,
189
height of the vegetation was measured with a sward stick in a square (25 contact points in 50 x
190
50 cm) around the central pine or in the centre of the replicate.
In July and December 2002, three and five Scots pine individuals per treatment, respectively,
192
were harvested and oven-dried (60°C for 48 h) for needle, stem and root biomass determination.
193
In the laboratory, needles were sorted by age class (current-, one and two-years old). Projected
194
needle area was measured on sub sample of current- and one-year old needles with an electronic
195
planimeter (LI 3100, Li-Cor, Lincoln, NE, USA). These measurements were used to calculate
196
specific leaf area (SLA, m2 kg-1) after needles were oven-dried (60°C for 48 h) and weighed.
197
Roots were washed and separated by diameter class (fine: <2mm; coarse: >2mm). Root to shoot
198
ratio (R/S) was calculated as ratio of root to shoot dry biomass.
199
Leaf gas exchange
200
In June (DOY 170 and 177) and July (DOY 200) 2002, leaf net CO2 assimilation rate (A, µmol
201
m-2 s-1) and stomatal conductance for water vapour (gw, mmol m-2 s-1) were measured in situ in
202
natural light conditions (full light conditions, mean PAR =1527 ± 36 µmol m-2 s-1, n=28) with an
203
open gas-exchange system (LiCor6400, Lincoln, NE, USA). At noon (solar time), measurements
204
were performed on one-year old needles (11-33 cm2 projected leaf area) from a lateral shoot.
205
Values were recorded five times during the 20 to 30 minutes period following chamber closure.
206
Thus the mean of five measurements was used for each of the three individuals per treatment.
207
The same individuals were used for each date.
208
On DOY 177, leaf gas-exchange was also measured on the grass Dactylis glomerata located
209
in the replicates of the P+veg treatment. Measurements were performed with the same chamber
210
after the pine measurements. Two fully expanded leaves were chosen (2-4 cm2) in the vicinity of
211
the pine used in each of three replicates per treatment.
212
Scots pine isotopic composition of 13C (δ13C)
213
Pine needles collected in July and December 2002 were sorted by age class (current-, one- and
214
two-years old), oven-dried (48h, 60°C) and finely milled. Five to seven mg were weighed and
used for carbon isotope composition determination by mass spectrometry
216
(FISONS/ISOCHROM). Results are expressed in δ notation (equation 1), i.e. relative to the Pee
217
Dee Belemnite (PDB) standard:
218
219
where Rs and Rst are the molar fractions of 13C to 12C for the sample and the standard,
220
respectively.
221
Plant N measurements
222
At the end of June 2002 (DOY 179), one day after a 21mm rainfall, 500mL of 15NH415NO3 (10%
223
isotopic excess) were applied to a 40cm square area centred on a target pine seedling in three
224
replicates each of the P, P+veg and vegetation treatments. This amount of N corresponds to a
225
supply of 0.1875g15N m-2. Twenty-six days later (DOY 205), Scots pine seedlings were collected
226
as well as the vegetation within the labelled area. Most of the pine roots were excavated in each
227
treatment, especially for P+veg where the root system was confined in the first 20cm. However,
228
in P treatment roots expanded horizontally and into deeper layers, thus it was impossible to get
229
the whole root system. For the grass vegetation of each treatment, the roots of the first 40cm of
230
in the soil were collected and washed. All organs of the Scots pines and the grass vegetation
231
were oven-dried (48h, 60°C) and finely milled, and 5-7mg of each sample were analysed for
232
total nitrogen concentration (mass basis) and 15N by mass spectrometry (FISONS/ISOCHROM).
233
Results are expressed as isotopic excess (%), which corresponded to the difference between
234
sample 15N abundance and air 15N abundance (0.3663%). The quantity of absorbed 15N was
235
calculated at the plant level (µg 15N g-1 DW).
236 δ = ( R − ) R s st 1 x 1000 (‰) ( 1 )
Data analysis
237
With a complete random experimental design, variance analysis (ANOVA) was performed using
238
a General Linear Model (Statgraphics Plus, v 4.1, Manugistics, Inc.,USA) for all variables to test
239
treatment effects with one (vegetation presence) or two factor(s) (species, vegetation presence).
240
Means were separated from least square deviation method (LSD). Root-to-shoot ratio was
log-241
transformed before ANOVA.
242 243
Results
244 Resources availability 245 Soil water 246Seasonal fluctuations of soil volumetric water content (Hv) of the upper horizon (0-20 cm) were
247
observed with maximum and minimum values in spring and summer periods, respectively (Fig.
248
1). The bare soil treatment, without or with pine (bare soil and P, respectively), exhibited the
249
highest values of Hv from DOY 176 to 225 (P<0.05) and did not differ from each other except
250
on DOY 212. The presence of grass vegetation (P+veg and vegetation) significantly decreased
251
Hv values on three dates in summer (DOY 176, 204, 225; P<0.05) in comparison with P and
252
bare soil treatments. The two grass vegetation treatments (P+veg, vegetation) had statistically
253
similar values of Hv throughout the 2002 growing season.
254
Soil NO3 in ion exchange resin (IER)
255
The quantity of NO3- captured by IER was significantly higher (P<0.05) in the bare soil
256
treatment than in other treatments, both in spring and summer, with higher values being recorded
257
in summer (Table 1). Values measured in the P treatment were about 30% lower than in bare soil
258
but six to 13-fold higher than in the treatments with grass vegetation (P<0.05). The P+veg and
259
grass vegetation treatments had similar values of soil IER captured NO3.
260 261
Light
262
In early spring, PAR transmitted through the vegetation was higher than 85% of incident sunlight
263
even at the ground level (Fig. 2). Thereafter transmitted PAR values measured in the upper part
264
of the Scots pine canopy (-10 and -20cm below stem tip) remained above 70%, while at ground
265
level it decreased to as low as 20% in July (DOY 203). The decline of PAR availability was
266
similar in P+veg and vegetation treatments.
267 268
Scots pine and grass vegetation development
269
Shoot growth occurred from May (DOY 129-136) to June-July (DOY 177-185) for both years
270
(Fig. 3). Pines in the P and P+veg treatments exhibited the same height after growth cessation in
271
2001, but in 2002 P individuals were slightly taller (+6%, P<0.05). In 2001, grass vegetation
272
reached a height of 60cm in June and remained taller than pines through the end of the growing
273
season. This was not observed in 2002, due to grass vegetation being cut in spring and to new
274
Scots pine shoot growth. Thus, Scots pine was smaller than grass vegetation in 2001 but not in
275
2002.
276
One year after Scots pines were planted (July 2002), plant biomass was significantly (P<0.05)
277
lower by 51% in the P+veg treatment in comparison with the P treatment (Table 2). Five months
278
later, this disparity was even more pronounced (an 85% difference, P<0.001). All Scots pine
279
tissues had lower biomass in P+veg treatments than in P treatments, with the exception of roots
280
and two-year old needles in July, however the root-to-shoot ratio was unaffected. Only root
281
biomass increased from July to December in P+veg, mainly because of fine roots biomass
282
increment (almost doubled), whereas in P treatments the biomass markedly increased for all
283
plant tissues (three to five fold) during this period.
284
Specific leaf area was unaffected by the presence of grass vegetation (Table 2).
Functional traits of Scots pines and grass vegetation
287
Leaf gas-exchange
288
Positive relationships were observed among A, g and Hv, while intrinsic water-use efficiency
289
(A/g) increased in response to soil dehydration (Fig. 4). From an absolute viewpoint and for the
290
days of measurement, CO2 assimilation rate and stomatal conductance in the P+veg treatment
291
were significantly (P<0.05) lower than those measured in the P treatment, but the P+veg
292
individuals also experienced lower soil Hv. In contrast, A/g was higher in P+veg seedlings than
293
in P treatment seedlings. For similar Hv values, Dactylis glomerata exhibited higher values of A
294
and g whereas A/g was lower than in seedlings of the P+veg treatment.
295
13
C isotopic composition
296
Values of δ13
C were significantly (P<0.05) higher (less negative) in July than in December, for
297
all treatments (Table 3). One-year old needles of the P+veg seedlings had significantly (P<0.05)
298
higher (less negative) values of δ13
C in July and December than the P seedlings. For the current
299
year’s needles, P+veg pines had higher values only in July (difference of 2.06‰, P<0.01).
300
N uptake
301
Plant nitrogen concentration, plant excess 15N and 15N-mass of Scots pines were similar
302
between P+veg and P treatments (Table 4). Grass vegetation had more than ten fold greater
303
excess 15N and 15N-mass than pines. Grass vegetation grown in the P+veg treatment had 36%
304
more (P<0.001) 15N-mass than grass vegetation grown in the grass vegetation treatment, (i.e.,
305
without Scots pine seedlings).
306 307
Discussion
308
Competitive ability of grass vegetation to deplete resources
309
The effects of grass vegetation on depletion of soil resources have been well documented,
310
especially for water (Caldwell and Richards 1986; Davis et al. 1998; Collet et al. 1996; Calvet
2000; Picon-Cochard et al. 2001; Coll et al. 2003; Coll et al. 2004). In our study the grass
312
vegetation took up most of the available soil water to the detriment of pine seedlings, as
313
indicated by similar P+veg and grass vegetation Hv curves (Fig. 1). Grass vegetation also took
314
up most of the soil nitrogen as demonstrated by their substantially greater E15N values (Table 4).
315
A representative grass species (D. glomerata) from these experimental plots also maintained a
316
high CO2 assimilation rate for low values of Hv in comparison with Scots pine seedlings,
317
enabling a high growth rate under soil water depletion and possibly the ability to continue
318
foraging for new resources.
319
Certain plant traits contribute greatly to the higher competitive ability for resource
320
acquisition. For grasses, the finely branched, ‘herringbone‘ architecture enables more efficient
321
mobile nutrient acquisition than ’dichotomous‘ root systems found in species like Scots pine
322
(Fitter 2002). Grasses also exhibit high values of specific root length (SRL, ratio of root length to
323
root mass, data not shown), meaning that they are able to build longer roots for a given dry mass
324
investment. This is achieved by constructing roots of thin diameter or low tissue density (Fitter et
325
al. 1991; Lambers and Poorter 1992; Reich et al. 1998). SRL values of herbaceous species can
326
reach 700 m g-1 (Ryser 1996; Arredondo and Johnson 1999; Atkinson 2000; Craine et al. 2001;
327
Nicotra et al. 2002), while that of tree species hardly reached 10-15 m g-1 in the case of Pinus
328
sylvestris (Curt et al. 2005). This difference of SRL, coupled with differences in root
329
architecture, results in higher root density (per soil volume unit) and spatial distribution of active
330
roots in the upper horizon (Casper and Jackson 1997; Coll et al. 2003; Balandier et al. 2005b).
331
These differences may, in part, explain why grasses are more competitive for soil resources than
332
young trees. Our results for Hv, soil and plant N supported this point of view (Fig. 1, Tables 1
333
and 4) as well as those reported by other authors (Staples et al. 1999; Hangs et al. 2003; Coll et
334
al. 2004).
By contrast the effect of grass vegetation on competition for light is less clear because of their
336
thin erected leaves and their vertical canopy structure (high leaf angle, >60°, Sonohat et al.
337
2002). Thus, in comparison with shrubs or trees, grasses are often not considered to be strong
338
light competitors (Tournebise and Sinoquet 1995). However, in fertile grasslands, tall and dense
339
vegetation (high LAI) induced competition for light leading to biomass reduction (Teyssonneyre
340
et al. 2002). In our experiment the presence of grass vegetation in the vicinity of Scots pine
341
seedlings greatly reduced light availability (transmitted PAR=20%) in the lower part of the pine
342
(Fig. 2), as also reported by Köchy and Wilson (2000) and Peltzer and Köchy (2001). However,
343
the upper part of pine seedlings received more than 70% of incident PAR.
344
Growth and functional traits response of Scots pine to depletion of resources
345
Due to the pre-determined growth of Scots pine (initiation of leaf primordia the year before their
346
elongation) the effect of light competition on growth was delayed by one year (Junttila and
347
Heide 1981). This growth pattern may explain why height of pines in P+veg were unaffected in
348
the first year (2001) (Fig. 3, Table 2). De Chantal et al. (2003) showed that the ratio of height to
349
stem biomass was significantly greater in low light conditions than in high light. Similar results
350
were found in the second year of the present experiment: 0.5 and 2.6 cm g-1 in P (full light) and
351
P+veg (lower light) treatments, respectively (Fig 3 and Table 2). Both light quantity and quality
352
may affect this shift (de la Rosa et al. 1998). Stem morphology is primarily affected by lateral far
353
red-to-red ratio (Aphalo and Lehto 2001) while light quantity may mostly modify leaf
354
morphology and photosynthetic capacity. The upper part of Scots pine (about half of needle
355
surface) received more than 70% of incident PAR, i.e., 1400 µmol m-2 s-1 for sunny days
356
conditions. This value is close to the photosynthetic light saturation value for this species
357
measured in field situation (1500 µmol m-2 s-1; Luoma 1997). Moreover increase of SLA in
358
response to shade was often reported (Pearcy and Sims 1994), while in our experimental
359
conditions no statistical differences between treatments were observed (Table 2). Therefore, the
modification of the height-to-stem biomass ratios of our three year-old Scots pines seems to have
361
been more affected by lateral light quality than by light quantity.
362
Leaf gas-exchange measurements demonstrated the sensitivity of Scots pine to soil
363
dehydration (Fig. 5) as expected in drought avoiding species (Picon et al. 1996). Stomatal
364
closure enabled the species to limit water stress (Fig. 4) and possibly xylem embolism (Cochard
365
1992) but to the detriment of C gain and growth (Fig. 5, Table 2). Nevertheless stomatal
366
conductance decreased faster than CO2 assimilation rate and therefore increased intrinsic leaf
367
water-use efficiency (Fig. 5). This result is consistent with measurements of δ13C that increased
368
(less negative) in P+veg treatment (Table 3), as expected in response to reduced soil water
369
availability (Farquhar et al. 1989). Carbon isotopic composition may also be modified by soil
370
nitrogen availability because 13C discrimination occurs both during diffusion of CO2 through
371
stomata and during Rubisco carboxylation. However some authors either reported no change
372
(Hubick 1990) or a decrease of δ13
C (more negative values) in response to N fertilisation
373
(Bender and Berge 1979; Guehl et al. 1995). In the case of PAR availability, several studies have
374
reported a decrease of δ13
C (more negative) when PAR was reduced (Vora et al. 1989; Forseth et
375
al. 2001; Staples et al. 2001). However, as pointed out by Farquhar et al. (1989), interpreting the
376
influences of light on δ13
C under field conditions is confounded by the fact that plants, especially
377
those in the shaded understory, may recycle respired CO2 that has a different δ13
C signature than
378
that of the atmosphere (-8‰). As seen in the nitrogen effect on δ13
C measured in Scots pine of
379
this study, it appears that the PAR effect we measured was also opposite that expected or had no
380
effect at all.
381
No significant reduction of plant nitrogen concentration was observed between P and P+veg
382
treatments in July (Tables 2, 4) and N absorption, based in 15N excess data, was similar in July
383
for P and P+veg treatments (Table 4). The lack of difference between treatments and the slow N
pine root growth occurs at the end of the growing season (early autumn) after shoot growth
386
ceases (Livonen et al. 2001). Thus in spring and summer Scots pine must acquire soil resources
387
with few new (coarse) roots, and thereby must develop either morphological and/or
388
physiological plasticity to maintain N plant levels. This may be achieved through a number of
389
mechanisms, including the development of more fine roots to increase foraging capacity (but
390
which may be to the detriment of coarse root development; Table 2), increased activity of
391
mycorrhiza which are associated with the finest roots (Eissenstat and Yanai 1997), or increased
392
N recycling from reserves (Temperton et al. 2003). Whatever the involved mechanisms, an
393
adequate nitrogen supply was maintained as indicated by the nitrogen concentration of pine
394
needles (>1.4%) remaining above the value determined by Ingestad and Kähr (1985) to be
395
critical for growth (0.91%), and in the range for optimal growth (1.2<N%<1.5) as defined by
396
Bonneau (1988).
397 398
Is competition between Scots pine seedlings and grass vegetation asymmetric or symmetric?
399
Scots pine is considered a high-light requiring species (Keeley and Zedler 1998), while some
400
other authors have suggested dramatic reduction in root growth under low light conditions may
401
make seedlings more vulnerable to additional stresses such as drought (Rundel and Yoder 1998).
402
As such, one might hypothesise that light competition would exist between Scots pine seedlings
403
and surrounding grass vegetation. However, at the development stage of Scots pine considered in
404
this study (3-4 year-old), light was not reduced to a point that compromised pine photosynthesis
405
and growth. Thus only a slight competition for light between pines and grasses could occur.
406
Moreover a morphological acclimation, as indicated by the ratio of height-to-stem biomass
407
(higher for P+veg), suggests also that Scots pine is able to escape competition for light by
408
sensing lateral reflected far red light before the onset of competition for light (Aphalo and Lehto
409
2001).
Below-ground resources depletion induced by grass vegetation and its effects on pine growth
411
reduction was more evident (Tables 1 and 4, Fig 1). Moreover similar soil volumetric water
412
content in P+veg and grass vegetation treatments (Fig 1) indicates that Scots pine had only a
413
small effect on water availability. The same pattern was recorded for NO3 captured in IER
414
(Table 1). From these observations we can say that Scots pine had no effect on grasses and at the
415
opposite grasses had a strong effect on pine seedlings. Consequently the competition for
below-416
ground resources between Scots pine seedlings and grass vegetation was asymmetric. Few data
417
on below-ground asymmetric competition have been reported, possibly because below-ground
418
competition is not as intensively studied as aboveground effects such as light (Rajaniemi 2003).
419
Tolerance of Scots pine to water depletion by physiological plasticity (effective stomatal
420
closure) is one strategy used to overcome below-ground competition. Another strategy that we
421
did not assess here is the capture of resources at different periods of the growing season between
422
competitors owing to differential phenology (Kimberley and Richardson 2004). For example, at
423
certain times of the year, evergreen tree species, like Scots pine, have an advantage over
424
broadleaved species because they can activate during autumn and winter if favourable
425
temperatures are encountered (Ryyppö et al 1997, 1998). This is particularly true in extensively
426
managed or abandoned grassland where shading by grasses in winter time is reduced due to
427
important senescent leaves accumulation and therefore a lower canopy height.
428
429
Conclusions
430
Survival and growth of a young pioneer tree species (Scots pine) in grassland vegetation, 3 or 4
431
years after emergence, was mainly related to its capacity to tolerate marked soil resource
432
depletion, especially for water. If pines succeed in growing through the grass vegetation, the
433
grasses will then be progressively shaded by Scots pine leading to their reduction and
asymmetric competition between grass vegetation and Scots pine will be reversed. However in
435
order to better understand the full dynamics of this secondary succession process, we need more
436
information about the first stage of pioneer tree species development, i.e., emergent seedling
437
(less than one-year old) development. The driver of competition for this stage is generally
438
assumed to be light, but some authors point out that a stable soil moisture regime for radicle
439
development is most critical (Hille and den Ouden 2004). Both have yet to be tested in field
440 conditions. 441 442 Acknowledgements: 443
This project was funded by FNADT and Auvergne Region through the project: “Gestion durable
444
de la végétation dans les espaces de moyenne montagne en cours de colonisation par les
445
ligneux”. We would like to thank JM Vallée, F Landré and A Marquier for their technical
446
assistance and site maintenance, as well as the students C Alexandre and A Gutknecht. We also
447
acknowledge R Falcimagne for the meteorological logistic. Darren Sandquist is greatly
448
acknowledged for useful comments on an earlier version of the manuscript.
449 450 451
References
452
Aphalo PJ, Lehto T (2001) Effect of lateral far-red light supplementation on the growth and
453
morphology of birch seedlings and its interaction with mineral nutrition. Trees 15: 297-303
454
Arredondo JT, Johnson DA (1999) Root architecture and biomass allocation of three range
455
grasses in response to non uniform supply of nutrients and shoot defoliation. New Phytol 143:
456
373-385
457
Atkinson D (2000) Root characteristics: why and what to measure In: Smit AL, Bengough AG,
458
Van Noordwijk M, Pellerin S, Van De Geijn SC (eds) Root methods. Springer-Verlag, Berlin,
459
pp 1-32
460
Balandier P, Collet C, Miller JH, Reynolds PE, Zedaker SM (2005a) Designing forest vegetation
461
management strategies based on the mechanisms and dynamics of crop tree competition by
462
neighboring vegetation. Forestry submitted
463
Balandier P, De Montard FX, Curt T (2005b) Root competition for water between trees and
464
grass in a silvopastoral plot of ten-year-old Prunus avium. In: Batish D (ed) Agroforestry:
465
Tree-Crop Interactions Haworth Press, USA, in press
466
Balandier P, Guitton JL, Prévosto B (2005c) Forest restoration in the French Massif Central
467
mountains In: Stanturf J, Madsen P (eds) Restoration of Boreal and Temperate Forests. CRC
468
Press, pp 355-369
469
Ball MC, Egerton JJG, Leuning R, Cunningham RB, Dunne P (1997) Microclimate above grass
470
adversely affects spring growth of seedling snow gum (Eucalyptus pauciflora). Plant Cell
471
Environ 20: 155-166
472
Ball MC, Egerton JJG, Lutze JL, Gutschick VP, Cunningham RB (2002) Mechanisms of
473
competition: thermal inhibition of tree seedling growth by grass. Oecologia 133: 120-130
Bauer S, Wyszomirski T, Berger U, Hildenbrandt H, Grimm V (2004) Asymmetric competition
475
as a natural outcome of neighbour interactions among plants: results from the
field-of-476
neighbourhood modelling approach. Plant Ecol 170: 135-145
477
Bazin G, Larrère GR, de Montard FX, Lafarge M, Loiseau P (1983) Système agraire et pratiques
478
paysannes dans les Monts Dômes, INRA éditions, Paris
479
Bazzaz FA (1979) The physiological ecology of plant succession. Annu Rev Ecol Syst 10:
351-480
371
481
Begon M, Harper JL, Townsend CR (1990) Ecology: individuals, populations, and communities.
482
2nd edn. Blackwell Science Publishing, Cambridge, UK
483
Bender MM, Berge AJ (1979) Influence of N and K fertilization and growth temperature on
484
13
C/12C ratios of Timothy (Phleum pratense L.). Oecologia 44: 117-118
485
Bonneau M (1988) Le diagnostic foliaire. Rev For Fr 40: 19-28
486
Caldwell MM, Richards JH (1986) Competing root systems: morphology and models of
487
absorption. In: Givnish TJ (ed) On the economy of plant form and function. Cambridge
488
University Press, Cambridge, UK, pp 251-271
489
Calvet JC (2000) Investigating soil and atmospheric plant water stress using physiological and
490
micrometeorological data. Agric For Meteorol 103: 229-247
491
Casper BB, Jackson RB (1997) Plant competition underground. Annu Rev Ecol Syst 28: 545-570
492
Cochard H (1992) Vulnerability of several conifers to air embolism. Tree Physiol 11: 73-83
493
Coll L, Balandier P, Picon-Cochard C, Prévosto B, Curt T (2003) Competition for water between
494
beech seedlings and surrounding vegetation differing in light availability and vegetation
495
composition. Ann For Sci 60: 593-600
496
Coll L, Balandier P, Picon-Cochard C (2004) Morphological and physiological responses of
497
beech seedlings to grass-induced belowground competition. Tree Physiol 24: 45-54
Collet C, Frochot H, Guehl JM (1996) Growth dynamics and water uptake of two forest grasses
499
differing in their growth strategy and potentially competing with forest seedlings. Can J Bot
500
74: 1555-1561
501
Connell JH, Slayter RO (1977) Mechanisms of succession in natural communities and their role
502
in community stability and organization. Am Nat 111: 1119-1144
503
Connolly J, Wayne P, Bazzaz FA (2001) Interspecific competition in plants: How well do
504
current methods answer fundamental questions? Am Nat 157: 107-125
505
Craine JM, Froehle J, Tilman DG, Wedin DA, Chapin FS (2001) The relationships among root
506
and leaf traits of 76 grassland species and relative abundance along fertility and disturbance
507
gradients. Oikos 93: 274-285
508
Curt T, Coll L, Prévosto B, Balandier P, Kunstler G (2005) Plasticity in growth, biomass
509
allocation and root morphology in beech seedlings as induced by irradiance and herbaceous
510
competition. Ann For Sci: in press
511
Davis MA, Wrage KJ, Reich PB (1998) Competition between tree seedlings and herbaceous
512
vegetation: support for a theory of resource supply and demand. J Ecol 86: 652-661
513
de Chantal M, Leinonen K, Kuuluvainen T, Cescatti A (2003) Early response of Pinus sylvestris
514
and Picea abies seedlings to an experimental canopy gap in a boreal spruce forest. For Ecol
515
Manage 176: 321-336
516
de la Rosa TM, Aphalo PJ, Lehto T (1998) Effects of far-red light on the growth, mycorrhizas
517
and mineral nutrition of Scots pine seedlings. Plant Soil 201(1): 17-25
518
Eissenstat DM, Yanai RD (1997) The ecology of root lifespan. Adv Ecol Res 27: 1-60
519
Farquhar GD, Ehleringer JR, Hubick KT (1989) Carbon isotope discrimination and
520
photosynthesis. Annu Rev Plant Physiol Plant Mol Biol 40: 503-537
521
Fitter A H, Stickland T R, Harvey M L, Wilson G W (1991) Architectural analysis of plant root
522
systems 1 Architectural correlates of exploitation efficiency. New Phytol 118: 375-382
Fitter AH (2002) Characteristics and functions of root systems In: Waisel Y, Eshel A, Kafkafi U
524
(eds) Plant roots: the hidden half. Marcel Dekker Publisher, New York, pp 15-32
525
Forseth IN, Wait DA, Casper BB (2001) Shading by shrubs in a desert system reduces the
526
physiological and demographic performance of an associated herbaceous perennial. J Ecol 89:
527
670-680
528
Freckleton RP, Watkinson AR (2001) Asymmetric competition between plant species. Funct
529
Ecol 15: 615-623
530
Gloser V, Jezikova M, Lüscher A, Frehner M, Blum H, Nösberger J, Hartwig UA (2000) Soil
531
mineral nitrogen availability was unaffected by elevated atmospheric pCO2 in a four year old
532
field experiment (Swiss FACE). Plant Soil 227: 291-299
533
Goldberg DE (1990) Components of resource competition in plant communities. In: Grace JB
534
and Tilman D (eds) Perspectives on Plant Competition. Academic Press, New York, pp 27-65
535
Grace JB, Tilman D (1990) Perspectives on plant competition: some introductory remarks. In:
536
Grace JB and Tilman D (eds) Perspectives on Plant Competition. Academic Press, New York,
537
pp 1-6
538
Grime JP, Hodgson JG, Hunt R (1990) The abridged comparative plant ecology Chapman &
539
Hall, London
540
Grime JP (2001) Plant strategies, vegetation processes and ecosystems properties. John Wiley &
541
sons Ltd, Chichester, England, 2nd Edition
542
Guehl JM, Fort C, Ferhi A (1995) Differential response of leaf conductance, carbon isotope
543
discrimination and water use efficiency to nitrogen deficiency in maritime pine and
544
pedunculate oak plants. New Phytol 131: 149-157
545
Hangs RD, Knight JD, Van Rees KCJ (2003) Nitrogen accumulation by conifer seedlings and
546
competitor species from (15)nitrogen-labelled controlled-release fertilizer. Soil Sci Soc Am J
547
67: 300-308
Hansen U, Schneiderheinze J, Rank B (2002) Is the lower shade tolerance of Scots pine, relative
549
to pedunculate oak, related to the composition of photosynthetic pigments? Photosynthetica
550
40: 369-374
551
Harmer R (1996) Growth of seedling tree root-systems in competition with grasses. Asp Appl
552
Biol 44: 47-54
553
Hille M, den Ouden J (2004) Improved recruitment and early growth of Scots pine (Pinus
554
sylvestris L.) seedlings after fire and soil scarification. Eur J For Res 123: 213-218
555
Hubick KT (1990) Effects of nitrogen source and water limitation on growth, transpiration
556
efficiency and carbon isotope discrimination in peanut cultivars. Aust J Plant Physiol 17:
413-557
430
558
Ingestad T, Kär M (1985) Nutrition and growth of coniferous seedlings at varied relative
559
nitrogen addition rate. Physiol Plantarum 65: 109-116
560
Junttila O, Heide OM (1981) Shoot and needle growth in Pinus sylvestris as related to
561
temperature in northern Fennoscandia. For Sci 27: 423-430
562
Keeley JE, Zedler PH (1998) Evolution of life histories in pines. In: Ecology and biogeography
563
of Pinus, DM Richardson (Ed.), Cambridge University Press, Cambridge, UK, pp 219-250
564
Kimberley MO, Richardson B (2004) Importance of seasonal growth patterns in modelling
565
interactions between radiata pine and some common weed species. Can J For Res 34: 184-194
566
Köchy M, Wilson SD (2000) Competitive effects of shrubs and grasses in prairie Oikos 91:
385-567
395
568
Lambers H, Poorter H (1992) Inherent variation in growth rate between higher plants : a search
569
for physiological causes and ecological consequences. Adv Ecol Res 23: 189-261
570
Livonen S, Rikala R, Vapaavuori E (2001) Seasonal root growth of Scots pine seedlings in
571
relation to shoot phenology, carbohydrate status, and nutrient supply. Can J For Res 31:
1569-572
1578
Luoma S (1997) Geographical pattern in photosynthetic light response of Pinus sylvetsris in
574
Europe. Funct Ecol 11: 273-281
575
McConnaughay KDM, Bazzaz FA (1991) Is physical space a soil resource? Ecology 72(1):
94-576
103
577
Nicotra AB, Babicka N, Westoby M (2002) Seedling root anatomy and morphology: an
578
examination of ecological differentiation with rainfall using phylogenetically independent
579
contrasts. Oecologia 130: 136-145
580
Pearcy RW, Sims DA (1994) Photosynthetic acclimation to changing light environments: scaling
581
from the leaf to the whole plant. In: Exploitation of environmental heterogeneity by plants,
582
MM Caldwell and RW Pearcy (eds), Academic Press Inc., San Diego, California, pp 145-174
583
Peltzer DA, Köchy M (2001) Competitive effects of grasses and woody plants in mixed-grass
584
prairie. J Ecol 89: 519-527
585
Picon C, Guehl JM, Ferhi A (1996) Leaf gas-exchange and carbon isotope composition
586
responses to drought in a drought-avoiding (Pinus pinaster) and a drought tolerant (Quercus
587
petraea) species under present and elevated atmospheric CO2 concentrations. Plant Cell
588
Environ 19: 182-190
589
Picon-Cochard C, Nsourou-Obame A, Collet C, Guehl JM, Ferhi A (2001) Competition for
590
water between walnut seedlings (Juglans regia) and rye grass (Lolium perenne) assessed by
591
carbon isotope discrimination and δ18
O enrichment. Tree Physiol 21: 183-191
592
Prévosto B, Curt T, Gueugnot J, Coquillard P (2000) Modeling mid-elevation Scots pine growth
593
on a volcanic substrate. For Ecol Manage 131: 223-237
594
Rajaniemi TK (2003) Evidence for size asymmetry of belowground competition. Basic Appl
595
Ecol 4: 239-247
596
Rees M, Bergelson J (1997) Asymmetric light competition and founder control in plant
597
communities. J Theor Biol 184: 353-358
Reich PB, Walters MB, Tjoelker MG, Vanderklein D, Buschena C (1998) Photosynthesis and
599
respiration rates depend on leaf and root morphology and nitrogen concentration in nine
600
boreal tree species differing in relative growth rate. Funct Ecol 12: 395-405
601
Rundel PW, Yoder BJ (1998) Ecophysiology of Pinus. In: Ecology and biogeography of Pinus,
602
DM Richardson (Ed.), Cambridge University Press, Cambridge, UK, pp 296-323
603
Ryser P (1996) The importance of tissue density for growth and life span of leaves and roots: a
604
comparison of five ecologically contrasting grasses. Funct Ecol 10: 717-723
605
Ryyppö A, Sutinen S, Mäenpää M, Vapaavuori E, Repo T (1997) Frost damage and recovery of
606
Scots pine seedlings at the end of the growing season. Can J For Res 27: 1376-1382
607
Ryyppö A, Iivonen S, Rikala R, Sutinen ML, Vapaavuori E (1998) Responses of Scots pine
608
seedling to low root zone temperature in spring. Physiol Plantarum 102: 503-512
609
Sands R, Nambiar EKS (1984) Water relations of Pinus radiata in competition with weeds. Can J
610
For Res 14: 233-237
611
Schwinning S, Weiner J (1998) Mechanisms determining the degree of size asymmetry in
612
competition among plants. Oecologia 113: 447-455
613
Sonohat G, Sinoquet H, Varlet-Grancher C, Rakocevic M, Jacquet A, Simon JC, Adam B (2002)
614
Leaf dispersion and light partitioning in three-dimensionally digitized tall fescue-white clover
615
mixtures. Plant Cell Environ 25: 529-538
616
Soussana JF, Lafarge M (1998) Competition for resources between neighbouring species and
617
patch scale vegetation dynamics in temperate grasslands. Ann Zoo 47: 371-382
618
Staples TE, Van Rees KCJ, van Kessel C (1999) Nitrogen competition using 15N between early
619
successional plants and planted white spruce seedlings. Can J For Res 29: 1282-1289
620
Staples TE, Van Rees KCJ, Knight JD, van Kessel C (2001) Vegetation management and site
621
preparation effects on C-13 isotopic composition in planted white spruce. Can J For Res 31:
622
1093-1097
Temperton VM, Millard P, Jarvis PG (2003) Does elevated atmospheric carbon dioxide affect
624
internal nitrogen allocation in the temperate trees Alnus glutinosa and Pinus sylvestris? Global
625
Change Biol 9: 286-294
626
Teyssonneyre F, Picon-Cochard C, Soussana JF (2002) How can we predict the effects of
627
elevated CO2 on the balance between perennial C3 grass species competing for light ? New
628
Phytol 154: 53-64
629
Tilman D (1985) The resource-ratio hypothesis of plant succession. Am Nat 125: 827-852
630
Tilman D (1987) On the meaning of competition and the mechanisms of competitive superiority.
631
Funct Ecol 1: 304-315
632
Tournebise R, Sinoquet H (1995) Light interception and partitioning in a shrub/grass mixture.
633
Agric For Meteorol 72: 277-294
634
Van Auken OW (2000) Shrub invasions of North American semiarid grasslands. Ann Rev Ecol
635
Syst 31:197-215
636
Vora AB, Patel JA, Punjani BL (1989) Comparative photosynthesis and levels of metabolites in
637
leaves and chloroplasts of sun-adapted and shade-adapted plants of Achyranthes aspera Lin. J
638
Environ Biol 10: 159-164
639
Weiner J (1990) Asymmetric competition in plant populations. Tree 5: 360-364
640
Wilson JB (1988) Shoot competition and root competition. J App Ecol. 25: 279-296
Table 1 : Soil nitrate captured by ion exchange resin bags (µg NO3- g-1 resin) incubated (0-15cm)
642
in bare soil, soil with young Scots pine grown without vegetation (P) and with grass vegetation
643
(P+veg) and grass vegetation conditions in spring (DOY 136-164) and summer (DOY 175-197)
644
2002.
645 646
Bare soil P P+veg Vegetation
Spring 551.1 ± 66.0 a 378.4 ± 58.8 b 37.5 ± 25.4 c 28.9 ± 12.6 c Summer 866.2 ± 19.8 a 257.0 ± 35.4 b 32.1 ± 8.4 c 39.9 ± 11.5 c
Values are means ± SE. n=5 for P, P+veg and vegetation; n=3 for bare soil. For a given period mean
647
values not sharing the common letters are significantly different (LSD separation, P≤0.05).
648 649 650 651 652 653 654 655 656 657 658 659 660 661 662 663 664 665
Table 2: Biomass (g) of Scots pine needles age classes, stem, root (fine and coarse) and total
666
plant. Also shown are root shoot ratios (R/S) and specific leaf areas (SLA, m2 kg-1) of one
year-667
old and current needles. Comparisons are for Scots pine seedlings grown without vegetation (P)
668
and with grass vegetation (P+veg) in July and December 2002.
669 670
July December
P P+veg ANOVA P P+veg ANOVA
Biomass
Two years old needles 2.8 ± 1.0 3.6 ± 0.6 NS 3.0 ± 0.5 1.2 ± 0.4 * One-year old needles 5.6 ± 0.5 2.9 ± 0.9 0.06 16.3 ± 2.5 3.9 ± 0.6 ** Current needles 35.1 ± 5.6 12.2 ± 1.9 * 112.4 ± 19.3 12.4 ± 1.6 *** Total Needles 43.5 ± 6.7 18.7 ± 2.6 * 131.7 ± 22 17.5 ± 2.3 *** Stem 37.1 ± 5.7 18.4 ± 1.5 * 112.5 ± 12.3 19.7 ± 3.4 ** Fine root (<2mm) 5.8 ± 1.2 3.3 ± 1.0 NS 21.1± 3.3 5.9 ± 1.8 *** Coarse root (>2mm) 10.0 ± 1 7.3 ± 1.1 NS 56.8 ± 7.4 6.8 ± 1.9 *** Total Root 15.8 ± 2.1 10.6 ± 1.7 NS 77.9 ± 9.9 12.7 ± 3.1 * Plant 96.4 ± 13.9 47.7 ± 4.2 * 322.1 ± 41.4 49.9 ± 8.6 *** R/S 0.20 ± 0.03 0.30 ± 0.06 NS 0.32 ± 0.02 0.34 ± 0.03 NS
SLAOne-year old needles 3.23 ± 0.19 3.40 ± 0.17 NS 2.21 ± 0.14 2.73 ± 0.18 NS SLACurrent needles 3.81 ± 0.14 3.29 ± 0.14 0.06 2.31 ± 0.15 2.92 ± 0.38 NS Values are means ± SE. n=3 and 5 in July and December, respectively. (ANOVA, NS: P>0.05, *: P≤0.05,
671 **: P≤0.01, ***: P≤0.001). 672 673 674 675 676 677 678 679 680 681
Table 3: Carbon isotope ratios (δ13
C, ‰) of three age classes of needles of young Scots pine
683
grown without vegetation (P) and with grass vegetation (P+veg) in July and December 2002.
684 685
July December
P P+veg ANOVA P P+veg ANOVA
Two years old needles -26.70 ± 0.21 -26.55 ± 0.11 NS -28.08 ± 0.27 -27.67 ± 0.27 NS One-year old needles -26.18 ± 0.36 -24.72 ± 0.2 * -27.98 ± 0.28 -26.74 ± 0.45 * Current needles -26.84 ± 0.03 -24.75 ± 0.34 ** -27.94 ± 0.36 -27.06 ± 0.71 NS Values are means ± SE. n=3 and 5 in July and December, respectively. (ANOVA, NS: P>0.05, *: P≤0.05,
686 **: P≤0.01). 687 688 689 690 691 692 693 694 695 696 697 698 699 700 701 702 703 704
Table 4: Nitrogen concentration (N, %), 15N isotopic excess (E15N, %) and 15N mass (µg 15N g-1
706
DW) calculated (1) at the plant level (needles, stem and roots) for Scots pine seedlings grown
707
without vegetation (P) and with grass vegetation (P+veg) and (2) at the labelled plot level
708
(0.16m2) for the surrounding grass vegetation including leaf blades, sheaths and roots. The plots
709
were labelled with 15NH415NO3 (15N excess = 10%) in June 2002 (DOY 179) and harvested 26
710
days later.
711 712
species P P+veg vegetation ANOVA
N (%) Scots pine 1.04 ± 0.04 b 0.90 ± 0.07 b -*** vegetation - 1.43 ± 0.06 a 1.25 ± 0.05 a E15N (%) Scots pine 0.074 ± 0.029 b 0.043 ± 0.007 b -*** vegetation - 0.756 ± 0.034 a 0.619 ± 0.093 a 15
N mass Scots pine 7.73 ± 3.40 c 3.63 ± 0.61 c
-*** (µg g-1DW) vegetation - 102.82 ± 4.32 a 75.86 ± 11.31 b
Values are means ± SE. n=3. For a given parameter mean values not sharing the common letters are
713
significantly different. (LSD separation and ANOVA, ***: P≤ 0.001).
714 715
Figure legends
716
Figure 1:
717
Soil volumetric water content (0-20cm) measured in bare soil, in soil with young Scots pine
718
grown without vegetation (P) and with grass vegetation (P+veg) and in soil with grass vegetation
719
only during the 2002 growing season. Values are means ± SE, n=6 or 7 for P+vegetation,
720
vegetation and P and n=3 for bare soil.
721 722
Figure 2:
723
Percentage of transmitted photosynthetic active radiation (PAR) measured as ratio of incident
724
PAR above canopy to three height levels from the apical part of the pine to ground level (P+veg)
725
and at ground level for grass vegetation plots during the 2002 growing season. Values are means
726 ± SE. n=10. 727 728 Figure 3: 729
Height (cm) of Scots pine seedlings grown without vegetation (P) and with grass vegetation
730
(P+veg) and of grass vegetation only of the P+veg treatment during the 2002 growing season.
731
Values are means ± SE. n=10. Arrow corresponds to the annual cut of the grass vegetation in
732 early spring. 733 734 Figure 4: 735
Relationships between leaf carbon dioxide assimilation rate (µmol m-2 s-1), leaf conductance
736
(mmol m-2 s-1), leaf intrinsic water use efficiency (mmol mol-1) and soil volumetric water content
737
at 0-20cm (%) in Scots pine seedlings grown without vegetation (P) and with grass vegetation
738
(P+veg) and for one of the most abundant grass species of the plot (Dactylis glomerata).
739
Measurements were performed on DOY 170, 177 and 200 in year 2002 for Scots pine and on
DOY 177 for grass species. Each symbol corresponds to one replicate, with three replicates per
741
treatment.
Figure 1 743 744 745 746 747 748 749 750 751 752 753
Day of year 2002
120
140
160
180
200
220
240
0
4
8
12
16
20
24
28
Soil volum
etric wate
r c
onten
t (0-20c
m, %)
vegetation
P
P+veg
bare soil
Figure 2 755 756 757 758 759 760 761 762 763 764 765
Day of year 2002
80
100
120
140
160
180
200
220
Percentage of transm
itted PAR (%)
0
20
40
60
80
100
vegetation ground level
P-veg -10cm level
P-veg -20cm level
P-veg ground level
Figure 3 : 766 767 768 769 770 771 772 773 774 775
2002
Day of year 2001
100
150
200
250
300
440
480
520
560
600
Height (cm
)
0
10
20
30
40
50
60
70
Day of year 2002
vegetation cut
Vegetation
P+veg
P
85
135
185
235
100
150
200
250
300
Figure 4 : 777 778 Leaf conductance (g H20 , mm ol m -2 s -1 ) 0 100 200 300 400 500
Soil volumetric water content (0-20cm, %) 4 6 8 10 12 14 16 18 20 22 24 L e af instrinsic w ater-use effic ienc y (A /g H20 , mmol mol -1 ) 0.00 0.05 0.10 0.15 Leaf CO 2 ass imilation rate (µ mol m -2 s -1 ) 0 4 8 12 16 20 24 28 P P+veg D. glomerata