Amygdala circuits underlying valence-specific behaviors by
Joshua Kim
B.S., University of Washington (2010)
Submitted to the Department of Biology in partial fulfillment of requirements for the degree of Doctor of Philosophy
Massachusetts Institute of Technology June 2018
2018 Massachusetts Institute of Technology. All rights reserved.
)
Signature redacted
Joshua Kim, AuthorSignature redacted
Susumu Tonegawa, SupervisorACCEPTED BY:
Signature redacted
Amy E. Keating, Co-Chair, Biology Graduate Committee MASSACHUSETTS INSTITUTE OF TECHNOLOGY
MAY 3
12018
LIBRARIES
AUTHOR SIGNATURE: CERTIFIED BY: 1Im
Amygdala circuits underlying valence-specific behaviors by Joshua Kim
Submitted to the Department of Biology on June, 2018 in partial fulfillment of the requirements for the degree of Doctor of Philosophy in Neurobiology
Abstract
Threatening and rewarding stimuli evoke a set of distinct stereotyped behaviors, which can be categorized as negative and positive valence-related behaviors, respectively. The stereotypic nature of negative and positive valence-related behaviors suggests that threatening and rewarding stimuli engage evolutionarily predetermined neural circuits in the brain. The amygdala is an important mammalian brain region that is activated by negative and positive stimuli and mediates negative and positive valence-related behaviors. The current prevailing circuit model of the amygdala mainly considers negative behaviors and only recently has cell-type specific models have been proposed. Hence, the substrates, genetically distinct neuronal populations, for negative and positive behaviors are not known. The work presented here describes a genetically-defined amygdala circuit model for negative and positive behaviors. Development of a genetic-based circuit model of the amygdala revealed anatomical and genetic circuit motifs that underlie that amygdala circuits that mediate valence-specific behaviors.
Thesis Supervisor: Susumu Tonegawa Title: Professor of Biology
ACKNOWLEDGEMENTS
This dissertation would not be possible without previous scientific mentors-Alexander (Sasha) Kauffman, Robert A. Steiner, Don K. Clifton, Toshihiro Akaike. Technical training, assistance, contributions, feedback by colleagues-Roger L. Redondo, Xu Liu, Steve Ramirez, Michele Pignatelli, Sangyu Xu, Shruti Muralidhar, Christopher J. MacDonald, Xiangyu Zhang, Autumn L. Arons, Sarah A. LeBlanc, Lilian M. Smith. Thesis committee members that helped guide and assess this work-Troy Littleton, Wendy V. Gilbert, Frank Solomon, Todd E. Anthony. Full support and guidance by my doctorate mentor-Susumu Tonegawa.
Specific Contributions to this Works
Michele Pignatelli: Perfomred the patch clamp recordings for the BLA Sangyu Xu: Performed the operant behaviors for the BLA
Shruti Muralidhar: Performed the patch clamp recordings for the CeA
Xiangyu Zhang: Contributed to performing in situ hybridization and behavioral work for the CeA Sarah A. LeBlanc: Helped genotype mice and organize colony for CeA study
FUNDING SOURCES
NIH Pre-Doctoral Training Grant T32GM007287. RIKEN Brain Science Institute.
Table of Contents
PREFACE. PHILOSOPHICAL CONSIDERATIONS 8
1. Genetic ontology of the study of neural circuits and behavior
1I. Epistemology of the study of neural circuits and behavior
Chapter 1. CURRENT PREVAILING AMYGDALA MODEL 11
1. Introduction
11. Current prevailing amygdala circuit model
Ill. Problems with the prevailing amygdala circuit model IV. Aims of this work
Chapter 2. GENETICALLY-DEFINED AMYDALA CIRCUIT MODEL 14
1. Basolateral amygdala
A. Activity-dependent transcriptional profiling and screening
B. Characterization of Rpso2 and Ppp 1r1b+ BLA neurons
C. Antagonism between Rpso2+ and Ppp1r1b+ BLA neurons D. Rpso2* and Ppp1r1b+ BLA neuron projections
11. Central amygdala
A. Identification of genetically distinct CeA neurons
B. Characterization of genetically distinct CeA neurons
C. CeA projections to the midbrain
D. Cell-type specific BLA-to-CeA connectivity
E. Striatal marker expression in the CeA
I1. Summary of Findings
A. Summary of behavioral and anatomical findings
B. BLA-to-CeA amygdala circuit model for valence-specific behaviors
Chapter 3. DISCUSSION 38
1. Basolateral amygdala
11. Central amygdala
I1. Genetically-defined amygdala circuit model
Chapter 4. CIRCUIT THEMES 48
1. Spatial segregation of valence-specific behaviors
11. Antagonism of valence-specific neurons IlIl. Genetic circuit motif
REFERENCE 54
FIGURES 63
PREFACE. PHILOSOPHICAL CONSIDERATIONS
Modern study of the brain mainly originates from two distinct schools of thought, the psychological tradition and the modern biological or neurobiological tradition. In recent days, these two distinct philosophical frameworks for understanding the brain has been hybridized into a field called, neuroscience. Hence, in order to avoid confusion and provide clarity, it is important to distinguish between these two ways of understanding and to articulate the philosophical framework underlying the work presented here.
The psychological tradition posits the mind, the mind being of the subjective and metaphysical in nature. For instance, psychology deals with metaphysical concepts such as emotions, memory, attention, awareness, thought, cognition, consciousness, to name a few. In contrast, the modern biological approach focuses on the objective and material. For instance, modern biology attempts to understand physically definable processes based on a
mechanistic description of matter, interaction, localization, and spatiotemporal action.
These two philosophical approaches in brain research are not absolutely independent nor is the validity of such a descriptive framework or superiority of a particular philosophy being necessarily argued for. However, the clear distinction between metaphysical versus material statements should be noted in regards to scientific research on brain and behavior. Thus, the work presented here, although in a topic area highly pursued in the field of
psychology, will solely deal with materialistic/biological claims and, though inevitable in terminology, does not take seriously any metaphysical/psychological claims or implications.
I. Genetic ontology of the study of neural circuits and behavior
For this work, the functional units for the study of neural circuits and behavior are genetically-defined neuronal populations. Genetically-defined neuronal populations are
populations of neurons defined by at least one genetic marker within a brain region. Pertaining to this work, the nomenclature will be structured by abbreviation of the brain region followed by the abbreviation of the gene in italics. BLA Rpso2O refers to Rpso2 (gene known as R-spondin 2) expressing neurons in the basolateral amygdala (brain region, BLA). A single genetically-defined neuronal population generally consists of anywhere from 101-106 neurons in the brain
of a mouse.
In regards to ontological basis of function (behavior), psychological or ethological terminology will be adapted for their operational uses, but not their metaphysical implications. Listed are terms and their definitions.
valence: pertaining to negative and positive valence
negative valence-related: a category of behaviors that include defensive behavior, and avoidance.
positive valence-related: a category of behaviors that include self-stimulation, eating, drinking, approach.
threatening/negative stimuli: stimuli that evoke negative valence-relate behaviors rewarding/positive stimuli: stimuli that evoke positive valence-relate behaviors
II. Epistemology of the study of neural circuits and behavior
What can this genetic-based ontology of neuronal populations tell us about function (behavior)? This ontological framework does not presume that all genetically-defined neuronal populations will necessarily have homogenous function(s) and or neuroanatomical structure(s) nor does it suggest that there must be a genetically defined neuronal population for an
arbitrarily definable function (i.e. a unique genetically defined population of neurons that responds to Jennifer Aniston). Rather, this ontological framework presumes or hypothesizes that genetically-defined neuronal populations may have homogenous function(s). In other
words, a genetically-defined neuronal population can serve as the limiting feature to reflect the basic fundamental units and hierarchical organization (categorization) of function (behavior).
Chapter 1. CURRENT PREVAILING AMYGDALA MODEL
1. Introduction
The amygdala is an almond-shaped mammalian brain region that consists of a several divisions-basolateral amygdala (BLA), central amygdala (CeA), lateral amygdala (LA), medial amygdala (MeA), basomedial amygdala (BMA), cortical amygdala (CoA), interacted cells (ITC)1 3
. Early lesion studies have implicated the amygdala in valence-related behaviors and have attempted to attribute distinct roles to distinct amygdala regions 4
-6. Although early lesions studies have alluded to a causal role of the amygdala in positive valence-related behaviors, the vast majority of studies have focused on negative valence-related behaviors and a circuit model for negative-valence related behaviors was developed.
II. Current prevailing amygdala circuit model
The circuit model of the amygdala has been developed mainly around the behavioral paradigms known as tone fear conditioning (TFC) and contextual fear conditioning (CFC). In TFC paradigms in mice, the pairing of a conditioned stimulus (CS), a neutral tone, with a negative unconditioned stimuli (US), footshocks, leads to the association of the CS with the unconditioned response (UR), the UR being defensive behavior, which is characterized a mouse in a stereotypic immobile freezing state. Learning is reflected by the conditioned response (CR), which is measured by freezing levels in response to presentation of the tone
CS in a neutral context7,8.
The prevailing amygdala circuit model for TFC proposes that CS and US converge onto the principle cells of the lateral amygdala (LA). The convergence of CS and US onto LA
neurons. As a result, subsequent CS presentation leads to the activation of LA neurons and ultimately leads to the CR. LA neurons are thought to ultimately reach effectors of defensive behavior in the periaqueductal gray (PAG) via the basolateral amygdala (BLA) and central amygdala (CeA)7,8.
CFC is similar to TFC except that CFC involves presentation of footshocks without any pairing to a tone in a distinct context. The context serves as a CS. The CR is tested in the context where the footshocks occurred. In the amygdala circuit model for CFC, the CS (context) and US converges onto the BLA. BLA neurons are thought to reach the PAG via the CeA79.
This amygdala circuit model describes the circuit underlying CS- and US-induced defensive behavior. Discussions and characterizations of this model in previous works do not describe well or articulate the circuit distinctions between CS- and US-induced defensive behaviors 7-10. However, regardless of the distinctions between CS- and US-induced defensive behaviors, it is believed that such structure, the LA, BLA, CeA, and PAG and the circuit through these structures mediate defensive behaviors.
Recently, a working circuit model for negative and positive behaviors in the amygdala was proposed1 12. This model utilizes a projection-based definition for populations in the BLA.
This model proposes that CeA-projecting and nucleus accumbens (NAc)-projecting BLA neurons are mediators of negative and positive behaviors, respectively. This model is highly consistent with the current prevailing amygdala circuit model and simply builds off an early observation that NAc-projecting BLA neurons mediate positive behaviors78,
,13
.
I1. Problems with the prevailing amygdala circuit model
Structurally, the circuit model of the amygdala suggest circuit that from the LA to BLA to CeA to the PAG or LA directly to CeA to PAG mediate defensive behavior7-9. However, early
findings on the anatomical connectivity between the LA, BLA, CeA do not fully support such model of defensive behavior. For instance, early lesions studies have implicated the anterior BLA, but less so, the posterior BLA in defensive behaviors4. Anatomically, the anterior BLA
does not directly project to the CeA subdivisions shown to project to the PAG; rather, the posterior BLA mainly projects to the CeA subdivisions shown to project to the PAG 4 5. In
addition, the LA to BLA or LA to CeA connection has not been convincingly shown to exist; rather the LA appears to mainly send projections to the basomedial amygdala (BMA) and amygdala striatal transition zone (Astr)1' 16. Hence, such anatomical evidence does not fully
falsify such circuit model. Rather, such anatomical inconsistencies, previous to the work presented here, suggested at least some level of structural incompleteness of the amygdala circuit model.
Functionally, the role of LA, BLA, and CeA in defensive behaviors in TFC and CFC
paradigms and the contributing factors of such structures has been controversial4 .,1 2 1- . Many
of the contradictory studies utilized lesions or pharmacological manipulation, which suffer from specificity. Thus, it is not unexpected that such controversies should arise. To solve such technical limitations of earlier perturbation methods, a genetic-based approach offers a method to provide more specificity and clarity on the role of distinct amygdala populations in defensive behaviors2223, . Only recently has such genetic-based approaches been
implemented, and as a consequence, has brought more clarity to the amygdala circuit (further discussion in Chapter 3)24. Thus, in order to better develop an amygdala circuit model for
negative and positive behaviors, it is pertinent to implement a genetically-defined framework.
IV. Aims of this work
1. Identifying and classifying genetically distinct populations in the amygdala
2. Phenotyping genetically distinct populations in regard to valence-related behaviors 3. Deriving a circuit model for negative and positive valence-related behaviors
4. Examine organizing principles underlying distinct amygdala circuits
The main findings of these works have been published and can be read in manuscript form, (Kim et al, 2016) (Kim, Zhang, et al, 2017)25,26. In addition to the content based on these two
published works, further preliminary works will be described and discussed and a more speculative model will be proposed and broader topics will be discussed.
Chapter 2. GENETICALLY-DEFINED AMYDALA CIRCUIT MODEL
1. Basolateral amygdala
A. Activity-dependent transcriptional profiling and screening of BLA neurons The BLA is a cortical-like brain structure consisting of two-types of nonlaminarly organized excitatory pyramidal, magnocellular and parvocellular neurons segregated in the anterior and posterior BLA (aBLA, pBLA), intermingled with populations of genetically-defined
interneurons,3,27
-31. Two cytoarchitecturally distinct regions have been previously identified, the
magnocellular and parvocellular cells1,27. The magnocellular and parvocellular cells are
spatially segregated, corresponding to the anterior and posterior BLA (aBLA, pBLA)1.
Previous correlative studies have demonstrated that the BLA is activated by negative and positive stimuli, and perturbation studies have demonstrated the necessary role of the BLA
in negative and positive behaviors 4
-,13
,32
-3 6. In more recent studies utilizing optogenetic and
genetic approaches, it has been showed that activation of BLA neurons result in the expression of negative and positive behaviors11 13 32
that BLA may be a key site for the regulation of negative and positive behaviors. Yet, despite the critical role of the BLA in valence-related behaviors, it is not established whether the BLA pyramidal neurons that contributes to negative and positive behaviors (negative neurons and positive neurons) are structurally distinct, let alone, genetically distinguishable.
Recent studies demonstrated that BLA neurons, which express the activity-dependent gene, c-Fos, during a negative or positive stimulus, were capable of driving a behavioral response consistent with the valence of the experience3 2. Therefore, we reasoned that by
utilizing a c-Fos-based genetic expression system, molecular profiles of the putative negative and positive neurons within the BLA can be obtained. Activity-dependent molecular profiles of BLA neurons may reveal genetic markers unique to negative and positive neurons.
Genetics-based RNA profiling strategies in mammalian models have involved ectopically expressing epitope-tagged RNA associated proteins or exploiting molecular modifications of RNA-associated substrate 37-40. In order to obtain transcriptional profiles, we
implemented a strategy involving ectopically expressing an epitope-tagged RNA binding protein, poly(A) binding protein with a c-terminus FLAG tag (PABP-FLAG) 41. Two AAV
9
constructs were used, one containing the tetracyclin-based transcription factor, tTA, under the control of the activity-dependent promoter of c-Fos (AAV9-c-Fos-tTA), and the other containing
Pabp-flag under the control of the tetracycline response element TRE (AAV-TRE-Pabp-flag).
Activation of the c-Fos promoter drives the expression of tTA. In the absence of doxycycline (Dox), tTA binds TRE to induce the expression of PABP-FLAG. PABP-FLAG competes with endogenous PABP and bind the polyA tails of mRNA, which then can be isolated via
immunoprecipiation using an anti-flag antibody and A/G coated magnetic beads (Figure 1a).
The putative negative and positive neurons were targeted by exposing male mice to footshocks and a female mouse, respectively. AAV9-c-Fos-tTA and AAV-TRE-Pabp-flag were
introduced into the BLA in mice kept on a Dox diet. Once placed off a Dox diet for 2 days, mice were exposed to footshocks or female mouse, then immediately placed back on a Dox diet for 2 days prior to sacrifice. A similar number of BLA neurons were FLAG+ in the shock and female groups, but were greater than mice that were kept in their home cages or kept on a Dox diet (Figure 1b,c,d,e,g-j). In contrast, a greater number of BLA neurons were FLAG+ in the mice that underwent kainic acid-induced seizures compare to the shock or female group (Figure
1 b,f-j). This affirms the activity-dependency of the genetic system. Therefore, RNA
immunoprecipitation using antibodies against FLAG was performed from the shock and female group. Isolated RNA was reverse-transcribed to cDNA and underwent microarray analysis using Affymetric Mouse 430A chip. After RMA or MAS5 normalization (see Methods),
differential gene expression profiles were compared between the shock and female group and were used as the basis of the screen for identifying genetic markers for the putative negative and positive neurons of the BLA (Figure 1 k, Figure 8).
Based on previous observations32 34, we hypothesized that the putative negative and positive BLA neurons would be non-overlapping; therefore, we sought to select from our potential list of candidate genetic markers, a single gene candidate, one for each, putative negative and positive neurons. As a corollary, this posits that each of the gene markers would label a subpopulation (<100%) of BLA principle neurons. First, independent of statistical significance, hundreds of genes that were the most enriched in the shock and female groups
were individually screened on Allen Mouse Brain Atlas42. 37 genes were selected for single
label fluorescent in situ hybridization, of which, 16 probes yielded a quantifiable signals in the -1.0 to -1.6 anterior-posterior (AP) plane of the BLA (Figure 9). Quantification of gene
expression in the BLA revealed that the majority of candidate genes were expressed in a virtually all BLA neurons (Figure 11, Figure 9). Several genes were expressed in the majority of
BLA neurons, while, only one gene, Ppplrlb, labeled less than 50% of neurons. Rpso2was very regionally specific for labelling the BLA as well as had very low variability as a genetic marker. Therefore,Rspondin-2 (Rspo2) and Protein phosphatase 1 regulatory subunit 1 B (Ppp1r1b) (encodes for DARPP-3243) were selected for further characterization.
B. Characterization of Rpso2+ and Ppp1r1b+ BLA neurons
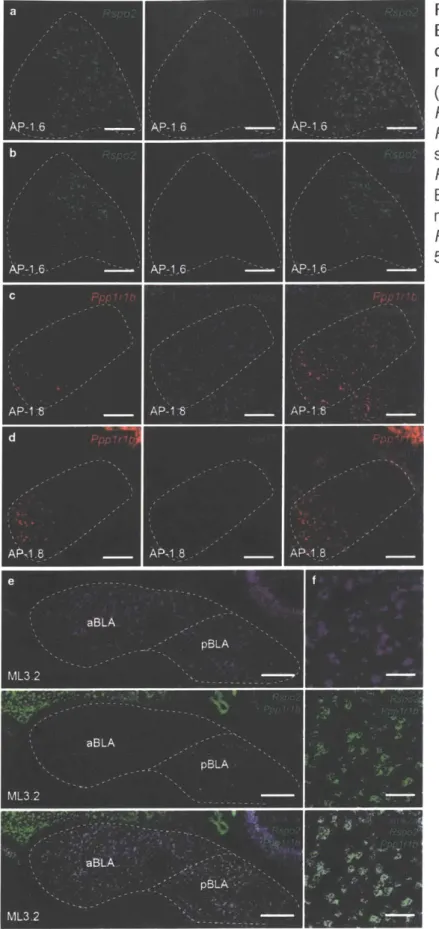
Double label single molecule fluorescent in situ hybridization (smFISH) and
quantification across the anterior-posterior (AP) axis of the BLA (-0.8 to -2.8mm from bregma) revealed that Rspo2 and Ppp1r1b labeled spatially segregated population of neurons (Figure 2a-c). Less than 1% of BLA neurons were Rspo2iPpp1r1b+ (Table 1). Rspo2i and Ppp1r1b+ BLA neurons are co-labelled with the pyramidal neurons marker, Camk2a, and
non-overlapping with the inhibitory neuron marker, Gadi (Figure 2d-g, Table 1). Rspo2o neurons correspond to magnocellular pyramidal neurons in the anterior BLA (aBLA). In contrast, Ppp1r1b+ neurons correspond to the parvocellular pyramidal neurons or posterior BLA
(pBLA)1". Double smFISH with a Camk2a probe and the combined probes of both the Rspo2 and Ppp 1r1b showed that virtually all Camk2a+ BLA neurons express either Rspo2 or Ppp 1r1b (Table 1, Figure 10). Therefore, Rpso2i and Ppp1r1b+ neurons collectively define the entirety of BLA pyramidal neurons.
The electrophysiological and morphological properties of Rspo2+ and Ppp1r1b+ neurons were examined using patch clamp recordings. Rspo2* and Ppp1r1b+ were targeted by patching magnocellular and parvocellular BLA neurons (Figure 2h). To ascertain genetic identity, Rspo2+ and Ppp1r1b+ neurons were identified by the use of single-cell quantitative polymerase chain reaction (qPCR) from cytoplasmic harvest of patch clamped recorded BLA neurons. Of 37 magnocellular neurons, single cell qPCR yielded 10 Rpso2i and 0 Ppp1r1b+ neurons; of 38 parvocellular neurons, single cell qPCR yielded 0 Rpso2+ and 11 Ppp1r1b+
neurons (Figure 2i). Soma diameter was larger in Rspo2 neurons than Ppp1r1b+ neurons; membrane resistance was smaller in Rspo2i neurons than Ppp1r1b+ neurons; membrane capacitance was larger in Rspo2+ neurons than Ppp1r1b+ neurons (Figure 2j,k). qPCR-confirmed Rspo2O and Ppp1r1b+ neurons were not significantly different from unqPCR-confirmed magnocellular and parvocellular neurons, respectively (Tablel). Taken together, Rpso2i and
Ppp1r1b+ BLA neurons defined spatially segregated, genetically, morphologically, and
electrophysiological distinct cell-types.
If Rspo2i and Ppp1r1b+ neurons represent negative and positive neurons of the BLA, respectively, then stimuli that elicit valence-specific behaviors may differentially activate the aBLA and pBLA. Mice were exposed to the stimuli used to identify BLA gene markers-shocks or female mice-and were sacrificed 90 minutes later. c-Fos+ neurons were quantified
sepearately in the aBLA and pBLA (defined by cytoarchitectural boundaries) by measuring the total number of c-Fos + neurons per section at intervals across the AP axis (Figure 3a-c, Figure
11). The relative c-Fos expression, measured by the number of c-Fos+ neurons in the aBLA or pBLA as a percentage of total c-Fos + BLA neurons, was significantly greater in the aBLA in response to footshocks compared to exposure to a female mice or control mice, which received no stimulus in a context (Figure 3d). Conversely, relative c-Fos expression was significantly greater in the pBLA in response to female mice compared to exposure shock or control, which were exposed to a neutral context (Figure 3d). In response to valence-specific olfactory stimuli-2,3,5-Trimethyl-3-thiazoline (TMT), or peanut oil-relative c-Fos expression was significantly greater in the aBLA in response to TMT compared to exposure to a neutral odor benzaldehyde (BA) or peanut oil, while relative c-Fos expression was significantly greater in the pBLA in response to peanut oil compared to exposure to a BA or TMT (Figure 3e). In response to valence-specific gustatory stimuli -quinine (bitter), water, sucrose
(sweet)-relative c-Fos expression was significantly greater in the pBLA in response to water and sucrose water compared to mice that received no water or quinine water (Figure 3f). In
contrast, no significant difference was observed in relative c-Fos expression between exposure to quinine water (which did not elicit much water drinking) compared to no water, as well as between sucrose water and water (Figure 3f). Overall, the aBLA is recruited by stimuli that elicits negative behaviors (shocks, TMT), while the pBLA is recruited by stimuli that elicits positive behaviors (female, water, sucrose, peanut oil).
Double smFISH was performed to directly assess the expression of c-Fos in Rspo2o or
Ppp1r1b+ BLA neurons in response to valence-specific stimuli (stimuli that will be used in
subsequent behavioral experiments). Shocks significantly increases c-Fos expression in
Rspo2O (Figure 3g,k), but not in Ppp1r1b+ neurons (Figure 3h,l), compared to context (Figure
3g, h, m, n). In contrast, administration of water significantly increases c-Fos expression in
Ppp1r1b+ (Figure 3j,p), but not in Rspo2 neurons (Figure 3i,o), compared no water (Figure 3i,
j, q, r, Figure 12c,d). These data suggest that negative and positive information is represented by genetically-defined populations of neurons in the BLA that are spatially segregated; Rspo2i neurons, which define the aBLA, represent negative valence, while Ppp1r1b+ neurons, which define the pBLA, represent positive valence.
Valence-specific activation of Rpso2 and Ppp1r1b+ neurons posits that these populations may be necessary for valence-specific behaviors; therefore, the effects of
inhibiting these BLA populations were performed in a fear and reward conditioning paradigm.
Rspo2+ and Ppp1r1b+ neurons were genetically targeted using Rspo2-Cre and Cartpt-Cre
mice, respectively. Ppp1r1b+ BLA neurons are accessible by Carpt-Cre mice (Figure 12), and hereafter, virus-injected Cartpt-Cre mice will be referred to using "Ppplrlb". Light-activated inhibitory ion channel, eArch3.0, was expressed in Rspo2*(Rspo2-Arch) and Ppp1r1b+
(Ppp1 r1 b-Arch) BLA neurons using a Cre-dependent viral vector (AAV5
-EF1a-DIO-eArch3.0-eYFP) bilaterally targeted to the BLA of Rspo2-Cre and Cartpt-Cre mice, respectively. Control mice (Rspo2-eYFP, Pppl ri b-eYFP) received a viral vector lacking eArch3.0, (AAV5-EF1
a-DIO-eYFP) (Figure 4a,1,m).
On day 1 of contextual fear conditioning, mice received green light, bilaterally targeted to the BLA, during footshocks (Figure 4b). Rspo2-Arch mice displayed reduced levels of freezing in response to footshocks compared with Rspo2-eYFP mice. Ppplrl b-Arch mice displayed similar levels of freezing compared to Pppl ri b-eYFP mice. On day 2, mice were tested in the context without shock or light stimulation. Reduction of freezing was observed in Rspo2-Arch mice compared to Rspo2-GFP mice, while, similar levels of freezing was observed in Ppplrlb-Arch mice compared to Ppplrlb-eYFP mice (Figure 4c). Thus, Rspo2+, but not Pppl ri bp+, BLA neuronal activity is critical for freezing to shock stimuli and for the association of a context to freezing behavior.
Reward conditioning took place in an operant conditioning chamber, where water was dispensed contingent on a nose poke following an external light cue (Figure 4d). Green light was bilaterally delivered into the BLA simultaneously with the presentation of water. Rspo2-Arch and Rspo2-eYFP mice displayed similar levels of nose pokes and cue-reward association (z-score of time spent in the reward port during cue period, see Methods). In contrast,
Ppplrlb-Arch mice displayed reduced levels of nose pokes and cue-reward association compared to Ppplrlb-eYFP mice (Figure 4e). Thus, Ppp1r1b+, but not Rpso2*, BLA neuronal activity is critical for reward-seeking behavior and for the association of a conditioned stimulus to appetitive behavior.
Next, the effects of activating these BLA neurons were assessed. Light-activated excitatory ion channel, ChR2, was expressed in Rspo2+ (Rspo2-ChR2) and Ppp 1r1b+
(Ppp1rlb-ChR2) BLA neurons using a Cre-dependent viral vector (AAV-EF1a-DIO-ChR2-eYFP) unilaterally targeted to the BLA of Rspo2-Cre and Cartpt-Cre mice, respectively. Control mice (Rspo2-eYFP, Ppplrlb-eYFP) received a viral vector lacking ChR2, (AAV5
-EF1a-DIO-eYFP) (Figure 4a,n,o).
On day 1 of the optogenetic freezing test, mice were placed in a neutral context while receiving blue light stimulation (Figure 4f, see methods). Rspo2-ChR2 mice displayed greater levels of freezing compared to Rspo2-eYFP mice, while Ppplrlrb-ChR2 and Ppplrlb-eYFP mice displayed similar levels of freezing (Figure 4g). On day 2, mice were returned to the context and freezing was measured without shock. Rspo2-ChR2 mice displayed greater levels of freezing compared to Rspo2-eYFP mice, while Ppplrlrb-ChR2 and Ppplrlb-eYFP mice displayed similar levels of freezing (Figure 4g). Thus, Rspo2i, but not Ppp1r1b+, BLA neurons are capable of eliciting freezing, which can be conditioned to a neutral context.
On day 1 of the optogenetic self-stimulation test, mice were placed in an operant
conditioning chamber in which blue light stimulation was administered when poking into a nose port (Figure 4h). Ppp1r1b-ChR2 mice displayed greater number of pokes compared to
Pppl ri b-eYFP mice, while Rspo2-ChR2 and Rpso2-eYFP mice displayed similar number of pokes. On day 2, mice were returned to the operant condition chamber in which no light stimulation was delivered. Ppplrlb-ChR2 mice displayed greater number of pokes compared to Ppplrlb-eYFP mice, while Rspo2-ChR2 and Rspo2-eYFP mice displayed similar number of pokes (Figure 4i). Thus, Ppp1r1b+, but not Rspo2*, BLA neurons are capable of eliciting self-stimulation and support reward conditioning.
In real-time optogenetic place preference test (Figure 4j), Rspo2-ChR2 mice spent less time in the light-stimulated side compared to corresponding controls, while Ppp1r1b-ChR2 mice spent more time in the light-stimulated side compared to corresponding controls (Figure
4k). Therefore, Rspo2O BLA neurons are sufficient to elicit place aversion while Ppp1r1b+ BLA neurons are capable of eliciting place preference.
C. Antagonism between Rpso2+ and Ppp1r1b+ BLA neurons
Rpso2O and Ppp1r1b+ neurons drive opposing behaviors; therefore, we examined whether these two types of neurons contribute to the antagonistic control of emotional
behaviors and memories. For this purpose, we examined the behavioral effects of optogenetically activating Rpso2* or Ppp1r1b+ neurons during the presence of valence-specific stimuli. On day 1 of contextual fear conditioning, ChR2-expressing mice received bilateral blue light stimulation in the BLA during footshocks (Figure 5a). Rspo2-ChR2 and Rspo2-eYFP mice displayed similar levels of freezing in response to footshocks, while
Ppp1r1b-ChR2 mice displayed lower levels of freezing than Ppp1r1b-eYFP mice (Figure 5b,c). On day 2, conditioned freezing was assessed by returning mice to the context without
footshock or light stimulation. Similar to day 1, no difference in freezing was observed between Rspo2-ChR2 and Rspo2-eYFP mice, while less freezing was observed in Ppp1 ri b-ChR2 mice compared Ppplrlb-eYFP mice (Figure5b,c). Thus, activation of Ppp1r1b+ BLA neurons is capable of disrupting freezing to footshocks and the association of a conditioned contextual stimulus with footshocks.
In reward conditioning, ChR2-expressing mice received blue light stimulation during reward delivery (Figure 5d). Rspo2-ChR2 displayed reduced levels of nose pokes and cue-reward association compared to Rspo2-eYFP mice, while Ppplrlb-ChR2 and Ppplrlbp-eYFP mice displayed similar levels of nose pokes and cue-reward association (Figure 5e,f). Thus, activation of Rspo2 + BLA neurons is capable of disrupting reward-seeking behaviors and the association of a conditioned stimulus with a reward.
Although Rpso2e and Ppp1r1b+ neurons antagonize behaviors elicited by stimuli of the opposing valence, behavioral antagonism may be result of interference by downstream circuits rather than by direct interactions between these two neuronal populations. Therefore, the effect of optogenetic activation of one of the two neuronal populations on the activation of the other in response to valence-specific stimuli was measured using c-Fos. In Pppl ri b-ChR2 mice, which received blue light stimulation in the presence of footshocks, c-Fos was increased in Ppp1r1b+ neurons and decreased in Rpso2+ neurons compared to Ppplrlb-eYFP mice (Figure 5g,h,i). In water-deprived Rspo2-ChR2 mice, which received blue light stimulation during the
consumption of water, c-Fos was increased in Rspo2- neurons and decreased in Ppp 1r1b+ neurons compared to Rspo2-eYFP mice (Fig 5j,k,l). Thus, Ppp1r1b+ and Rpso2 neurons are capable of reducing the activity elicited by valence-specific stimuli in the opposite neuronal
population.
Antagonism observed at the behavioral and c-Fos activation level of valence-specific BLA neurons was further examined at the microcircuit level by combining patch clamp
recording with optogenetic stimulation of valence-specific neurons. The functional relationship between Rspo2 and Ppp1r1b+ neurons were examined by combining patch clamp recordings with optogenetic stimulation of cell type-specific axons (Figure 6a-d). Patch clamp recordings
of Rspo2i and Ppp1r1b+ neurons revealed distinct intrinsic physiological properties (Table 1).
Therefore, the postsynaptic cell target was recognized based on a combination of anatomical position, soma size, and intrinsic electrophysiological properties (Figure 6m,n).
Electrophysiological recordings of Rspo2+ neurons in response to optogenetic stimulation of Ppp1r1b-ChR2+ fibers and recordings of Ppp1r1b+ neurons in response to stimulation of Rspo2-ChR2+ fibers resulted in inhibitory post-synaptic potentials (IPSPs) (Figure 6e-h,k,l). The probability of connections of Rpso2* to Ppp1r1b+and vice versa were 100% and 100%
inhibitory, respectively (Figure 6i,j), of which 25% of connections of Ppp1r1b+ to Rpso2BLA neurons and 17% of connections of Rpso2+to Ppplrlb-were both inhibitory and excitatory (Figure 6i,j). These data suggest that these two populations interact predominantly through mutual inhibition.
D. Rpso2+ and Ppp1r1b+ BLA neuron projections
The distinct projection targets of the Rspo2' and Ppp1r1b+ neurons may reveal
divergent brain structures that mediate negative and positive behaviors. Therefore, retrograde tracing from putative projection targets was examined using cholera toxin subunit b (CTB). CTB targeted to the capsular nucleus of the central amygdala (CeC), revealed CTB+ neurons primarily in the aBLA (Figure 7a,c,d). CTB targeted to the lateral/medial nucleus of the central amygdala (CeL/CeM), resulted in CTB+ neurons distributed along the lateral side of the pBLA (Figure 7a,e,f). CTB targeted to the nucleus accumbens (NAc), resulted in CTB+ neurons distributed along the medial side of the BLA, spanning the posterior end of the aBLA to the posterior end of the pBLA (Figure 7a,g,h). Dual-labelled CTB targeted to the prelimbic (PL) and inframlimbic (IL) cortex resulted in spatially segregated distribution of CTB+ neurons in the BLA-PL-CTB+ neurons primarily in the aBLA, IL-CTB+ neurons primarily in the pBLA (Figure 7b,i,j). smFISH of Rspo2or Ppplrlb probe in CTB injected mice, revealed that CeC-CTB+ BLA neurons are 96% Rpso2O and 4% Ppp1r1b+; CeL/CeM-CTB+ neurons are 6% Rspo2i and 94%
Ppp1r1b+; NAc CTB+ neurons are 30% Rpso2i and 70% Ppp1r1b+ (Figure 7k-n, ', Table 1). For anterograde characterization, ChR2-eYFP+ fibers in Rspo2-ChR2 and Pppl ri b-ChR2 mice was examined. In Rspo2-b-ChR2 mice, dense fibers were found in the CeC, NAc, PL, but not in the CeL, CeM, or IL (Figure 7o). In Ppplrlb-ChR2 mice, dense fibers were found in the CeL, CeM, NAc, and IL but not in the CeC or PL (Figure 7p). Together, CTB retrograde tracing and anterograde characterization of projection fibers suggest that Rspo2i distinctly
project to the CeC and PL, Ppp1r1b+ neurons distinctly project to the CeL, CeM, and IL, while both Rspo2i and Ppp1r1b+ BLA neurons both project to the NAc.
II. Central amygdala
The central amygdala (CeA), like the BLA, is involved in the control of valence-related behaviors 344. As previous described (I. Basolateral amygdala), the BLA contains two spatially segregated, genetically distinct populations of cortical-like excitatory pyramidal neurons-Protein phosphatase 1 regulatory subunit 1B+ (Ppp1r1b+ also known as DARPP-32) parvocellular neurons and R-spondin 2+ (Rspo2+) magnocellular neurons 1-3,25,29,43. BLA
Ppp1r1b+ neurons elicit appetitive behaviors, inhibit defensive behaviors, and send projections
to the lateral (CeL) and medial (CeM) nucleus of the CeA. BLA Rspo2i neurons elicit defensive behaviors, inhibit appetitive behaviors, and send projections to the capsular (CeC) nucleus of the CeA25. The CeA consists of GABAergic striatal medium spiny-like neurons, and similar to the BLA, is critical for appetitive and defensive behaviors 3,45.
The CeA has been mainly studied on the basis of its role in innate and learned
fear-related behaviors 4-6'8'46
-50. Cell-type specific studies have shown evidence for the involvement of
several genetically defined CeA neurons in aversive behaviors such as defensive responses and anxiogenesi5 1 58. However, despite early evidence suggesting the involvement of the CeA
in appetitive behaviors59-2 and more recent activation studies demonstrating a modulatory role of the CeA in appetitive behavior 63-65, how appetitive behavior integrates into a structural and functional model of amygdala has yet to be established. For instance, a genetically defined population of CeA neurons that are positive mediators of appetitive behavior has not been identified. Given the strong projections from BLA Ppp1r1b+ parvocellular neurons to the CeL
appetitive behavior. Therefore, we first examined the role of genetically distinct CeA
populations in both appetitive and defensive behaviors. Furthermore, although the BLA and CeA are both important for appetitive and defensive behaviors, it is not known how BLA
Ppp1r1b+ parvocellular and BLA Rspo2* magnocellular neurons are connected to genetically
defined CeA neurons. Therefore, we also examined the connectivity from genetically defined neurons from the BLA to CeA. Lastly, cytoarchitectural studies suggest that the BLA and CeA are structurally similar to the cortex and striatum, respectively.29. For this reason, we explored
the expression pattern of striatal markers in the CeA to examine if there exists, an organizing principle in the BLA to CeA circuit that is common with the cortex and striatum.
A. Identification of genetically distinct CeA neurons
Gene expression studies have shown a wide range of genetic diversity within the CeA
66-70. To identify genetically distinct populations in the CeA, we performed single molecule in
situ hybridization (smFISH) (ACDBio RNAscope) of genes that are expressed in the CeA-calcitonin receptor-like (Calcr), corticotropin-releasing hormone (Crh), serotonin receptor 2a
(Htr2a), neurotensin (Nts), protein kinase C-6 (Prkcd), somatostatin (Sst), and tachykinin 2
(Tac2). It should be noted that for the CeC only the anterior region was quantified due to the
ambiguity of the CeC in the posterior CeA (Figure 24). Calcr/ and Prkcd were expressed in the CeC; Crh, Htr2a, Nts, Prkcd, Sst, and Tac2 were expressed in the CeL; Htr2a, Nts, Sst, and Tac2 were expressed in the CeM (Figure 24A and 24B). Overlap of the expression of Caicrl,
Crh, Nts, Prkcd, Sst, and Tac2 was examined in the CeA. In the CeC, Calcr/labeled 89%of
Prkcd neurons, while Prkcd labeled 56% of Ca/crr neurons (Figure 17A and 17D). Calcr/t
neurons were non-overlapping with Sst (which delineates the CeL) in the CeA (Figure 171), further indicating that Ca/crt neurons reside in the CeC rather than the CeL. In the CeL, several of the genes had significantly high levels of overlap (>50%) (Figure 17B, 17J-10).
Using the levels of overlap among pairs of genes, hierarchical clustering revealed 3 major clusters. The first containing Prkcd, the second containing, Sst, and third containing Crh, Tac2, and Nts (Figure 17B). In the CeM, Crh, Nts, Sst, and Tac2 were minimally (<15%) overlapping
(Figure 17C). Htr2a expression was weak and difficult to quantify with a high degree of confidence in the CeA. However, based upon a few double label smFISH, several Htr2a+ neurons were found to coexpress Crh, Prkcd, Nts, Sst, and Tac2 in the CeL and Nts, Sst, Tac2 in the CeM (Figure 24D). Therefore, Htr2a may be less specific for labelling a distinct
population compared to the other genes. Collectively, characterization using these sets of genes revealed as many as 8 or 9 genetically and regionally distinguishable populations of neurons in the CeA.
For this study, we have chosen to study 7 major neuronal populations of the CeA, distinguishable based on gene expression and region-CeC Prkcd+, CeL Prkcc+, CeL
Crh+Nts*Tac2i, CeL Ssth, CeM Nts*, CeM Ssti, CeM Tac2* (Figure 17P). To determined what proportion of neurons CeL Prkccft, CeL Crh'Nts*Tac2, and CeL Sst+ neurons constitute in the CeL and what proportion of neurons CeM Nts*, CeM Sst+, and CeM Tac2- neurons constitute in
the CeM, the expression of Nts, Prkcd, Sst, and Tac2with glutamate decarboxylase 1 (Gadi), a marker of inhibitory neurons, was examined. Prkcd, Sst, and Tac2 collectively labeled 96% of
Gad1+ neurons in the CeL, whereas Prkcd+, Sst*, and Tac2i neurons were 100% Gad1+ (Figure
24C). Nts, Sst, and Tac2 collectively labeled 95% of Gad1+ neurons in the CeM, whereas Nts*,
Sst, and Tac2i were 100% Gad1+ (Figure 24C). This suggests that CeL Prkcd+, CeL
Crh+Nts*Tac2i,and CeL Sst+ neurons constitute the majority of GABAergic neurons in the CeL
and that CeM Nts*, CeM Sst*, and CeM Tac2i neurons constitute the majority of GABAergic
neurons in the CeM.
The CeA has been shown to participate in defensive behaviors and appetitive
behaviors4 -6
,4759-61. Therefore, each of the 7 CeA neuronal populations was subjected to
optogenetic stimulation experiments to assess these functions. CeC Prkcd' and CeL Prkcd* neurons were targeted using a Cre-dependent channelrhodopsin (ChR2) virus injected into the CeC and CeL, respectively, of the Prkcd-Cre mice; CeL Ssth and CeM Sst* using injections into
the CeL and CeM, respectively, of the Sst-Cre mice; CeL Crh-Nts*Tac2 neurons using
injections into the CeL of Crh-Cre mice; CeM Nts* neurons usings injections into the CeM of Nts-Cre mice; CeM Tac2i neurons using injections into the CeM of the Tac2-Cre mice (Figure 25A). Control mice were Cre- mice that underwent identical surgical procedures in the CeC (Prkcd-Cre- mice), CeL (Sst-Cre- mice), and CeM (Tac2-Cre- mice). In the optogenetic freezing test, mice were placed into a neutral conditioning chamber, where no light stimulation occurred during the 0- to 3-min period (OFF) followed by 20-Hz blue light stimulation during the 3- to
6-min period (ON). Stimulation of CeC Prkcd' neurons elicited freezing (Figure 18A), measured by an increase in freezing during the ON period compared to the OFF period, while stimulation of CeL Prkcdcf, CeL Crh+Nts*Tac2*, CeL Ssti, CeM Nts', CeM Sst*, and CeM Tac2 neurons did not elicit freezing (Figure 18B-18G). It should be noted, that stimulation of CeM Tac2
neurons elicited immobility-like behaviors, but did not reflect stereotypical freezing. Rather, this immobility-like behavior due to activation of CeM Tac2 neurons coincided with biting behavior in 5 out of 8 mice. Cre- control mice did not demonstrate light-induced freezing (Figure 25B). Following the freezing test, mice were tested for stimulation. In the optogenetic self-stimulation test, mice were freely allowed to poke into two nose ports for a single session of 60
min where only one port delivered 20-Hz blue light stimulation. Activation of CeL Sst*, CeL
Crh+Nts*Tac2i, CeM Nts*, CeM Sst*, and CeM Tac2 neurons resulted in self-stimulation, based on an increased in nose pokes in the light stimulated port (ON) compared to the
unstimulated port (OFF) (Figure 18C-18G), while CeC Prkcd+ and CeL Prkcd neurons did not result in self-stimulation (Figure 18A-18B). Cre- control mice did not demonstrate light induced self-stimulation (Figure 25B). These optogenetic stimulation experiments demonstrate that CeL
Ssti, CeL Crh+Nts*Tac2, CeM Nts*, CeM Sst+, and CeM Tac2* neurons are capable of driving
appetitive behaviors, CeC Prkcd+ neurons are capable of driving defensive behaviors, while CeL Prkcd+ neurons are not capable of driving either appetitive or defensive behaviors.
Distinct CeA neurons are capable of eliciting defensive behaviors and appetitive behaviors. Therefore, to assess how these populations are activated by external stimuli, the expression of the activity-dependent gene, Fos 71, was measured in each of the 7 CeA
neuronal populations in response to five different conditions associated with defensive or appetitive behaviors. Wild-type mice were exposed to either footshocks or no foosthocks; contextual fear extinction recall or contextual fear recall without fear extinction; ad libitum food or no food in food-deprived mice; ad libitum water, quinine water, or no water in
water-deprived mice; injection of cholecystokinin (CCK, an agent that induces satiety) or saline in mice 30 min prior to sacrifice (see Methods). The percentages of Fos labelling within each of the CeA populations were measured. Fos expression was increased in CeC Prkcd+ neurons in response to footshocks compared to corresponding control (Figure 19A) and contextual fear recall compared to contextual fear extinction (Figure 19B). Fos expression was also measured in CeC Calcrr neurons in response to footshocks and was found to be significantly increased in CeC Calcrr neurons (Figure 26B). This is consistent with the observation that CeC Prkcd labels a subpopulation of CeC Calcr/r neurons (Figure 17A). Fos expression was increased in CeL Prkcd+ neurons in response to contextual fear extinction recall compared contextual fear recall (Figure 19B). Fos expression was increased in CeL Prkcd+, CeL Sst*, CeL
and ad libitum water compared corresponding controls (Figure 19C-1 9D). Fos expression was increased in CeL Prkcd' in response to CCK (Figure 19E). Fos expression was increased in CeC Prkcd+ in response to quinine in water-deprived mice (Figure 19D). These results suggest that CeC Prkcd+ neurons are activated by threatening stimuli and aversive tastes. CeL Prkcd+ neurons are activated by states of suppression of defensive behaviors and stimuli that
suppress appetitive behaviors. CeL Sst*, CeL Crh+Nts*Tac2, CeM Nts*, CeM Sst*, and CeM
Tac2* neurons are activated by stimuli that elicit appetitive behaviors.
Differential Fos expression in the CeA in response to food, water, and footshock
suggests there may be differential involvement of these 7 CeA populations in feeding, drinking, and freezing behaviors. Therefore, to dissociate the contribution of distinct CeA populations in these behaviors, each of the 7 CeA neuronal populations was subjected to a series of
optogenetic inhibition experiments (see Methods). For targeting these populations, a
Cre-dependent archaerhodopsin (Arch) virus was injected in the same fashion as in the previous optogenetic stimulation experiments, while littermate Cre- mice that underwent identical procedures were used as controls. When presenting ad libitum food in food-deprived mice during a 10-min trial, inhibition of each of the CeA populations-CeC Prkcd*, CeL Prkcd*, CeL Sst*, CeL Crh+Nts*Tac2*, CeM Nts*, CeM Sst*, and CeM Tac2O-did not result in any
significant changes in the duration of feeding behavior compared to corresponding controls (Figure 20A-G). Subsequently, when presenting ad libitum water in water-deprived mice during a 5-min trial, inhibition of CeL Prkcd neurons resulted in an increase in drinking behavior (Figure 420B), inhibition of CeL Sst* and CeL Crh+Nts+Tac2 resulted in a decrease in drinking
behavior (Figure 20C and 20D), and inhibition of CeC Prkcd*, CeM Nts*, CeM Sst*, and CeM
Tac2i did not result in changes to drinking compared to corresponding controls (Figure
inhibited during the presentation of 3 footshocks in a contextual fear conditioning protocol (Day 1) and were subsequent reexposed to the conditioning chamber 24 hr later with no light
inhibition (Day 2). Inhibition of CeC Prkcd+ neurons resulted in a minor, but statistically
significant, reduction in freezing on Day 1 and subsequently reduced levels of freezing on Day 2 compared to corresponding controls (Figure 20A). Although there is a trend for increased freezing levels from inhibition of CeL Prkccf+ neurons as previously reported 5, inhibition of the any of the CeA populations did not affect freezing on Day 1 or 2 compared to corresponding controls (Figure 20B-G). Together, these data suggest that CeL Prkcct and CeL Prkcd (CeL
Sst and CeL Crh'Nts*Tac2*) neurons have opposing roles on drinking, CeC Prkccfr neurons
are required for defensive behaviors, while inhibition of any one of these populations does not affect feeding behavior in food-deprived mice.
Inhibition of CeM Nts*, CeM Sst', or CeM Tac2O neurons did not affect feeding, drinking
or freezing behaviors. Therefore, the effects of collectively inhibiting all three CeM populations were assessed. CeM Nts*, CeM Sst, and CeM Tac2i neurons collectively constitute almost all
CeM Drd1+ neurons (Figure 27E). Thus, a Cre-dependent Arch virus was injected into the CeM
of Drdl-Cre mice and underwent the same procedures as the previous inhibition experiments (Figure 20). Inhibition of CeM Drd1+ neurons resulted in reduction of feeding behavior in
food-deprived mice, reduction of drinking in water-food-deprived mice, and showed no differences in freezing in response to footshocks compared to corresponding controls (Figure 27). Therefore,
CeM Drd1+ neurons are critical for both feeding and drinking behavior and suggest that CeM
Nts*, CeM Sst', and CeM TacI neurons may collectively function to mediate feeding and
drinking.
The CeA is one of the output structures of the amygdala and is known to project to several brain regions including the periaqueductal gray (PAG) and it has been widely hypothesized that PAG-projecting CeA neurons mediate freezing A,49,5O,72. Therefore, the
relationship between PAG-projecting CeA neurons and genetically distinct CeA populations was examined. The retrograde tracer, cholera toxin subunit B (CTB), was injected into the PAG. This resulted in CTB+ neurons in the CeL and CeM that were Sst*, Tac2+, and Nts+ (Figure 28A-C). In contrast, CTB retrograde tracing from the PAG did not label Prkcd+ neurons in the CeL (Figure 28A-C) which is consistent with previous reports 72. Using ChR2 mice
(Figure 18), anterograde tracing fibers were found in the PAG of CeL-Sst-ChR2, CeL-Crh-ChR2. CeM-Nts-ChR2, CeM-Sst-ChR2, and CeM-Tac2-ChR2 mice, but not CeC-Prkcd-ChR2 and CeL-Prkcd-ChR2 mice (Figure 28D). These data suggest that CeL Sst*, CeL
Crh'Nts*Tac2*, CeM Nts*, CeM Sst', and CeM Tac2i neurons project to the PAG, while CeC Prkcd* and CeL Prkcct neurons do not project the PAG. These findings suggest that,
independent of whether or not appetitive functions are necessarily mediated by transmission from the CeA to PAG, PAG projections may not be a unique structural feature of CeA neurons that mediate defensive function.
D. Cell-type specific BLA-to-CeA connectivity
Genetically defined BLA pyramidal neurons that are capable of driving defensive and appetitive behaviors send projections to the CeA 25. Therefore, the anatomical relationship
between the BLA and CeA was examined using cell-type specific monosynaptic rabies tracing in the 7 CeA neuronal populations 73,74. To target these populations, AAV helper virus, AAV1
-synP-FLEX-sTpEpB, (construct containing Cre-dependent TVA, Rabies G-protein, eGFP) was injected in the same fashion as in the optogenetic stimulation experiments, incubated for 3 weeks prior to injection of the G-deleted rabies mCherry virus, then sacrificed 1 week later.
Tissues were labeled using antibodies against PPP1R1B to determine the BLA
cell-type-Ppplr1b+ or Ppplrlb (as a measure of Rspo2+ neurons because Rspo2+ and Ppp1r1b+
constitute virtually all BLA excitatory neurons 25) (Figure 21D-J). Monosynaptic tracing from
CeL Prkcd, CeL Ssth, CeL Crh+Nts*Tac2i, CeM Nts', CeM Sst*, and CeM Tac2i neurons
resulted in retrograde labeled neurons in the BLA that are predominantly PPP1 R1 B+ (Figure 21A). In contrast, monosynaptic tracing from CeC Prkcd+ neurons resulted in retrograde
labeled neurons in the BLA that were PPP1R1B- but also PPP1R1B+ (Figure 21A). These results suggest that BLA Rspo neurons directly project to CeC Prkcd+ neurons, while BLA Ppp1r1b+ neurons directly projects to all CeA neurons that were examined. It should be noted that the connectivity from BLA Ppp1r1b+ neurons to CeC neurons was not observed in our previous study 25. This apparent contradiction may be explained by the fact that we previously targeted the dorsal portion of the CeC for retrograde labelling, whereas CeC Prkcd' neurons reside
more ventrally in the CeC (Figure 24B).
Monosynaptic tracing experiments were further analyzed using an antibody against PKC-6 for determining the retrograde labeled CeA cell-type (Prkcd+ or Prckd). Monosynaptic tracing from CeL Prkcd, CeL Sst*, CeL Crh+Nts*Tac2+, CeM Nts* and CeM Tac2i neurons
resulted in several (>5 neurons/section) retrograde labeled neurons in the CeC that were
PKC-6+ and PKC-6- (Figure 5B). Monosynaptic tracing from CeC Prkcd, CeL Sst*, CeL
Crh+Nts*Tac2O, CeM Nts+ and CeM Tac2- neurons resulted in several (>5 neurons/section)
retrograde labeled neurons in the CeL that were PKC-6+ neurons (Figure 21C). Monosynaptic tracing from CeM Nts' neurons resulted in several (>5 neurons/section) retrograde labeled
neurons in the CeL that were PKC-6- neurons (Figure 21C). Although no leaky viral expression was found (Figure 28E), due to possibilities of differential tropism across mouse lines,
connectivity than demonstrated by these rabies experiments. Nevertheless, using an arbitrary threshold for retrograde labelling (>2.5 neurons/section in the BLA and >5 neurons/section in the CeA), a model of the BLA to CeA connectivity was generated (Figure 31A). Overall, these
results demonstrate monosynaptic connections from BLA Ppp1r1b+ neurons to the CeA neurons that mediate appetitive behaviors and a monosynaptic connection from BLA Rspo2i neurons primarily to CeC neurons that inhibit several of the CeA neurons that are capable of eliciting appetitive behavior.
The BLA to CeA connectivity was further assessed using slice patch clamp recordings in conjunction with cell-type specific optogenetic stimulation of the BLA. Cre-dependent ChR2 virus was injected into the BLA of Rspo2-Cre and Cartpt-Cre mice for targeting BLA Rspo2+
(Rspo2-ChR2) and BLA Ppp1r1b+ (Ppp1r1b-ChR2) neurons, respectively 25. Patch clamped
CeA neurons were recorded in response to ChR2 stimulation and were genetically identified using biocytin filling followed by immunohistochemistry against PKC-6 in the CeL or cytosolic harvesting followed by quantitative polymerase chain reaction (qPCR) in the CeC and CeM.
The electrical properties were also measured of these neurons (Figure 29A-D). Blue-light stimulation in Ppplrlb-ChR2 slices resulted in monosynaptic excitation, determined by latency (Figure 29F-291), in 100% of neurons in the CeC, 100% of neurons in the CeL, and 97% of neurons in the CeM. Among these neurons, disynaptic inhibition was also observed following monosynaptic excitation in 57% of neurons in the CeC, 53% of neurons in the CeL, and 60% of neurons in the CeM (Figure 22A). Connections with only disynaptic inhibition were observed in 3% of neurons in the CeM. Based on genetic marker-based confirmation (Figure 29E and 29J), monosynaptic excitatory connections were observed in CeC Prkcct, CeL Prkccd, CeM Nts*,
CeM Sst+, and CeM Tac2i neurons (Figure 22C and 29J). Blue light stimulation in Rspo2-ChR2
CeL, and 0% of neurons in the CeM. Among these neurons, disynaptic inhibition following monosynaptic excitation was observed in 58% of neurons in the CeC and 50% of neurons in
the CeL. Connections with only disynaptic inhibition were observed in 11 % of CeL neurons
(Figure 22B). Based on genetic marker-based confirmation (Figure 29E and 29K),
monosynaptic excitatory connections were observed in CeC Prkcct neurons as well as a CeL
Prkcct neuron (Figure 22D and 29K). These results show that BLA Rspo2i neurons mainly
innervate CeC Prkcd' neurons, while making minimal connections to the CeL and CeM. In contrast, BLA Ppp1r1b+ neurons innervate CeC Prkcd', CeL Prkcd+, CeM Nts', CeM Sst*, and
CeM Tac2+ neurons. In addition, 100% connectivity from BLA Ppp1r1b+ neurons to CeL
neurons suggests that BLA Ppp1r1b+ neurons also innervate CeL Sst+ and CeL Crh+Nts*Tac2. Although the identity of the neurons that mediates the polysynaptic inhibitory responses cannot be identified from these experiments, these functional experiments confirm the results of the rabies tracing experiments (Figure 21) and connectivity model of the BLA to CeA connectivity (Figure 31A).
E. Striatal marker expression in the CeA
The BLA and CeA are cytoarchitecturally similar to the cortex and striatum, respectively 3,29. In the cortex, the direct pathway promotes movement and is characterized by
intratelencephalic-type (IT-type) cortical neurons innervating dopamine receptor 1 + (Drd1+),
dynorphin+ (Pdyn+), and substance P+ (Tac1+) striatonigral medium spiny neurons. The indirect pathway inhibits movement and is characterized by pyramidal tract-type (PT-type) neurons innervating dopamine receptor 2+ (Drd2) and enkephalin+ (Penk+) striatopallidal medium spiny neurons 75-7. Therefore, the expression of Drdl, Drd2, Pdyn, Penk, and Tacl was examined in
the CeA to examine how the BLA to CeA circuit is organized compared to the direct and indirect pathway of the cortex and striatum. Drd2 and Penk were expressed in the CeC. Pdyn
and Penk were expressed in the CeL. Drd1, Drd2, Pdyn, Penk, and Tac 1were expressed in the CeM (Figure 30A and 30B). Overlap of the expression of these striatal markers was examined in the CeA (Figure 23A-B, 30C). In the CeC, Penk and Drd2 were highly (>90%)
overlapping (Figure 23A). In the CeL, Penk labeled 78% of Pdyn neurons, while Pdyn labeled
35% of Penk neurons (Figure 23B,). In the CeM, hierarchical clustering using overlaps of the genes showed 2 major clusters. The first was Drd2, which was minimally overlapping (<15%) with the other markers. The second contained, Drdl, Pdyn, and Penk, which all moderately overlap with one another (~30-60%) except for Pdyn neurons, with which most or all (>90%) coexpressed Drdl (Figure 23C). Using these sets of striatal markers,. 7 or 8 genetically and regionally distinct populations can be identified. It should be noted that Drd2 expression in the
CeM is questionable. Though Drd2 is expressed within the bounds of the CeM, its sparseness and expression pattern may reflect expression in the ventromedial extent of the CeC rather than the CeM. Further assessment using CTB retrograde tracing from the PAG resulted in no detectable CTB+ neurons that were Drd2* (data not shown). Thus, like CeC neurons, Drd2i neurons likely do not project to the PAG and therefore these CeM Drd2i neurons may reflect
CeC Drd2+ neurons.
The relationship between striatal markers and the CeA markers that were behaviorally and functionally characterized was examined using smFISH (Figure 23D-H). In the CeC, Drd2 and Penk were coexpressed in the majority (>80%) of Prkcd+ neurons (Figure 23D), while
Prkcd was coexpressed in a subset (~40%) of Drd2 and Penk neurons (Figure 23E). In the
CeL, Penk labeled the vast majority (>90%) of Prkcd+ neurons and a subpopulation of Sst*
neurons. Pdyn labeled virtually all (97%) of Sst' neurons and the majority (70-80%) of Nts*,
Tac2i, and Crh+ neurons (Figure 23D). In the CeL, heirarchical clustering using overlaps between all the genes revealed 3 major clusters, the first containing Penk and Prkcd, the
second containing Pdyn and Sst, and the third containing Crh, Nts, and Tac2 (Figure 23F). In
the CeM, Drdl was coexpressed in the majority (>85%) of Nts*, Sst, and Tac2i neurons. Pdyn
and Penk were expressed in a subpopulation of Nts*, Sst*, and Tac2 neurons, with slightly more expression of Pdyn in Sst, neurons and more expression of Penk in Tac2i neurons (Figure 23D). In the CeM, heirarchical clustering using overlaps between all the genes revealed 2 majors clusters, the first containing Drd2, the second containing Drdl, which can be further clustered into 3 groups-Penk and Tac2; Drdl and Nts; Pdyn, Sst and Tac1 (Figure 23G). Results of gene expression in the CeA were summarized in a model (Figure 31 B). These results show that CeC Prkcdt neurons express the striatal markers for the corticostriatal
indirect pathway, Drd2+ and Penk', while CeM Nts*, CeM Sst, and CeM Tac2+ neurons mainly
express the striatal markers for the corticostriatal direct pathway, Drdl, Pdyn and Tac175,76.
Ill. Summary of Findings
A. Summary of behavioral and anatomical findings
Several genetically distinct populations were characterized in the BLA and CeA for negative and positive valence-related behaviors. Neurons that positively participate in negative valence-related behaviors included:
1. BLA Rpso2i 2. CeC Prkcd+
Neurons that positively participate in positive valence-related behaviors included: 1. BLA Ppp1r1b+
2. CeL Sst*
3. CeL Crh+Nts+Tac2i
5. CeM Sst+ 6. CeM Tac2i
Neurons that do not positively promote negative or positive valence-related behaviors, but suppress negative or positive valence-related behaviors.
1. CeL Prkcd+
B. BLA-to-CeA amygdala circuit model for valence-specific behaviors
A circuit from the BLA to CeA is summarized in Figure 31A. BLA Rspo2' neurons primarily send projections to:
1. CeC Prkcd'
BLA Ppp1r1b+ neurons primarily send projections to: 1. CeC Prkcdt 2. CeL Prkcd* 3. CeL Sst* 4. CeL Crh+Nts*Tac2i 5. CeM Nts* 6. CeM Sst* 7. CeM Tac2O Chapter 3. DISCUSSION 1. Basolateral amygdala
Here, we employed a forward genetic strategy in order to transcriptionally profile active neurons in BLA. This approach revealed genetic markers for distinct populations of BLA
neurons and was predictive of neuronal function. Rspo2i BLA neurons are activated by stimuli that elicit negative behaviors, while Ppp1r1b+ BLA neurons are activated by stimuli that elicit