Economic Complexity and Product Space of Visegrad Countries:
A New Perspective on Czech Republic, Hungary, Poland and
Slovakia
By
Kalman de Chalendar
Master in Management, HEC Paris, 2017 and
Marc Giraud
C
A
Master in Management, HEC Paris, 2017
SUBMITTED TO THE MIT SLOAN SCHOOL OF MANAGEMENT IN PARTIAL
FULFILLMENT OF THE REQUIREMENTS FOR THE DEGREE OF
MASTER OF SCIENCE IN MANAGEMENT STUDIES
AT THE
MASSACHUSETTS INSTITUTE OF TECHNOLOGY
JUNE 2017
C2017 Kalman de Chalendar and Marc Giraud. All rights reserved.
The authors hereby grant to MIT permission to reproduce and to distribute publicly paper and electronic copies of this thesis document in whole or in part in any medium now known or
hereafter created.
ASignature
redacted
ignature of Authors:
Signature
redacted
MIT Sloan School of Management
ertified
by:Signature redacted
Ro e iRWgobon P~fessor of Applieldconoi
jjFsis Supervisor
~ccepted by:
S
Iignature
redacted
Rodrigo Verdi Associate Professor of Accounting Program Director, M.S. in Management Studies Program MIT Sloan School of Management
JUN 2
02017
LIBRARIES
SEconomic Complexity and Product Space of Visegrad Countries:
A New Perspective on Czech Republic, Hungary, Poland and
Slovakia
By
Kalman de Chalendar Marc Giraud
Submitted to MIT Sloan School of Management on May 12, 2017 in Partial Fulfillment of the requirements for the Degree of Master of Science in
Management Studies.
ABSTRACT
In 1991, four Central European countries (the Czech Republic, Hungary, Poland and Slovakia) decided to form a political alliance called the Visegrad Group to explore paths of cooperation in various domains. Since the fall of communism, these countries have followed a formidable development trajectory that culminated with their integration in the European Union in 2004.
In this thesis, we approach this region using a new macroeconomic theory that provides a framework to evaluate the complexity of economies and their productive structures. After analyzing trade data at a world level we find that V4 countries have complex economic structures. They also demonstrate a high level of robustness as they maintain consistent Economic Complexity
Rankings when we vary the theory's underlying assumptions. We show that V4 countries have
acquired capabilities relevant to many sectors, which provides them with numerous development opportunities. Based on those findings, we suggest policy recommendations leading both to stronger regional integration and to the creation of a more attractive business environment.
Thesis Supervisor: Roberto Rigobon Title: Professor of Applied Economics
ACKNOWLEDGMENTS
We would like to thank Professor Roberto Rigobon for his guidance throughout our research as well as Professor Cesar Hidalgo for his recommendations regarding the appropriate analytical approach. We are also grateful to the Macro Connections team at MIT Media Lab who made the data openly available through the Observatory of Economic Complexity website.
TABLE OF CONTENTS
Introduction ... 7
Personal m otivations...7
Structure of the thesis ... 7
Preliminary view on V4 Countries ... 9
From the Eastern Bloc to the European Union ... 9
The Visegrad Group: a centenarian idea... 12
V4 economies are heavily reliant on exports ... 14
V4 Countries through the prism of Economic Complexity... 22
Introduction to the Product Space and the Theory of Economic Complexity ... 22
M ethods and data...25
Relevance of the Theory of Economic Complexity for V4 countries... 26
Diversified countries producing complex products...27
Economic Complexity Index and Ranking ... 29
Ranking sensitivity to Revealed Comparative Advantage threshold variations...32
Qualitative trade balance: economic complexity of bilateral export baskets... 38
Synthesis on Economic Complexity and current state of V4 countries...46
V4 Countries in the Product Space ... 48
The concepts of proximity and density...48
Why do density values matter for potential product expansion?... . . . . 50
Analysis of V4 countries via proximity and density...53
Unlocking opportunities through regional integration... 59
Recommendations ... 63
Develop cross-industry capabilities to enhance an attractive business environment...63
Accelerate economic and institutional integration with V4 partners... 65
C onclusion ... 67
LIST OF FIGURES AND TABLES
Figure 1: Basket of exports - Czech Republic... 14
Figure 2: Basket of exports - H ungary ... 14
Figure 3: Basket of exports - Poland... 15
Figure 4: Basket of exports - Slovakia... 15
Figure 5: Destination of exports - Czech Republic ... 16
Figure 6: D estination of exports - Hungary ... 16
Figure 7: D estination of exports - Poland ... 16
Figure 8: D estination of exports - Slovakia ... 16
Figure 9: Top 10 export destinations - Czech Republic... 17
Figure 10: Top 10 export destinations - Hungary ... 17
Figure 11: Top 10 export destinations - Poland... 17
Figure 12: Top 10 export destinations - Slovakia ... 17
Figure 13: Diversity k(c,0) and average ubiquity of exported products k(c, 1)... 27
Figure 14: Evolution of country rankings for keo, k.2 ... ke ,18 ... . . . .. . . 30
Figure 15: Evolution of Economic Complexity Ranking depending on RCA threshold ... 33
Figure 16: Levels of dispersion from ECI sensitivity analysis ... 35
Figure 17: Dispersion of Export RCA by Product Complexity Index... 37
Figure 18: Matching bilateral oriented export baskets - Czech Republic ... 40
Figure 19: Matching bilateral oriented export baskets - Hungary ... 42
Figure 20: Matching bilateral oriented export baskets - Poland ... 44
Figure 21: Matching bilateral oriented export baskets - Slovakia ... 45
Figure 22: Density Distribution Transition vs. Undeveloped Products... 51
Figure 23: Density Distribution for V4 Countries ... 54
Figure 24: Density Distribution by Top Product Sectors... 56
Figure 25: D ensity D istribution by PCI... 58
Figure 26: Density Distribution for "V4 Combined" ... 59
Figure 27: Density Distribution for Germany... 60
Figure 28: Density Distribution by Top Sectors for "V4 Combined"... 61
Figure 29: Density Distribution by PCI for "V4 Combined"... 61
Table 1: Iterative measures of diversity and ubiquity using the Method of Reflections ... 24
Introduction
Personal motivations
Having strong personal ties to Hungary and Poland, we have decided to co-write our master thesis on the economic state of four countries located in Central Europe. These countries include the Czech Republic, Hungary, Poland and Slovakia and are commonly referred to as the Visegrad Group, or V4 countries, in reference to a meeting that occurred in 1335 between the kings of the then nations in the city of Visegrad, Hungary.
Since the fall of communism, V4 countries have undergone significant economic, political and societal transformations. In this thesis, our focus is on the economic aspect of these changes. Several macroeconomic studies have been conducted about V4 countries that use aggregate indicators of economic wealth and performance. These include, but are not restricted to, country reports done by major international organizations such as the World Bank, the OECD and the IMF as well as papers published by academia.
Our aim here is neither to write an additional paper focusing on these aggregate indicators nor to conduct a literature review of existing studies. Instead, we would like to offer a different understanding of these countries' current economic state and development perspectives using a novel empirical approach which relies on trade data and on connections between products and the capabilities they require. We use data available on the Observatory of Economic Complexity website run by the Macro Connections research team of the MIT Media Lab.
This theory we refer to in this paper has been developed ten years ago by four academics: C. Hidalgo, B. Klinger, A.-L. Barabisi and R. Hausmann. It was first outlined in an article published
in Science magazine entitled The Product Space Conditions the Development of Nations. We will
make further reference to this article in the theory explanation part of the thesis.
Throughout this paper, we analyze the countries in the following alphabetical order: the Czech Republic, Hungary, Poland and Slovakia, except when there is a rationale for doing otherwise.
Structure of the thesis
We have divided the thesis in three main parts in order to illustrate the past of V4 countries (where they come from), their current economic state (where they are now) and their future potential paths of development (where they could be heading to).
In the first part, we give an overview of V4 countries by describing the economic transformations they have experienced over the past 25 to 30 years after the fall of communism, notably the strong economic growth that happened subsequently. We then introduce the notion of the Visegrad Group, an alliance that is mostly political but that also puts forward elements of economic integration. Finally, we examine the exports of V4 countries and highlight similarities both in terms of top economic sectors and trade partners.
In the second part, we assess the level of economic complexity V4 countries have reached. We then test the robustness of such a ranking to further strengthen our analysis by varying the key parameter of the economic framework: the threshold above which a country exports a product with Revealed Comparative Advantage. Finally, we introduce a new view of trade relations, not only looking at trade balance from a quantitative point of view (i.e. in surplus or in deficit) but also from a qualitative standpoint (i.e. how does the complexity of a country's export basket to a given trade partner compare to the complexity of its import basket from that given partner).
In the third part, we apply the Product Space Theory to identify potential development opportunities and paths in the "near" future. We first look at proximities between products (i.e. the amount of capabilities two products share). We compute density values for our four countries (i.e. we estimate what fraction of required capabilities a country has developed around a new potential product). We compare the paths of development between V4 countries in terms of likeliness of developing products (depending on sectors, complexity of products...). We then examine a consolidated view of the region and try to identify where the opportunities would lie should there be more economic integration going forward.
Based on this three-part study, we finally formulate a set of national as well as regional policy recommendations that we believe are relevant given the results of our analysis.
Preliminary view on V4 Countries
From the Eastern Bloc to the European Union
Countries from the former Eastern Bloc have undergone an impressive transformation since the collapse of the Berlin Wall. In particular, Poland and Hungary as well as the Czech Republic and Slovakia (the former Czechoslovakia) were among the first and the most successful to realize a radical regime change, both politically and economically.
From a political perspective, Hungary was the first country to open its borders with Austria in the course of summer 1989, unleashing a wave of reforms and regime changes throughout the Central and Eastern European satellite communist countries. This would eventually lead to the collapse of the Soviet Union in 1991 and the separation of the Czech Republic and Slovakia in December
1992. These institutional reforms have been strengthened by the integration of V4 countries in the
European Union in 2004. While Slovakia adopted the Euro in 2009, none of its above mentioned neighbors has yet followed on.
Post-communist governments in Central and Eastern Europe were eager to show the world that they had turned the page of Soviet rule over their countries. That is the reason why Hungary, Poland and the Czech Republic demanded their inclusion into the North Atlantic Treaty
Organization (NATO) soon after the regime change and were given full membership in 1999,
followed by Slovakia in 2004. Similarly, membership into the Organization for Economic Cooperation and Development (OECD) was granted to these countries in the 1990s and early 2000s, after a dedicated period during which OECD had set up a special program called "Partners in Transition" to help the governments of Hungary, Poland and Czechoslovakia successfully engage their countries on the path of liberal capitalism after forty years of communist rule.
Geographically speaking, the Central and Eastern European countries are strategically located, at the crossroads between Western Europe and Russia. They are on the trajectory of several transport corridors, both in terms of goods, energy and people. The latter category has been particularly topical recently, as the public opinion saw the flow of refugees and migrants, coming from Africa and the Middle East, transit through Hungary.
Central European countries had another major comparative advantage in the early 1990s: their educated yet affordable labor force. Compared to other low-cost countries across the world, the
Czech Republic, Hungary, Poland and Slovakia had a relatively well-educated population, which, once trained to modern management techniques, would prove of great value to Western European companies looking for new places to relocate their manufacturing activities. This produced a shift of focus in the Western hemisphere from regions like Sub-Saharan Africa towards Central Europe.
A famous African quote deplored and summarized this sudden pivot: "Adieu Bangui, bonjour
Varsoviel".
From an economic perspective and despite variations in terms of timing, scope and political agenda, these Central European countries have overall quickly abandoned their former socialist models to transit towards a more liberal form of capitalism, through privatization of state-run companies and efficient labor reforms, allowing them to unlock their underlying strengths (educated yet affordable labor force, geographical position between Western Europe and Russia, cultural homogeneity with European partners...).
These successful reforms attracted Western European companies and brought them to invest in the region in the form of Foreign Direct Investment and other capital vehicles. In particular, sectors such as the automotive industry as well as back-office activities for banks and multinational companies have greatly benefited from foreign investments, building upon existing capabilities to create new ones and raising productivity across the region. As mentioned in a special report on the Central and Eastern European region published by the McKinsey Global Institute in 2013, "Foreign companies brought not only money to capital-starved industries, but also technology, managerial expertise, and the ability to exploit economies of scale" 2. These changes had several
positive spillover effects across a wide range of industries.
A special point is worth to be made here about the privatizations of state-run companies in Central
and Eastern Europe and the political agendas that have determined their schedule, form and extent. Transforming former socialist countries into market-oriented economies was not a small challenge. Across the region, long-term objectives had been determined for decades by state planned economic policies (five-year plans) often dictated directly by Moscow in the context of
I"Good bye Bangui, hello Warsaw". Bangui being the capital of the state of Central Africa and Warsaw the capital of Poland, this sentence mostly emphasized the understanding that the fall of communism had given birth to a new area in which economic development and foreign investments would be increasingly going towards Central and Eastern Europe rather than Africa. From Sylvie Brunel, L 'Afrique: un continent en reserve de developpement, 2004
COMECON3. After the fall of communism, the inefficient and bureaucratic nature of state-run
companies appeared to be a significant threat to the ability of these countries to engage on the path of market-based development and growth. Although privatizations occurred all across the 1990s in most Central and Eastern European countries, some like Hungary have experienced a more consequential earlier wave due to their willingness to experiment reforms in that field in the 1980s before the fall of communism. Others countries like Poland have known multiple, but slower, phases across the last 25 years with still a large number of state-run companies in place as of today. As a result of these efforts, which included several layers of institutional and market reforms, countries in Central Europe have been able to unlock their potential. Between 1995 and 2014, in a time frame of 20 years and according to IMF World Economic Outlook data, GDP per capita more than tripled in the Czech Republic ($19.8k) and Hungary ($14.0k), nearly quadrupled in Poland
($14.3k) and was multiplied by five in Slovakia ($18.5k) 4.
Between 1993 and 2015, GDP annual growth rates averaged 2.5% in the Czech Republic, 2.1% in Hungary, 4.2% in Poland and 4.1% in Slovakia, compared to an average 1.7% in the European Union as a whole.
On average over the 1993 to 2015 period, annual Foreign Direct Investment (as a percentage of
GDP) culminated in Hungary (8.7%), followed by the Czech Republic (4.5%)., Slovakia (3.5%)
and Poland (3.30%)6. These figures appear particularly high when compared to FDI rates going into BRIC economies over the same period: on average, annual FDI reached 2.8% of GDP in Brazil,
1.9% in Russia, 1.3% in India and 3.9% in China.
Key infrastructure capabilities have been established in the region over the last quarter of a century, such as Hungary's highway system covering 1,100 kilometers within the country and connecting Budapest to all major borders with neighboring countries. Dense industrial clusters have been created around competitive and high-tech sectors, such as the automotive industry in all four countries but also the aerospace industry in the Czech Republic and Poland. Other business areas are gaining importance too, such as electronics and back-office activities.
3 COMECON, or Council for Mutual Economic Assistance, was the economic organization that the Soviet Union used
from 1949 to 1991 to impose its views on the economic development and activities of its allies within the Eastern Bloc.
' The World Bank data.
5 Idem.
Overall, the Central and Eastern European region has undergone what the McKinsey report calls "a remarkable journey" since the fall of communism. This conclusion must however be mitigated
by some important factors that might seriously affect the region on the long run. The first one is
economic and refers to the significant brain drain that the West has been exercising on the young and skilled population of these countries. The second drawback is about the new political landscape arising in Central Europe. Without expressing any political opinion, it can be stated that populist far-right parties have gained more importance in the region. This can be explained by both the aftermaths of the world financial crisis, which has heavily hit some of these economies, and by the more recent refugee and migration crisis which was used by these parties to support their nationalistic, anti-European rhetoric. Whether this change in the political spectrum will affect the economies of these countries still remains to be seen.
The Visegrad Group: a centenarian idea
In addition to the geographic and historical rationale for studying the Czech Republic, Hungary, Poland and Slovakia jointly also lies a geopolitical argument, as evidenced by the so-called Visegrad Group that these countries form together. We will briefly present this group in the subsequent paragraphs. One of our objectives through this thesis is to see whether there is also an economic and capability justification for offering a joint vision of these countries, beyond the geopolitical perspective.
The origin of the Visegrad appellation goes back to the Middle Age. In 1335, the kings of three important Central European countries (i.e. Bohemia, Poland and Hungary) met in the castle of Visegrad on top of a hill in the famous Danube bend that lies north of Budapest. This meeting had been initiated by Hungarian king Charles I of Anjou and aimed at resolving tensions that had been mounting up between the kingdoms of Bohemia and Poland. Several peace treaties and other official documents attesting of an agreement of mutual assistance in case of conflict with a third country were signed in Visegrad during the month-long meeting and celebrations. As such, this can be considered as one of the earliest international peace conferences in Central Europe.
It is to this historical origin and source of pride regarding the past diplomatic achievements of their respective countries that the leaders of Czechoslovakia, Hungary and Poland decided to refer to in
1991 when the fall of communism provided a new avenue for exploring paths of cooperation in
were identified to be the main rationale for closer cooperation in the future. The 1991 Visegrad Declaration sets as a priority the "elimination of all existing social, economic and spiritual aspects of the totalitarian [communist] system" and the "creation of a modern free market economy". The same declaration lists a set of tasks to be undertaken by the signatories, which includes the following:
"in order to support free flow of labor force and capital, they shall develop economic cooperation, based on the principles of the free market, and mutually beneficial trade in
goods and services, moreover they shall strive to create favorable conditions
for
directcooperation of enterprises and foreign capital investments, aimed at improving economic
7,
effectiveness
Economic cooperation was therefore part of the joint endeavor from the very beginning and lies at the heart of what has since then become known as the Visegrad Group. The 1991 Declaration also emphasizes the fact that this framework for cooperation shall not be in any way an obstacle to cooperation with other countries. On the contrary, it is considered as a catalyzer for wider regional cooperation as well as a vehicle for facilitating the long term integration of the signatories and their neighbors in the European Union.
After the separation of the Czech Republic and Slovakia in January 1993, the Cooperation Agreement was enlarged to four partners, which led the Visegrad Group to be commonly referred to as "Visegrad Four" or V4. Today these countries collectively amount to c. 64 million inhabitants8 and their aggregated Gross Domestic Products add up to c. $870bn9.
Despite these initiatives and economic developments that support the political willingness for unifying these four countries, some drawbacks need to be highlighted. The Visegrad countries still remain fragmented markets where "rolling out a cross-border business, even through consolidation, often remains a slow and challenging process" j, as explained in a 2014 report published by the KKR Global Institute. Each partner country has its own national language and currency (except for Slovakia which has adopted the Euro as indicated earlier) as well as its own
7 Visegrad Declaration, February 15, 1991
8 Population in number of inhabitants according to 2015 World Bank data: 10.6 million in the Czech Republic, 9.8
million in Hungary, 38 million in Poland and 5.4 million in Slovakia.
) GDP in current US$ according to 2015 World Bank data: $185bn in the Czech Republic, $122bn in Hungary,
$477bn in Poland and $87bn in Slovakia.
institutional framework, which might hinder further economic integration and ease of doing business across borders.
V4 economies are heavily reliant on exports
In addition to the political mandate clearly stated above by the signatories of the Visegrad Declaration with regards to cooperation in framing economic policy, we find that empirical data provides additional economic rationale for considering these countries collectively in the frame of this study. In this section, we analyze the exports of the Visegrad countries and outline that their economies are (1) heavily reliant on exports and (2) strongly interdependent in terms of foreign trade. We describe the composition of their respective export baskets and then analyze the destination of these exports. We use export data from the Observatory of Economic Complexity website".
The composition of export baskets - main product categories
We first consider the composition of the basket of products that V4 countries export. Figures 1 to 4 offer a summary view of the key product sectors being exported using a low level of granularity.
Czech Republic Hungary
1.90Maines
2.06b T~upwlai
r2 - :T rmisportation
21% EMetala
EPlastics aid Rubber
40 aenicalProducts a Foodstuffs uTextiles *MineralProducts Paper Goods Stoneand Glass Odher
Figure 1: Basket ofexports - Czech Republic
.1%/6\ aMachines
5" NTransportation
D'A. w anical Products
aPlastics ad Rubber EMetal. 1insuranets mFoodstuffs mMuaai Products uVegetable Products SAninal Products Otia
Figure 2: Basket of exports - Hungary
" Observatory ofEconomic Complexity website, Macro Connections, MIT Media Lab: http://atlas.media.mit.edu/en/
Slovakia
UMachines 10 9,6%es
16J% UTraispolation MTransportation
*dhaicalProducts 0M tals
0Plastics nd Rubber mPlastics aid Rubber
EMetals uMincralProducts
3Foodstuffs EmuanicalProducts
mANminalProducts mTectile
*Mueral Products mPaperGoods
a Paper Goods aFoodtuffs
Vegetable Products f Inuntsds
Other (Nher
Figure 3: Basket of exports - Poland Figure 4: Basket of exports - Slovakia
Overall in 2014, the Czech Republic exported $162bn (and ranked 3 0th among 220 countries in
terms of dollar size of exports), Hungary $106bn (3 7 th), Poland $206bn (2 4th) and Slovakia $78bn
(4 2nd)
Machines and Transportation were the main product sectors being exported by V4 countries, ranging between 25 to 40% and 14 to 28% of exports respectively. A more detailed study of any individual sector would be required to understand the precise patterns of imports, local manufacturing and exports as well as origins and destinations of these trade flows. This is not our aim here. However, the fact that these low-level granularity product categories are identical for these countries may hide significant local specificities worth highlighting.
For example, in the case of Machines, at a medium level of granularity, key export products for Hungary include Spark-Ignition Engines and Combustion Engines, unlike for the Czech Republic, Poland and Slovakia where Computers, Insulated Wire, Video Displays and Telephones are more significant.
In the case of Transportation, Cars and Vehicle Parts make up a significant portion of V4 exports. However, Poland also exports Passenger and Cargo Ships, which accounted for 1.7% of its total exports in 2014 and for which it ranks as the fourth largest exporter in the world after South Korea, China and Germany.
Nonetheless, at a low level of granularity, the export baskets of V4 countries have a relatively comparable composition, despite significant variations in total value of exports due partially to country sizes. It is our objective in this paper to strengthen our understanding of these patterns by characterizing the economic complexity of these countries.
The composition of export baskets - main export destinations
We now consider the countries towards which V4 countries export their products. Figures 5 to 8 exhibit, in terms of foreign trade, the exposure of V4 countries to Europe in general and to Germany in particular.
Germany holds a primary role for all Visegrad countries as the dominant destination of their exports (i.e. between 22% and 31% of total exports). Similarly, the European continent as a whole absorbs between 83% and 88% of their exports, showing a strong local exposure and a low level of geographic diversification. Czech Republic 13,0% Hungary U Genuany " V4 partners " Other European colutries
a Rest of the world
Figure 5: Destination of exports - Czech Republic
Poland 13% q 45,0% aGernwany 0 V4 partners =other Euiopean countres * Rest of the world
Figure 6: Destination of exports - Hungary
Slovakia 14,011 50.4~,
w
MGennany * V4 partners mOther European coutitnes " Rest of the world12,0% 42.90 * Gernmy " V4 partners * Othet European countries a Rest of the world
Figure 7: Destination of exports - Poland Figure 8: Destination ofexports - Slovakia
It is also worth mentioning the strong inter-connections between the Visegrad countries themselves in terms of exports. The most striking dependency towards neighbors occurs in the case of Slovakia (as displayed by Figure 8) which shows how its three V4 partners are second to Germany as main export destinations and collectively account for a higher share of exports than Germany itself
Similarly, V4 partners' collective share of export destinations stands at 15.3% for the Czech Republic, 11.0% for Hungary and 10.6% for Poland.
In order to get a more granular view of the outbound foreign trade landscape of V4 countries, we have chosen to present in the below graphs the top ten export destinations for each country (Figures
9 to 12).
Czech Republic
Hungary 2.8% Russia 3.3% 6 Netherlands 3.5% Italy 3.8% Austria 4,3Po UnitedKingdom 5% France 532% Poland 5,2% Slovakia 7.3% Gennany 31% 0% 10% 20% 30% 400oFigure 9: Top 10 export destinations - Czech
Republic
Poland
Hungary 2,50/ Spain) 2,5% Swedai 2,600 Netherlands 2.6% Russia 4,2% Italy 4,6% France 5,6% Czech Republic 5.9% UnitedKingdom 6.3% Gennany 25% 0% 10% 20% 30% 40%Figure 11: Top 10 export destinations - Poland
Hungary
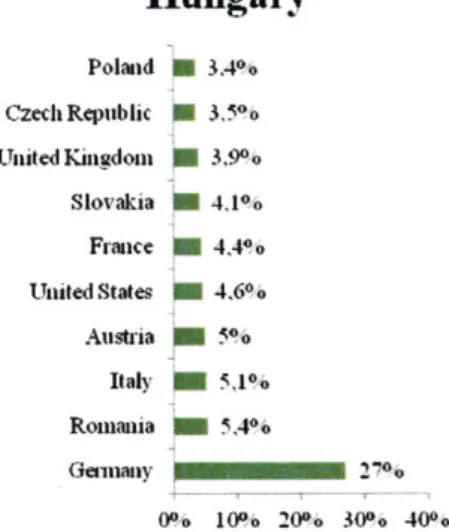
Poland U 3.4% Czech Republic 1 3,5% United Kingdom O 3.9% Slovakia 4,1% France 4,4% United States W 46% Austria P 5% Italy 5,1% Romania 5,4% Ge %.any 24 0 0% 10% 20%. 30% 400.Figure 10: Top 10 export destinations - Hungary
Slovakia
China 1 2,8% Russia 3.6% United Kingdom 5% Italy 5.1% Austria 5.4% Fraice 5,4% Hungay 6% Polaid 6,2% CzechRepublic 11% GermanyI22%
0% 10% 20% 30% 40%Once again we notice the heavy reliance on European partners as main export destinations. For the Czech Republic and Poland, there are only European countries among their Top 10 trade destinations. Germany, as we have already seen earlier, is the top export destination for all V4 countries. Beyond that however, rankings vary but the main export destinations remain the same: France, the United Kingdom, Italy and Austria are always among the Top 10. Most of the time, V4 partners also rank among the main export destinations of each other (except for Poland, where
Slovakia is not among the Top 10 but does not stands far behind, ranking n0 12).
We are not discussing here the general composition of the import baskets of these countries. Neither are we discussing the origins of their imports. However, we will later in this paper compare the baskets of exports and imports between selected countries in terms of their economic complexity, which we believe is relevant in understanding the nature of the trade relations that characterize V4 countries and their trade partners.
Case Analysis: The Hungarian -German trade relations in the automotive industry
We briefly analyze the trade relations between Hungary and Germany in the automotive sector. This particular case offers the advantage of exploring some potential patterns of bilateral partnership and industrial specialization, while highlighting the important exposure of Hungary towards Germany in terms of foreign trade. It is also representative of the set of bilateral trade relations that other V4 countries have with Germany, thus being an adequate characterization of the region's import-export landscape with regards to the automotive industry.
In 2015, Cars, Vehicles Parts, Spark-Ignition Engines, Combustion Engines and Engine Parts collectively accounted for 24% of Hungary's exports'3 and 12% of its imports14. This subset of
product categories therefore constitutes a large enough share of Hungary's industrial and trade activities while being a good approximation for the automotive industry as a whole.
To illustrate the relations between Hungary and Germany with regards to the automotive industry, we first study the trade flows for the following two product categories: Cars and Vehicle Parts. These are heavily inter-related product categories since they are sequential in the value chain of automobiles (i.e. Vehicle Parts are necessary to manufacture Cars). In 2015, Hungary exported
13 2015 exports for Hungary included: Cars (12%), Vehicle Parts (5.2%), Spark-Ignition Engines (3.3%), Combustion Engines (2.8%) and Engine Parts (0.85%). Source: Observatory of Economic Complexity website.
14 2015 imports for Hungary included: Cars (2.6%), Vehicle Parts (5.8%), Spark-Ignition Engines (0.6%),
Cars for a total value of $11.5bn, making it the 14"' largest automobile exporter in the world with
1.7% of global exports1 5. Significantly enough, 33% of Hungary's automobile exports went to its
major trade partner Germany. In terms of Vehicle Parts, which are a product category encompassing several sub-categories necessary to manufacture and assemble Cars, Hungary was the world's 16"' largest importer (i.e. 1.5% of global imports reaching $5.2bn in 2015). Germany is by far the main country of origin, representing 48% of Hungary's Vehicle Parts imports. When we look at the Product Complexily Index16 (or PCI), we observe that Vehicle Parts are more
complex than Cars (PCI of 1.09 versus 0.806).
These two data facts are most insightful when accompanied by a deeper industry-specific understanding of the two countries' economic relations. In its 2014 list of the Top 500 Hungarian companies'7, the Hungarian economic newspaper HVG ranked the local subsidiaries of Audi and
Mercedes Benz among the five largest Hungarian companies in terms of 2014 revenue (respectively n'2 and n'5). Audi is the main employer in the North-Western part of the country, with several manufacturing sites in the city of Gy6r, where it has been present since the early 1990s. Mercedes Benz decided in 2008 to establish manufacturing and assembly lines in the central part of the country near the city of Kecskemdt and currently employs over 4,000 people on site. Even more striking is the fact that 99.96% and 99.68% of 2014 revenues for the two local subsidiaries of Audi and Mercedes Benz came from international sales, as stated by HVG. Together with the export data between Hungary and Germany exposed above, this suggests that Hungary serves as a "backyard" manufacturing country for large German automobile companies, which import complex Vehicle Parts from Germany, manufacture and assemble them locally before re-exporting finished Cars towards Western European markets. This also confirms the common understanding of how the German automobile industry was able to climb the value chain
by focusing more on Research and Development and design activities while relocating
manufacturing and assembly tasks to Central and Eastern Europe, notably the Visegrad countries.
" For comparison purposes, other V4 countries ranked I11th (Czech Republic with 2.4% of global exports), 13th (Slovakia with 1.9%) and 17th (Poland with 0.9%). Germany is the world's largest exporter of automobiles with
27% of global exports.
6 The Product Complexity Index (PCI) is an iterative measure incorporating a product's ubiquity and the diversity
of its exporters, obtained using the Method of Reflections as described in Hidalgo and Hausmann (2009). Source:
Observatory of Economic Complexity website
We now focus on three additional sub-categories of products (Spark-Ignition Engines, Combustion Engines and Engine Parts), which are cssential components in the automotive value chain. Engine Parts are used to assemble Spark-Ignition Engines and Combustion Engines, which are both required to manufacture Cars'8.
Hungary is the world's 71h largest importer of Engines Parts (3.6% of global imports amounting to
$2.27bn in 2015)19. It imports Engine Parts from Germany (62%) and from its V4 partners (collectively 10%). These products are then used to manufacture Engines mostly for exportation purposes or local assembly of Cars. Indeed, Hungary is the world's 51h largest exporter of
Spark-Ignition Engines (7.9% of global exports20) and the world's
6th largest exporter of Combustion
Engines (5.8% of global exports21). The most compelling fact is once again the destination of these exports: 52% of Spark-Ignition Engines and 61% of Combustion Engines produced in Hungary are exported towards Germany. A respective additional 11.6% and 17.3% per product category are exported towards V4 partners.
These figures not only show the important exposure of Hungary's Engine exports towards its regional trade partners and especially Germany, they also bring additional evidence of how German automobile companies have decided to relocate their manufacturing activities to Central and Eastern European neighbors that serve as industrial "backyards". In 20 years, Audi, for example, has manufactured over 25 million engines in its Hungarian plant in Gy6r.
Hungary benefited from this industrial "offshoring". German car manufacturers drained into the country all their major suppliers, contributing to the creation over time of a competitive industrial ecosystem within the automotive landscape, with technical know-how and skilled labor. A similar case can be made for other V4 countries. The Czech Republic, for example, has largely benefited from the Volkswagen takeover and turnaround of local car manufacturer Skoda in the early 1990s.
18 In this classification, Spark-Ignition Engines refer to petrol engines, whereas Combustion Engines might include
other compression-ignition based engines such as diesel engines.
19 For the sake of comparison, Germany is the largest importer of Engine Parts with 9.7% of global imports. Poland is n'12 with 2.4% and the Czech Republic is n'22 with 1.3%.
2 The United States ranked n'1 with 14%, followed closely by Germany and Japan (12% each of them) as well as
Mexico (9%). V4 partners' share of global exports of Spark-Ignition Engines: 1.4% for Poland (n'13), 0.68% for the Czech Republic (n l19) and 0.68% for Slovakia (n'20).
2 Behind the United States (15%), Germany, Japan, the United Kingdom and France. V4 partners' share of global exports of Combustion Engines: 5% for Poland (n'8), 1.1% for Slovakia (n'16) and 0.43% for the Czech Republic (n'20).
Nonetheless, from a macroeconomic perspective, this trend illustrates the state of bilateral economic and trade relations in the region as well as the specialization of "backyard" countries in sectors where their relative comparative advantage is higher, allowing Germany to focus on higher value-added activities such as Research and Development.
V4 Countries through the prism of Economic Complexity
Introduction to the Product Space and the Theory of Economic Complexity
In this part we describe the theory that underlines our analyses by introducing the key concepts defined by C. Hidalgo, B. Klinger, A.-L. Barabisi and R. Hausmann in their article entitled The
Product Space Conditions the Development of Nations and published in Science magazine in 2007.
The concept of Revealed Comparative Advantage
Country c is said to export product p with Revealed Comparative Advantage22 when the ratio of the relative weight of product p among its own exports to the relative weight of product p in the world economy (i.e. total global exports) is above a certain threshold T (in our base case T = 1). This ratio is given by the equation stated below in which x(c,p) represents the export value of product p by country c.
x(c, p)
)px(c,p)
RCA(c,p) = EcX(c) CP x(c, p)
We make the difference between the ratio itself, which we refer to by the acronym RCA, and the situation when this ratio is higher than the pre-determined threshold for a given country-product pair (RCA > T), in which case we say that "country c has a Revealed Comparative Advantage in product p".
The country-product matrix
The Theory of Economic Complexity is based on the assumption that countries develop
capabilities, which will then allow them to produce and export certain products. There are two sets of connections that can both be represented in matrices filled with binary elements. The first matrix connects products and the capabilities they require. The second matrix connects countries and the capabilities they have developed. Since capabilities are difficult to list and perceive, these two matrices are purely theoretical. However, they can be combined to form a third matrix that
2 The Product Space Conditions the Development of Nations, C. Hidalgo, B. Klinger, A.-L. Barabdsi and R.
connects countries with the products they export. Such a matrix can be empirically constructed using appropriate trade data.
We call M the matrix connecting countries to the products they export. For any given pair of country c and product p, Mc, = I if country c exports product p with Revealed Comparative Advantage and Mc,p = 0 otherwise.
How diversified is country c?
The level of diversification of a country is the number of products that it exports with Revealed Comparative Advantage. Illustratively, for a country c this is the number of elements that take 1 as a value on the cth line of the M matrix.
k(c, 0) = M(c, p)
P
A preliminary hypothesis would be that the higher the level of diversification of a country, the
more complex its economy. However, this metric alone does not account for the qualitative differences that may arise between the baskets of products exported by two countries having
similar levels of diversification. This leads us to introduce the concept of ubiquity.
How ubiquitous is product p?
The ubiquity of a product is the number of countries that export it with Revealed Comparative Advantage. Illustratively, for a product p this is the number of elements that take I as a value on the p"t column of the M matrix.
k(p, 0)= M(c, p)
C
Arguably, ubiquity is a good measure for the sophistication of a product, since products exported
by many countries probably require a set of less sophisticated capabilities, whereas products
exported by a few countries may require a set of capabilities that only some have managed to
Iterative measures of diversity and ubiquity: the Method of Reflections
In order to reach a more accurate measure of the complexity of a country's economy, Hidalgo and Hausmann introduce the Method of Reflections23 which consists of combining the concepts of diversity and ubiquity in an iterative way. This is due to the fact that the iteration allows to take into account the ubiquity of the products exported by a given country and the level of diversification of the countries exporting these products.
Measures Explanation
k(c, 0) = I M(c, P) Diversity of a country
1~ - Number of products that it exports with RCA T
k(p, 0) = M(c, P) Ubiquity of a product
-* Number of countries that export it with RCA T
1 Ubiquity of a country's export basket
k(c, 1) = k(C 0) 1 M(c, p)k(p, 0) 4 Average ubiquity of products exported by country c with
P RCA T
1 Diversity of the set of exporters of a product
k(p, 1) = k(p, 0) 1 M(c, p)k(c, 0) 4 Average diversity of the countries exporting product p with
c RCA> T
1 Diversity of exporters of a country's export basket
k(c, 2) = k(c, 0) M(c, p)k(p,41) Average diversity of countries exporting with RCA T the
P products exported by country c with RCA T
1 Ubiquity of export baskets of a product's exporters k(p, 2) = k(p, 0) 1 M(c, p)k(c, 1) 4 Average ubiquity of products exported with RCA T by
C countries exporting product p with RCA T
1 Country information
k(c, n) = k ) M(c, p)k(p, n - 1) - n is even (0,2,4...): measure of diversity
P + n is odd (1,3,5...): measure of ubiquity of exports
1 Product information
k(p,n) = 0) M(c, p)k(c, n - 1) 4n is even (0,2,4,...): measure of ubiquity
k(p, 0)
n is odd (1,3,5...): measure of diversity of exporters
Table 1: Iterative measures of diversity and ubiquity using the Method of Reflections4
23 The building blocks of economic complexity, C. Hidalgo and R. Hausmann, Proceedings of the National Academy
of Science, 2009 24 Idem.
Methods and data
We use cleaned data available on the Observatory of Economic Complexity website at a medium level of granularity2 5. The data is generated by the United Nations Statistical Division
(COMTRADE), and subsequently cleaned by BACI International Trade. It is harmonized to reconcile the declarations of exporters and importers and therefore to reach a more complete dataset26.
Although this data is from 2014, the fact that it has been cleaned and used by the Observatory qf
Economic Complexity means that it is simpler for us to use in the context of this one-year master
thesis.
For analyses purposes, we consider two different datasets. The first dataset contains export data for 219 countries2 7 and over 1,200 products. We use it for the main part of our analysis (i.e. for the
computation of the Economic Complexity Index, for sensitivities around RCA thresholds and for prospective analyses around the concepts of density and proximity). The second dataset contains bilateral export information and is therefore "heavier" due to its higher level of granularity. Practically, this means that we look at 219 countries exporting over 1,200 products towards one another. We use this dataset for our qualitative trade balance analysis and restrain it to European countries for clarity purposes.
We conducted our analysis on a free statistical software called R using the two datasets mentioned above combined with two additional datasets containing product and country name information. Additionally, we use the Product Complexity Ranking available on the Observatory of Economic
Complexity. Such a ranking is generated for the HS07 dataset at a 4-digit product level
specification for 2014. We also use an openly available dataset from the World Bank containing 2014 GDP per capita information.
The data analysis part constituted the major part of our research for this thesis, alongside familiarizing ourselves with the Theory of Economic Complexity.
2
4-digit depth data from the HS6 REV. 2007 (2008 - 2014) dataset 26 http://www.cepii.fr/CEPII/fr/publications/wp/abstract.asp?NoDoc=2726
27 We then limit our rankings to the 145 countries for which the Observatory of Economic Complexity restrains itself.
Relevance of the Theory of Economic Complexity for V4 countries
We have seen in the first part of this paper that V4 countries are heavily reliant on foreign trade. Indeed, exports of goods and services, as expressed in percentage of GDP, accounted for 83% of
GDP in the Czech Republic, 90% in Hungary, 50% in Poland and 93% in Slovakia in 201528.
V4 countries being large exporters, there is a strong rationale for introducing an export-based empirical study of the structure of their respective economies. The Theory ofEconomic Complexity offers this possibility by pairing countries with the products they export and by using the Method of Reflections explained above to produce measures of their economic complexity. This theory has not yet been applied in the frame of a study dedicated to these four countries, allowing us to bring a novel, enriching approach to better understand them.
Furthermore, it is our objective in this paper to offer a joint view of what the economic complexity of V4 countries could be if considered in a combined way, as their common regional appellation and political agenda would suggest. This idea was driven by the example of a regional study made
by C. Hidalgo in 2011 in which he used the Theory of Economic Complexity to analyze five
countries (Kenya, Mozambique, Rwanda, Tanzania and Zambia) both individually and in a joint regional approach:
"We study the collective regional position of these countries in the product space in an
attempt to identify the opportunities that would be unveiled if the productive structures of these countries were to be combined. Since the capacity of a country to discover a good depends on the goods that it is already exporting, the industrial opportunities that appear as natural next steps for these countries will be different depending on whether we examine
them as independent units or as a single integrated economy.'' 29
In this thesis, we conduct a similar combined analysis of the productive structure of the V4 region as a whole in an attempt to unveil potential new industrial opportunities that could lie ahead of the member states if their economies were to be more integrated with those of their neighbors.
28 The World Bank data (2015)
29 Discovering Southern and East Africa's Industrial Opportunities, C. Hidalgo,
GMF Economic Policy Paper
Diversified countries producing complex products
Figure 13 shows the position of countries in the "kc,o versus kc,1" space. This space is defined by the level of diversification (ke,o) of a country and the average ubiquity of the products that it exports with Revealed Comparative Advantage (kc,1).
0 IRO 4TLS 45-* SSD 9HTI * SLE 0 SDN BEN * GHA *TCD GMBe TGO % I M* 'CMR * C
. SDI *ALQ TZA
*ECU *A oSEN * KEN
A NER *CA6 GEO I N Dom GTM OAZE 0 BA.pO * KGZ
eGAB A RM
*& N AAEMPZWE. PAN * E SLV * DASAU *
. 1W .MDG * MK JOR
* OMN H ,
* blG6D TJI* ZMB e
BHAQ~'L * MUS *Z NKVPAK
OBOL *UZB OPER 0 LVA
* MMORN 0 URY M EGY
*KWT *AUS *BLR o EST 0 BG
@ MFIkHL o UKR V CVNM IRL .ZA CAN * OU
eARG SVp IDN O HUN
o MEX :ISR a SV ,*NS 0 MYS a TH 0 QAT * KAZ * SGP * BRA * FIN 0 SV RTU DNK N A VE GBR 9 PAT TU pOL * NLD CZE N BLX AUT a UIND &USA * HKG 0 C1EKOR * JPN 150 300 Diversity 45O
Figure 13: Diversity k(c, 0) and average ubiquity of exported products k(c, 1)
Figure 13 shows that highly diversified countries tend to be so in products that are exported with Revealed Comparative Advantage by a relatively low number of countries (i.e. low kc,1), whereas poorly diversified countries export products that are produced and exported by many other
0 0. 0 0) 0) 5-* ESP FRA 0 TA 0 * DEU 0 CHN
countries as well (i.e. high k,,1). Based on the results exemplified in this figure and similarly to
what has been described in Hidalgo and Hausmann (2009)30, there appears to be a negative correlation between a country's level of diversification and the average ubiquity of the products it exports: average ubiquity tends to decrease as the level of diversification increases. An interpretation of this can be that "diversified countries will be able to make less ubiquitous products"3 1. This justifies introducing the categorization shown in Table 2 below.
Non-Diversified Diversified Countries Countries Producing Producing Standard
Standard Products Products
Non-Diversified Diversified Countries
Countries Producing Producing Exclusive Exclusive Products Products
Table 2: Categorization of countries introduced by Hidalgo and Hausmann (2009)
On average, countries tend to be positioned in the upper-left or lower-right corners of the categorization table introduced above.
In Figure 13, we have highlighted with color dots the position of the Visegrad countries, showing how they tend on average to be on the lower right corner of the "ke,o versus k,1" space. This confirms that they are highly complex economies, that is, "diversified countries producing exclusive products". While they export a relatively high number of products with Revealed Comparative Advantage (between 240 and 420 products), the average ubiquity of these export products is low (between 25 and 30 countries). However, at a higher-level analysis, the four countries tend to show somewhat different characteristics. Slovakia and Hungary are both less diverse and exporting less exclusive products than the Czech Republic. Poland has the highest level of diversification, but further analysis will show that its economic complexity is lower than that of its V4 partners after correcting for the size of its economy and taking into account the qualitative aspect of its exports using the Method of Reflections.
30 The building blocks of economic complexity, C. Hidalgo and R. Hausmann, Proceedings of the National Academy
of Science, 2009 3 Idem.
32 Idem. 3 Idem.
Economic Complexity Index and Ranking
In our analysis, we use k,.,18as the measure of a country's economic complexity (i.e. Economic
Complexity Index or ECI). Instead of showing the values themselves, we have ranked them and
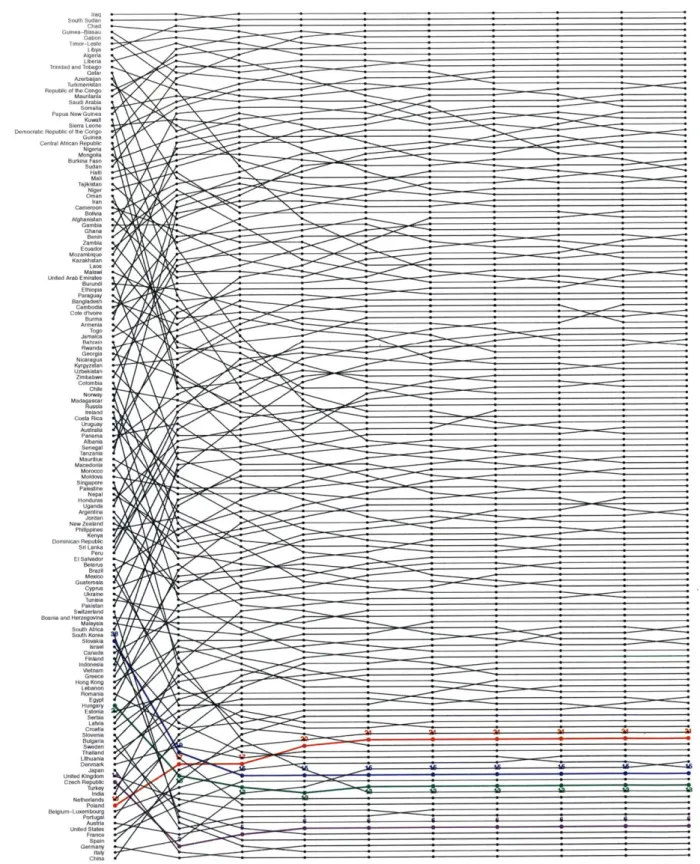
show the countries from last to first. Figure 14 shows the evolution of country rankings through several rounds of iterations for level of diversification measures ke o, kc,2, ... , kc18. The higher a country's Economic Complexity Ranking the lower that country appears on the list. We notice that
China ranks 1" for the level of diversification (i.e. kc,o). Yet, once we account for the size of the country and for the complexity of the products it exports, China falls to the 22 rank (i.e. for kc, 18).
On the opposite, Japan starts at the 16th position for the level of diversification but ends up being S't in terms of Economic Complexity Ranking.
Iraq South Suda Chad Guinea--Bissau Gabon Timor-Leste Libya Algera Liberia
Trinidad and Tobago
Qatar
Azerbaijan
Turkmenistan
Republic of the Congo Mauritanla
Saudi Araba
Somalla
iat
Papua New Guinea
Kuwait
Sierra Leone
Democratic Republic of the Congo
Guinea
Central African Republic Nigeria Mongolla Burkina Faso Sudan Haiti Mali Tajkistan Niger OmanIran Cameroon Afghanistan Gambia Ghana Ecuaday Mozambique Kazakhstan Laos Malawi
United Arab E mirates
Burundi Ethiopia Paraguay Bangladesh Cambodia Cote d'Ivoir: Armenia Togo Jamaia Bahrain Rwanda Nicaragua Kyrgyzsta Uzbekistan Zimbabwe Colombia Chile Norway Madagascar Russla Ireland Urgua Panam Albania Senegal Tanzania Mauritius Macedonia Morocco Moldova SingaporePalesin Argent a Jordan New Zealand Philippines Dominican Republic S rl Lanka P ru El Salvador Belarus Brazil Mexico Guatemala Cyprus Tunisia Pakist n Switzerland
Bosnia and Herzegovina Slovakia Israel Canada Finland Indonesia Vietnamn Greece Hong Kong Lebanon Romania Hungary Eaton Serb:a: Latvia Bulgaria Sweden Thailand Lithuania Denmark Japan United Kingdom Czech Republic Netherlands Poland Belgium-Luxembourg United States France German Italy China
Figure 14: Evolution ofcountry rankings for kco, k,2... kc,1
--- ::
11:<
Despite early volatility due mostly to country size (economy, population, territory...) and after a few iterations using the Method of Reflections, Visegrad countries tend to have a very stable ranking for subsequent levels of diversification. However, their patterns of stabilization vary significantly. Analyzing these patterns is a valuable source of information for understanding these countries.
The Czech Republic is initially ranked n'14 for kco, which is the measure of a country's level of diversification (i.e. the number of products that a country exports with Revealed Comparative Advantage). This is already insightful if we consider the small size of that country's economy and population compared to countries that are ahead in the rankings, which are either larger economies (such as China, India, Turkey but also Poland) or part of the more developed Western European region (such as The Netherlands and Austria).
After taking into account the average level of diversification of the countries exporting with Revealed Comparative Advantage the products that the Czech Republic itself exports with Revealed Comparative Advantage (i.e. after obtaining kc,2 from two iterations using the Method
of Reflections), we see that the Czech Republic climbs to the 3rd position. This is most certainly
due to the fact that its "peer exporters" described above are on average even more diversified than the Czech Republic itself. Additional rounds of iterations result in the Czech Republic quickly stabilizing as n'6 in successive measures of diversity.
Hungary follows a pattern of upward stabilization in the rankings, from n'27 to a stabilized n0 13.
Slovakia follows a similar pattern, from n'38 to n'15. This increase in comparative performance as measured by the rankings shows how these two economies are fairly complex despite their small size.
Poland's initial level of diversification ranks high (n 10). However, its position in rankings worsens as subsequent layers of product ubiquity and diversity of "peer exporters" are taken into account. This exemplifies how Poland, despite being a large economy compared to its V4 partners, exports products that are themselves exported by on average less diversified "peer exporters". On top of that, the ubiquity of its exports is also higher than that of its V4 partners. These are the primary factors that explain why its rankings for subsequent measures of diversity stabilize at a lower n'2 1.
Ranking sensitivity to Revealed Comparative Advantage threshold variations
The Economic Complexity Index is partly based on a certain RCA threshold T above which we
consider that countries have developed a Revealed Comparative Advantage in a given product. In previous studies, this threshold has been fixed at T=1. This level makes intuitive sense as it represents the limit above which the weight of a product in a country's export basket is higher than the weight of this product in the total exports of the world economy.
Yet, what would be the impact of changing the RCA threshold on the Economic Complexity
Ranking of the four countries we consider in this study? Indeed, setting a given RCA threshold
implies that, should a country exceed this threshold for a given product, we assume that it has developed all the required capabilities for that particular product. Yet, we could imagine a country having a high Economic Complexity Ranking as a consequence of exporting a vast number of relatively complex products with RCA slightly above the T=1 threshold. In this case, the ranking of that country would prove to be very sensitive to small variations in the threshold level.
In order to avoid such a fallacy, it is important to evaluate the robustness of these results. We therefore conduct a sensitivity analysis of the Economic Complexity Ranking to variations in the RCA threshold, varying from T=0.5 to T=2.0 with 0.1 increments. We run our model 16 times for the 16 RCA threshold values and report each of the rankings on a graph similar to the one we used to show the results of the Method of Reflections. The lower a country is on the graph, the higher
its Economic Complexity Ranking. At a 0.5 RCA threshold, Japan ranks first while South Sudan
ranks last.
South Suda
Iraq
Papua New Guinea
Surfn
Guna Democratic Republic of the Congo
Mauritania
Libya
Gabon
Republic of the COtgo Nigerta Momgotia Guinea- Bissau Liberia Ma l Burkina Faso Haiti Ghan Turkmenistan Mongolia Ethiopia Burma Mozarbique Azerbaijan Timor-Let Ecuado Madagatr Tanzania Nig r Cote d'vore Alger.a Afghanistan Sierra Leone Bangladesh Togo Nicaragua Benin Zimbabwe Gambia Tajik stan Cambodia Burundi Paraguay Trinidad and Tobago
Cameroon Senegal IMa Kyrgyzstan Randa Kenya Peru
Central African Republic Jamaica Morocco Uzbekistan UgandaOman Sri Lanka Honduras Albania Pakistan Do inapbli Guaemala Australla Kazakhstan Georgi Chi:: Armenia Kuwi Nepal Moldova Mauritius Panama Palestine IndonesiaQatar
United Arab Emirates
Macedonia
Figure 15RvltoioecnmcCmpeiyRninseedn n C hehl
Colombi ... Jordan South Attica New Zealand Argentina Tunisia Greece Lebanon Philippines
Bosnia and Herz g vn Il"'l"'ll"Il"Il"I... ... .. Bahran Inia Etvnia Bulgaria Potugd Cna Spi Jhalan R .o.ma7nia9 . . 12 13 1. . .8 17 18 . .