HAL Id: hal-01253627
https://hal.inria.fr/hal-01253627
Submitted on 11 Jan 2016
HAL is a multi-disciplinary open access archive for the deposit and dissemination of sci-entific research documents, whether they are pub-lished or not. The documents may come from teaching and research institutions in France or abroad, or from public or private research centers.
L’archive ouverte pluridisciplinaire HAL, est destinée au dépôt et à la diffusion de documents scientifiques de niveau recherche, publiés ou non, émanant des établissements d’enseignement et de recherche français ou étrangers, des laboratoires publics ou privés.
Phenomenal: a software framework for model-assisted
analysis of high throughput plant phenotyping data
Christian Fournier, Simon Artzet, Jérôme Chopard, Michael Mielewczik,
Nicolas Brichet, Llorenç Cabrera, Xavier Sirault, Sarah Cohen-Boulakia,
Christophe Pradal
To cite this version:
Christian Fournier, Simon Artzet, Jérôme Chopard, Michael Mielewczik, Nicolas Brichet, et al.. Phe-nomenal: a software framework for model-assisted analysis of high throughput plant phenotyping data. IAMPS 2015 (International Workshop on Image Analysis Methods for the Plant Sciences), Sep 2015, Louvain-la-Neuve, Belgium. �hal-01253627�
Phenomenal: a software framework for model-assisted analysis of high throughput plant phenotyping data
Christian Fournier1,2, Simon Artzet1,2, Jérôme Chopard1,2, Michael Mielewczik1,2, Nicolas Brichet2, Llorenç
Cabrera2, Xavier Sirault3, Sarah Cohen-Boulakia1,4, Christophe Pradal1,5
1 EPI Virtual Plants, INRA-INRIA-CIRAD, Montpellier, France; 2 UMR 759 LEPSE, INRA, Montpellier, France; 3 HRPPC, CSIRO Plant
Industry, Canberra Australia; 4 LRI CNRS 8623, U.Paris Sud, Orsay, France; 5 UMR AGAP, CIRAD, Montpellier, France
Plant high-throughput phenotyping aims at capturing the genetic variability of plant response to environmental factors for thousands of plants, hence identifying heritable traits for genomic selection and predicting the genetic values of allelic combinations in different environment. This first implies the automation of the measurement of a large number of traits to characterize plant growth, plant development and plant functioning. It also requires a fluent and versatile interaction between data and continuously evolving plant response models, that are essential in the analysis of the marker x environment interaction and in the integration of processes for predicting crop performance [1]. In the frame of the Phenome high throughput phenotyping infrastructure, we develop Phenomenal: a software framework dedicated to the analysis of high throughput phenotyping data and models. It is based on the OpenAlea platform [2] that provides methods and softwares for the modelling of plants, together with a user-friendly interface for the design and execution of scientific workflows. OpenAlea is also part of the InfraPhenoGrid infrastructure that allows high throughput computation and recording of provenance during the execution [3].
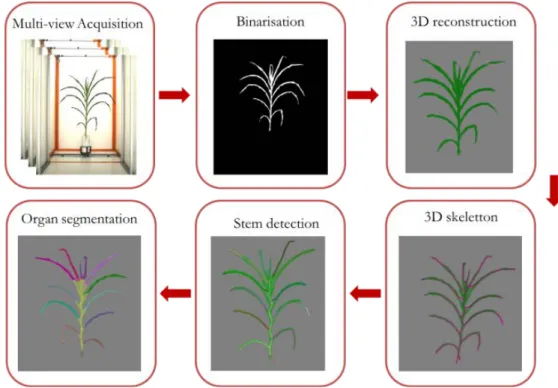
Figure 1: The 3D plant reconstruction and segmentation pipeline. Muti-view plants images from PhenoArch are binarised and used to reconstruct plants in3D. The 3D skeleton is extracted and separated into stem (central vertical elements) and leaves. 3D voxels are segmented by propagating skeleton segmentation.
Phenomenal currently consists of 2D image analysis workflows built with standard image libraries (OpenCV, Scikit.Image), algorithms for 3D reconstruction (Figure 1), segmentation and tracking of plant organs for maize (under development), and workflows for estimation of light interception by plants during their growth. The ADEL model [4], a 3D FSPM model for maize architectural development, is used to help segmenting plant images and to automate the mapping between segmented 3D objects and plant organs defined in the model. The 3D reconstructed model is combined with meteorological data to feed a light distribution model [5] and estimate light use efficiency. In the future, we plan to scale this approach to the analysis of more complex plants (wheat, rice) and more complex images acquired in the field. We also want to automatize the connection between plant response models and the data extracted from images, to get directly an estimation of the crop performance in a large range of context.
Références
[1] Parent, B. and Tardieu, F., 2014. Can current crop models be used in the phenotyping era for predicting the genetic variability of yield of plants subjected to drought or high temperature? Journal of Experimental Botany, 65(21): 6179-6189.
[2] Pradal, C., Dufour-Kowalski, S., Boudon, F., Fournier, C. and Godin, C., 2008. OpenAlea: a visual programming and component-based software platform for plant modelling. Functional Plant Biology, 35(9/10): 751-760.
[3] Pradal, C. et al., 2015. InfraPhenoGrid: A scientific workfow infrastructure for Plant Phenomics on the Grid. Future Generation Computer Systems (submitted).
[4] Fournier, C. and Andrieu, B., 1998. A 3D architectural and process-based model of maize development. Annals of Botany, 81(2): 233-250.
[5] Sinoquet, H., Le Roux, X., Adam, B., Ameglio, T. and Daudet, F.A., 2001. RATP: a model for simulating the spatial distribution of radiation absorption, transpiration and photosynthesis within canopies: application to an isolated tree crown. Plant, Cell and Environment, 24: 395-406.