Publisher’s version / Version de l'éditeur:
Vous avez des questions? Nous pouvons vous aider. Pour communiquer directement avec un auteur, consultez la première page de la revue dans laquelle son article a été publié afin de trouver ses coordonnées. Si vous n’arrivez pas à les repérer, communiquez avec nous à [email protected].
Questions? Contact the NRC Publications Archive team at
[email protected]. If you wish to email the authors directly, please see the first page of the publication for their contact information.
https://publications-cnrc.canada.ca/fra/droits
L’accès à ce site Web et l’utilisation de son contenu sont assujettis aux conditions présentées dans le site LISEZ CES CONDITIONS ATTENTIVEMENT AVANT D’UTILISER CE SITE WEB.
Optics Express, 28, 8, pp. 11946-11955, 2020-04-13
READ THESE TERMS AND CONDITIONS CAREFULLY BEFORE USING THIS WEBSITE. https://nrc-publications.canada.ca/eng/copyright
NRC Publications Archive Record / Notice des Archives des publications du CNRC :
https://nrc-publications.canada.ca/eng/view/object/?id=5a92e39b-7bc6-4891-b5c1-91867e74acd1
https://publications-cnrc.canada.ca/fra/voir/objet/?id=5a92e39b-7bc6-4891-b5c1-91867e74acd1
This publication could be one of several versions: author’s original, accepted manuscript or the publisher’s version. / La version de cette publication peut être l’une des suivantes : la version prépublication de l’auteur, la version acceptée du manuscrit ou la version de l’éditeur.For the publisher’s version, please access the DOI link below./ Pour consulter la version de l’éditeur, utilisez le lien DOI ci-dessous.
https://doi.org/10.1364/OE.388369
Access and use of this website and the material on it are subject to the Terms and Conditions set forth at
Oblique angle transient-reflectivity laser-scanning microscopy for
mineral imaging in natural ores
Oblique angle transient-reflectivity
laser-scanning microscopy for mineral imaging
in natural ores
A
DRIANF. P
EGORARO,
1D
OUGLASJ. M
OFFATT,
2 ANDA
NDREWR
IDSDALE2,*1Department of Physics, University of Ottawa, Ottawa, ON, K1N 6N5, Canada
2Molecular Photonics Group, Security and Disruptive Technologies Research Center, National Research
Council of Canada. Ottawa, ON, K1A 0R6, Canada
Abstract: The microscopic arrangement of different minerals in ores is of high interest for mine
planning, mineral processing and extractive metallurgy. Many economically important, naturally occurring minerals are highly absorbing semiconductors. To characterize these materials, we have implemented pump-probe laser scanning microscopy (LSM) in a two-lens reflective configuration that offers efficient collection of signal light by using a combination of galvanometer and sample stage scanning. We show that the short-time (∼10 ps) pump-probe response of a material allows us to distinguish economically important sulfide minerals.
© 2020 Optical Society of America under the terms of theOSA Open Access Publishing Agreement
1. Introduction
Planning new mines and optimizing mineral processing and metal extraction from ores increasingly utilizes high-throughput microscopic imaging for discrimination of mineral types (automated mineralogy) [1] with application-optimized scanning electron microscopes employing energy dispersive X-ray spectroscopy (SEM-EDS) being the primary tool of choice [2–4]. In this type of microscopy, samples are ground into particles that are dispersed and embedded in resins. Alternatively, samples can be prepared as sections which are polished prior to imaging. These approaches can be supplemented by optical identification of minerals by skilled mineralogists. Optical mineralogy relies on polarization and color sensitive techniques in both reflection and transmission of polished thin sections which are typically 30 µm thick [5]. We have recently demonstrated [6] that nonlinear optical microscopy can provide complementary information to more traditional approaches; by using second harmonic generation (SHG) and stimulated Raman scattering (SRS) microscopy it is possible to provide contrast for economically relevant ores. These techniques, however, cannot be readily applied to minerals that significantly absorb light at the laser wavelengths. Many minerals of interest to industry are opaque and thus not compatible with transmission imaging modes [7–9]. Recently, pump-probe microscopy in both transmission and reflection has been demonstrated for a range of absorbing materials both biological and mineral [10–15]. In this approach one pulsed laser (the pump) excites the sample, initiating a time-varying change in the reflectivity of the sample which is then detected by a second time-delayed probe pulse. Transient reflectivity measurement in a non-imaging mode for characterization of semiconductors is well known in solid-state physics [16–21].
Here we demonstrate that pump-probe microscopy can be used to discriminate opaque sulfide minerals, an economically important class of minerals in ore deposits. Our approach uses collinear pump-probe beams through an oblique illumination geometry similar to selective plane illumination microscopy (SPIM) to efficiently collect reflected light from the surface. This new geometry reduces laser power requirements and allows polarization sensitive measurements while enabling rapid imaging at high spatial resolution. We use the time response of known
#388369 https://doi.org/10.1364/OE.388369
materials as a kernel for mapping different image regions to identify sulfide minerals, offering comparable contrast to that achieved using SEM-EDS.
2. Materials and methods
2.1. Pump-probe reflection mode laser scanning microscopy
A schematic of the reflective imaging set up is shown in Fig. 1. A femtosecond laser system (InSight DS+, Spectra-Physics, USA) produced two synchronized pulse trains at 80 MHz. The first output, the pump, was at a fixed central wavelength of 1040 nm with a pulse duration of ∼220 fs, and the second output, the probe, was tunable over the range 680-1300 nm with pulse duration of 100-120 fs. For all experiments here, the tunable wavelength was set at 900 nm. An amplitude modulation (square wave with 50% duty cycle at 1 MHz) was applied to the 1040 nm beam by passing it through a Pockels cell (350-160, Conoptics, USA) driven by a function a generator (DS345, Stanford Research Systems, USA) before the beams were recombined and sent to the laser scanning setup.
Fig. 1. Schematic of the reflective mode laser scanning microscope. DM is dichroic mirror. PD is photodiode. The slow axis scanning is via a voice coil stage while the fast axis scanning is via a galvanometer.
For imaging, the fast axis was scanned by a single galvanometer (Thorlabs GVS001 with 50 mm achromat scan lens and 200 mm achromat tube lens) which creates a beam of approximately 15 mm and closely matching the back aperture of the objective. The slow axis was scanned by moving the sample stage at 0.105 Hz (9.5 seconds per 512 × 512 pixel frame) (Physike Instrumente V-528 voice coil stage and C-413 PIMag motion controller). Co-ordination of the scanning with data acquisition was through the ScanImage software [22]. For both illumination and collection, long working distance, NIR objectives were used (Mitutoyo 20X Plan Apo NIR 0.40 N.A. 20 mm W.D.) and aligned at 45° to the sample using a modified single plane illumination geometry objective mount (RAO-0046, Applied Scientific Imaging, Eugene, OR). Because of the angled geometry, the polarization of both beams at the sample surface was 45° to the plane of incidence (i.e. between S- and P-polarizations). The pump beam was blocked by a combination of a bandpass and notch filters (BrightLine 850/310, Semrock, USA and 1064-71 NF, Iridian, Canada) while the probe beam was detected using an amplified photodiode (PDA100A, Thorlabs, USA with gain set at 0dB and specified bandwidth of 2.4 MHz). The photodiode output was sent to a lock-in amplifier (UHFLI, Zurich Instruments, A/C coupled with 50 ohm input load) which was referenced to the function generator controlling the Pockels cell. The relative phase between the signal and reference of the lock-in amplifier was adjusted to zero by removing the blocking filters and reflecting an attenuated pump beam directly onto the photodiode. In most cases both the in-phase (X) and quadrature (90 degree out-of-phase, Y) signals were recorded using a time
constant of 29 µs, similar to the pixel dwell-time of 27.6 µs. Unless otherwise noted, the average laser power of each beam at the sample was 2.5 mW (32 pJ/pulse and 65 pJ/pulse for probe and pump respectively).
2.2. Image data analysis
The change in reflectivity as a function of pump-probe delay was recorded for every pixel, giving a 3D data set. To segment the image, kernel functions were generated by taking the time response of a pixel or group of pixels. The degree of similarity with different kernels was then established by performing a cross-correlation analysis similar to that of van de Merr and Bakker [23]. While this method does not uniquely identify the mineral in a particular region, it is insensitive to variations in intensity and provides a robust method of segmenting images. By comparing the kernel function with the time responses of known materials, it is then possible to assign a mineral type to a region. Our current approach makes use of the entire temporal response of the data set which takes ∼5 minutes to collect. Alternative schemes for classification of 3 dimensional image data sets could be employed to reduce data collection time [10,24]. After segmentation, additional image processing was performed using ImageJ/FIJI [25].
2.3. Samples
Chalcopyrite, galena and molybdonite mineral samples were from the “Canadian Rock and Mineral Set” from Ward’s Science (Rochester NY) and were prepared as polished sections by Vancouver Petrographics. Flakes 1–10 mm in size were broken or sawn from the rocks before being mounted in resin and polished. A naturally occurring cubic crystal of pyrite was a gift of Stephanie Higgins and Neil Van Lieu of Areté Associates and was similarly prepared. Before imaging, samples were polished gently with 8000 grit polishing paper and wiped with methanol and allowed to air dry. Natural gold ore polished thin sections (30 µm thickness) were a gift from Tassos Grammatikoplous of SGS Canada.
3. Results and discussion
3.1. Oblique-angle reflection mode pump probe microscopy
We adapt a single plane illumination microscope with the illumination and collection objectives set at oblique angles to the sample. Since the focus of only one optically-scanned line of the first objective lies on the plane of the sample surface, we employ a galvanometer scanner that can operate at speeds of several hundred Hz to scan this line. The slow axis has a scan frequency of less than 1 Hz which can be readily implemented by moving the sample stage. In this configuration all reflection angles between the pump and probe that are contained within the numerical aperture of the two objectives are collected. It is possible to have different illumination and/or collection angles and to utilize different objectives on the illumination and collection side. One restriction of this setup is determined by the working distance of the objectives since this could limit sample size due to geometric constraints. Here, we have used long working distance objectives so that the bottom surface of the sample sits entirely above the barrels of the objectives.
This setup offers a few advantages over other normal incidence illumination through a beam splitter. Because the incoming and reflected beams have independent light paths, it is possible to arbitrarily set the polarization of the pump and probe while also performing polarization resolved measurements akin to pump-probe ellipsometry [26]. Additionally, nearly all of the incoming light reaches the sample and is collected, lowering the input power requirements compared to setups with beam splitters in the illumination arm; this reduced power requirement allows a wider range of laser sources to be utilized for practical applications.
3.2. Imaging characteristics
For pump-probe imaging of geologic materials, a change in the transient reflectivity is apparent at all time delays due to a mix of instantaneous nonlinear effects, electron-hole dynamics, phonons, and thermal relaxation (including expansion of the solid matrix). The diverse nature of these responses results in image contrast for a wide range of time delays. For example, when examining a sulfide containing thin section (natural gold bearing ore) substantial structural details are visible in both the in-phase (labeled x) and quadrature (+90° out-of-phase, labeled y) channels as shown by the single, unaveraged images in Fig.2(a) and2(b). Some of the detail appears to be unrelated to the mineral type and could be due to other effects such as local heating and nanoscale electron-confinement effects of small features. Nonetheless, there do exist large regions in the image which have distinct temporal responses as is illustrated in Fig.2(c). The spatial variability of the t<0 response in both the in-phase and quadrature channels reflects that image contrast is achievable for all settings.
Fig. 2. Single frame at 23 ps delay of the in-phase (x) channel (a) and quadrature (y) channel (b) images of a natural high-sulfides gold ore polished thin section showing typical details of this form of imaging. Regions of interest (ROIs) are indicated. (c) Normalized response of the in-phase x and quadrature y channels from the regions indicated in the picture.
3.3. Power scaling and time response
Looking at Fig.2, we see that for delay times t>0, when the probe arrives after the pump, there are different fast responses which vary spatially across the image. Additionally, for t<0, that is the probe arrives before the pump, there is signal present that is due to long-lived excitations which could arise from a host of processes such as decay to a metastable excited state yet for these samples, given the time delay between pulses, are likely thermal effects. Indeed, thermoreflectance imaging and time-domain thermoreflectance (TDTR) use the change in reflectivity of a material due to heating to either map temperature changes in a sample (thermoreflectance imaging) [27] or characterize thermal properties such as thermal conductivity (TDTR) [28,29]. The quadrature signal can be significant for TDTR yet is relatively insensitive to time delay, as we see here.
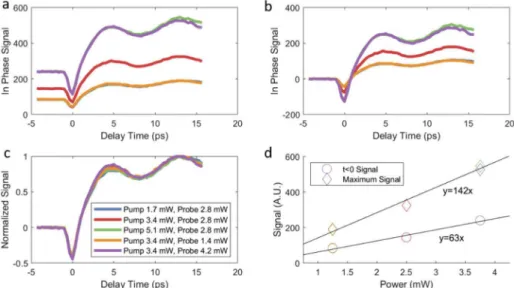
The signal from thermal processes will depend on the material being studied as well as thermal conductance across boundaries. In natural materials where thermal transport can be highly variable, this results in a non-uniform “background” signal. To test the influence of the thermal background on the short time response we measured both responses as a function of input pump and probe powers on pyrite samples with typical in-phase signals illustrated in Fig.3(a). If we assume that the response at t<0 is due to thermal effects, we can determine how it scales and subtract it from the t>0 electronic response (see Fig.3(b)). We find that the thermal response measured at t<0 scales linearly with both pump and probe power (Fig. 3(d), open circles). With the thermal response removed, we can normalize the electronic response using either the minimum (not shown) or maximum (Fig.3(c)) and find that all responses collapse to a single
master curve as would be expected for purely linear responses. Looking at the power scaling, we find that the electronic response also scales linearly with the pump and probe powers (Fig.3(d), diamonds) but with a different scaling coefficient than the thermal response.
Fig. 3. Power scaling response from pure pyrite. a) The in-phase pump-probe response for different input powers. b) The in-phase response with the t<0 response subtracted from all time delays. c) In-phase response normalized by the maximum signal after background subtraction. d) The t<0 signal and the maximum signal after background subtraction as a function of input pump and probe powers. Some data points are not visible due to overlap. Black lines are a guide to the eye showing the linear regression of the data. For all plots, blue is 1.7 mW pump, 2.8 mW probe; red is 3.4 mW pump, 2.8 mW probe; green is 5.1 mW pump, 2.8 mW probe; yellow is 3.4 mW pump, 1.4 mW probe; and purple is 2.8 mW pump and 4.2 mW probe. Pump is 1040 nm and probe is 900 nm.
3.4. Transient reflectivity of natural sulfide minerals
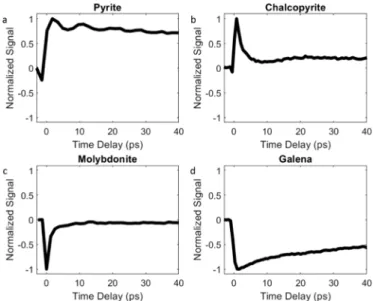
As shown in Fig. 2, the temporal response of different regions of the sample can vary greatly, potentially allowing for materials to be identified using a basis set of mineral responses. Here, we test four natural semiconductor mineral samples which are industrially relevant: pyrite (FeS2), chalcopyrite (CuFeS2) [30], galena (PbS) and molybdonite (MoS2). We find that each
sample tested has a distinct transient reflectivity temporal response (Fig.4). Pyrite decreases in reflectivity during the pump and probe overlap followed by an increase in reflectivity with subsequent complex temporal dynamics with showing a decaying oscillatory response with a period close to 7 ps overlaid with a more gradual decay time. The oscillatory response is likely due to phonon dynamics and have been reported before [31–33]. Chalcopyrite has a strong increase in reflectivity that occurs when the pump and probe are overlapped that increases slightly after reaching a minimum. Molybdonite has a sharp decrease in reflectivity during overlap of the pump and probe followed by a rapid recovery to its baseline behavior. There are a number of pump-probe studies on MoS2that show a range of responses in pump-probe measurements at
different wavelengths which are consistent with our results [34,35]. Most current interest is in the few layer forms of this material and at higher photon energies than used here. Galena (PbS) shows a decrease in reflectivity which rises during the pulse overlaps and decays with a characteristic time of around 75 ps which is consistent with a number of studies on PbS nano-materials [36]. Note that in each case, apart from variations in intensities within the image field, there are also
variations in the temporal response (especially at t<0) likely due to high degree of variability in defects and polarization response in natural materials. However, the responses in the few ps time scale are largely consistent with mineral type and useful for classification of mineral types.
Fig. 4. 30 ps time scale measurement of in-phase responses of different mineral types in a pump (1040 nm) probe (900 nm) configuration. Background at t<0 subtracted before normalization.
3.5. Imaging of sulfides minerals in naturally occurring ore rocks
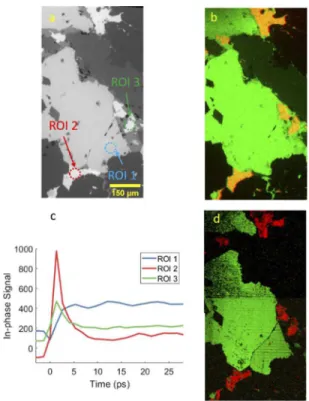
To validate our approach on an economically-relevant sample, we imaged a gold ore sample containing pyrite (FeS2) and chalcopyrite (CuFeS2) among other components. We characterized
the sample using SEM-EDS to identify the different materials. Quantitative EDS spectra were analysed in a number of regions to verify the mineral identity. The backscattered electron image, which is collected as part of SEM-EDS analysis, is shown in Fig.5(a). The Fe and Cu abundance from the EDS maps are mapped using green and red respectively in Fig. 5(b). EDS spectra confirm the green regions as pyrite while the yellow regions, containing Fe and Cu, are identified as chalcopyrite. We used pump-probe microscopy to study the same region using a 40 ps time delay scan that encompasses both t<0 and t>0 responses. Three distinct time responses were identified with the ROIs being highlighted in Fig. 5(a). One response is similar to that for pyrite whereas the other two responses are reminiscent of that for chalcopyrite but with either a positive or negative offset as evidenced by the t<0 response (see Fig.5(c)). If the full response of each region is used as a kernel for a cross-correlation analysis, it appears as if there are three distinct species within the field of view (not shown); however, if a cross-correlation analysis is performed using only the electronic response, that is if the t<0 response is taken as an offset and subtracted, only two species are identified. Comparing with Fig.4, these two responses appear to be either pyrite-like or chalcopyrite-like. Using these two short-time responses to perform a cross-correlation analysis and identify all similar regions in the image, we obtain two images showing regions with either a pyrite-like or chalcopyrite-like response. To facilitate comparison with the SEM-EDS image, we merge the two images with pyrite-like regions colored green and chalcopyrite-like regions colored red (Fig.5(d)). If we compare our identification of the species using SEM-EDS and pump-probe microscopy we find an excellent agreement, demonstrating that
pump-probe microscopy can be used to segment and identify different sulfide mineral species in natural samples.
Fig. 5. An area about 0.5 × 1.5 mm of a polished thin section of gold-ore containing sulfide minerals was imaged by SEM-EDS and reflection pump-probe over a total of 40 ps inter pulse delay. a) Back-scattered electron image with ROIs highlighted. b) Red-green (RG) merge of quantitative images derived from Cu (R) and Fe (G) from the SEM-EDS data set. In this image preparation chalcopyrite, with both Cu and Fe, appears yellow, while pyrite, with Fe but no Cu, is green. c) In-phase temporal response from the ROIs indicated. d) Red-green merge with cross-correlation with chalcopyrite-like response (R) and pyrite-like response (G) highlighted.
4. Conclusion
For geological applications, many ores of economic interest contain semiconductors (such as sulfide minerals) and are typically characterized using SEM techniques. Pump-probe microscopy, which is finding increasing use in a range of fields, can provide a contrast mechanism based on different physical properties that could offer enhanced sensitivity, for example for minerals that exist in different crystal forms. We have shown that in natural materials, even in the presence of a highly heterogeneous background, it is possible to “fingerprint” different minerals using pump-probe imaging. In the current implementation, we do not distinguish between processes which contribute to the t<0 response. The ability to isolate the short time dynamics enables the application of pump-probe fingerprinting to natural ores which can vary greatly in terms of thermal contact to their environment, grain structure, and defects which can all affect the long-time response of a mineral.
While the present study has only discriminated four different minerals, existing work on understanding and modeling of economically relevant semiconductors, including both sulfides and oxides [7–9], suggests that this approach could be more widely applicable. Unfortunately, to
the best of our understanding, there is currently no general theoretical approach that would allow a prediction of pico-second time scale transient reflectivity from knowledge of the structural details of a solid and thus more standard techniques are necessary for calibration. Nonetheless, the physical basis for mineral identification in pump-probe microscopy is distinct from the elemental spectra of SEM-EDS. This may provide a novel method for identification of elementally similar minerals such as crystal-habit forms of pyrrhotite that have significant influence in mineral processing [37,38] and are difficult to distinguish by SEM-EDS. Similarly, as currently implemented this approach is largely confined to measuring surface properties which are, in turn, critical to determining mineral hydro-metallurgical processing behavior. It is also worth noting that any our approach is applicable to wet samples which are commonly used in mineral processing and cannot be characterized using SEM-EDS.
To facilitate more wide-spread use of pump-probe imaging of opaque materials, we have implemented a new scanning microscopy geometry. Typically, in pump-probe imaging, either the stage is scanned or a laser-scanning confocal microscope is used. Stage-scanning speed is constrained by the inertia of the stage. Laser-scanning microscopy of opaque materials at normal incidence requires that a beam splitter be placed in the optical path. A non-polarizing beam splitter can be used at the cost of loss of laser energy and decreased detection efficiency or a quarter wave plate-polarizing beam splitter combination can be used at the cost of being unable to arbitrarily set the polarization of the beams at the sample. Our approach combines stage scanning and laser scanning and offers practical advantages for studying opaque materials. For example, the polarization states of both the incident and reflected light can be easily controlled or characterized and the full laser power is usable for scanning, significantly relaxing the requirements for the laser source used. While stage scanning is still used, this constraint is relaxed considerably as only the slow axis is scanned. Additionally, this geometry is easily adapted to imaging of moving samples such as roll-to-roll processing (for example [39]) or in flow-sheets that are used in mineral processing.
Funding
Canada Research Chairs; Natural Sciences and Engineering Research Council of Canada; National Research Council, Joint Center for Extreme Photonics..
Acknowledgments
We thank David Kingston of the National Research Council of Canada, Energy Mining and Environment Research Center for SEM analysis as well as helpful discussions. We also thank Patrick Mercier, Rune Lausten, Albert Stolow, Phil Bustard and Ben Sussman for their advice.
Disclosures
The authors declare no conflicts of interest.
References
1. Y. Gu, R. P. Schouwstra, and C. Rule, “The value of automated mineralogy,”Miner. Eng.58, 100–103 (2014). 2. W. R. Goodall and P. J. Scales, “An overview of the advantages and disadvantages of the determination of gold
mineralogy by automated mineralogy,”Miner. Eng.20(5), 506–517 (2007).
3. P. Gottlieb, G. Wilkie, D. Sutherland, E. Ho-Tun, S. Suthers, K. Perera, B. Jenkins, S. Spencer, A. Butcher, and J. Rayner, “Using quantitative electron microscopy for process mineralogy applications,”JOM52(4), 24–25 (2000). 4. D. Pirrie and G. K. Rollinson, “Unlocking the applications of automated mineral analysis,”Geol. Today27(6),
226–235 (2011).
5. W. D. Nesse, Introduction to optical mineralogy, 4th ed. (Oxford University), New York, NY, 2013, pp. xiii, 361 p. 6. M. C. Kao, A. F. Pegoraro, D. M. Kingston, A. Stolow, W. C. Kuo, P. H. J. Mercier, A. Gogoi, F. J. Kao, and A. Ridsdale, “Direct mineralogical imaging of economic ore and rock samples with multi-modal nonlinear optical microscopy,”Sci. Rep.8(1), 16917 (2018).
7. R. T. Shuey, Semiconducting ore minerals, Developments in economic geology (Elsevier Scientific Pub. Co.), Amsterdam, New York, 1975, pp. xii, 415 p.
8. B. J. Wood and R. G. J. Strens, “Diffuse reflectance spectra and optical properties of some sulphides and related minerals,”Mineral. Mag.43(328), 509–518 (1979).
9. Y. Xu and M. A. A. Schoonen, “The absolute energy positions of conduction and valence bands of selected semiconducting minerals,”Am. Mineral.85(3-4), 543–556 (2000).
10. M. C. Fischer, J. W. Wilson, F. E. Robles, and W. S. Warren, “Invited review article: Pump-probe microscopy,”Rev. Sci. Instrum.87(3), 031101 (2016).
11. D. Davydova, A. de la Cadena, D. Akimov, and B. Dietzek, “Transient absorption microscopy: Advances in chemical imaging of photoinduced dynamics,”Laser Photonics Rev.10(1), 62–81 (2016).
12. P. T. Dong and J. X. Cheng, “Pump-probe microscopy: Theory, instrumentation, and applications,” Spectroscopy-Us 32, 24–36 (2017).
13. T. Zhu, J. M. Snaider, L. Yuan, and L. B. Huang, “Ultrafast dynamic microscopy of carrier and exciton transport,”
Annu. Rev. Phys. Chem.70(1), 219–244 (2019).
14. E. Ghadiri, D. Shin, A. Shafiee, W. S. Warren, and D. B. Mitzi, “Grain-resolved ultrafast photophysics in cu2basns4–x se x semiconductors using pump–probe diffuse reflectance spectroscopy and microscopy,”ACS Appl. Mater. Interfaces
10(46), 39615–39623 (2018).
15. Y. Zhu and J.-X. Cheng, “Transient absorption microscopy: Technological innovations and applications in materials science and life science,”J. Chem. Phys.152(2), 020901 (2020).
16. A. Othonos, “Probing ultrafast carrier and phonon dynamics in semiconductors,”J. Appl. Phys.83(4), 1789–1830 (1998).
17. F. Rossi and T. Kuhn, “Theory of ultrafast phenomena in photoexcited semiconductors,”Rev. Mod. Phys.74(3), 895–950 (2002).
18. D. S. Chemla and J. Shah, “Many-body and correlation effects in semiconductors,”Nature411(6837), 549–557 (2001).
19. J. Shah, “Ultrafast spectroscopy of semiconductors and semiconductor nanostructures,” 2nd enl. ed., Springer series
in solid-state sciences, 115 (Springer Verlag), Berlin, New York, 1999, pp. xvi, 518 p.
20. M. Delor, H. L. Weaver, Q. Yu, and N. S. Ginsberg, “Imaging material functionality through three-dimensional nanoscale tracking of energy flow,”Nat. Mater.19(1), 56–62 (2020).
21. S. S. Lo, H. Y. Shi, L. Huang, and G. V. Hartland, “Imaging the extent of plasmon excitation in au nanowires using pump-probe microscopy,”Opt. Lett.38(8), 1265–1267 (2013).
22. T. A. Pologruto, B. L. Sabatini, and K. Svoboda, “Scanimage: Flexible software for operating laser scanning microscopes,”BioMed Eng OnLine2(1), 13 (2003).
23. F. vanderMeer and W. Bakker, “Cross correlogram spectral matching: Application to surface mineralogical mapping by using aviris data from cuprite, nevada,”Remote Sens. Environ.61(3), 371–382 (1997).
24. M. J. Simpson, B. Doughty, B. Yang, K. Xiao, and Y. Z. Ma, “Separation of distinct photoexcitation species in femtosecond transient absorption microscopy,”ACS Photonics3(3), 434–442 (2016).
25. J. Schindelin, I. Arganda-Carreras, E. Frise, V. Kaynig, M. Longair, T. Pietzsch, S. Preibisch, C. Rueden, S. Saalfeld, B. Schmid, J. Y. Tinevez, D. J. White, V. Hartenstein, K. Eliceiri, P. Tomancak, and A. Cardona, “Fiji: An open-source platform for biological-image analysis,”Nat. Methods9(7), 676–682 (2012).
26. S. Rapp, M. Kaiser, M. Schmidt, and H. P. Huber, “Ultrafast pump-probe ellipsometry setup for the measurement of transient optical properties during laser ablation,”Opt. Express24(16), 17572–17592 (2016).
27. J. Kölzer, E. Oesterschulze, and G. Deboy, “Thermal imaging and measurement techniques for electronic materials and devices,”Microelectron. Eng.31(1-4), 251–270 (1996).
28. D. G. Cahill, “Analysis of heat flow in layered structures for time-domain thermoreflectance,”Rev. Sci. Instrum.
75(12), 5119–5122 (2004).
29. P. Jiang, X. Qian, and R. Yang, “Tutorial: Time-domain thermoreflectance (tdtr) for thermal property characterization of bulk and thin film materials,”J. Appl. Phys.124(16), 161103 (2018).
30. T. Oguchi, K. Sato, and T. Teranishi, “Optical reflectivity spectrum of a cufes2 single-crystal,”J. Phys. Soc. Jpn.
48(1), 123–128 (1980).
31. M. Kasami, T. Mishina, S. Yamamoto, and J. Nakahara, “Coherent longitudinal acoustic phonons in pyrite,”J. Lumin.
108(1-4), 291–295 (2004).
32. S. G. Choi, J. Hu, L. S. Abdallah, M. Limpinsel, Y. N. Zhang, S. Zollner, R. Q. Wu, and M. Law, “Pseudodielectric function and critical-point energies of iron pyrite,”Phys. Rev. B86(11), 115207 (2012).
33. S. A. Sorenson, J. G. Patrow, and J. M. Dawlaty, “Electronic dynamics in natural iron pyrite studied by broadband transient reflection spectroscopy,”J. Phys. Chem. C120(14), 7736–7747 (2016).
34. Q. S. Wang, S. F. Ge, X. Li, J. Qiu, Y. X. Ji, J. Feng, and D. Sun, “Valley carrier dynamics in mono layer molybdenum disulfide from helicity-resolved ultrafast pump-probe spectroscopy,”ACS Nano7(12), 11087–11093 (2013). 35. Z. G. Nie, R. Long, L. F. Sun, C. C. Huang, J. Zhang, Q. H. Xiong, D. W. Hewak, Z. X. Shen, O. V. Prezhdo, and Z.
H. Loh, “Ultrafast carrier thermalization and cooling dynamics in few-layer mos2,”ACS Nano8(10), 10931–10940 (2014).
36. G. Nootz, L. A. Padilha, L. Levina, V. Sukhovatkin, S. Webster, L. Brzozowski, E. H. Sargent, D. J. Hagan, and E. W. Van Stryland, “Size dependence of carrier dynamics and carrier multiplication in pbs quantum dots,”Phys. Rev. B
83(15), 155302 (2011).
37. C.-H. Zhao, B.-Z. Wu, and J.-H. Chen, “Electronic structure and flotation behavior of monoclinic and hexagonal pyrrhotite,”J. Cent. South Univ.22(2), 466–471 (2015).
38. R. S. Multani and K. E. Waters, “A review of the physicochemical properties and flotation of pyrrhotite superstructures (4c – fe7s8/ 5c – fe9s10) in ni-cu sulphide mineral processing,”Can. J. Chem. Eng.96(5), 1185–1206 (2018). 39. K. C. Huang, J. McCall, P. Wang, C. S. Liao, G. Eakins, J. X. Cheng, and C. Yang, “High-speed spectroscopic