1
Analytical and Bioanalytical Chemistry
Electronic Supplementary Material
Quantitative determination and validation of 17 cannabinoids in cannabis and
hemp using liquid chromatography−mass spectrometry
2
Table of Contents
List of Tables
Table S1
Calibration standard and QC sample concentrations
Table S2
Chromatographic peak resolution
List of Figures
Figure S1
Δ9-THC linear regression
Figure S2
Δ9-THCA linear regression
Figure S3
CBD linear regression
Figure S4
CBDA linear regression
Figure S5
CBG linear regression
Figure S6
CBGA linear regression
Figure S7
CBN linear regression
Figure S8
CBNA linear regression
Figure S9
CBC linear regression
Figure S10
CBCA linear regression
Figure S11
THCV linear regression
Figure S12
THCVA linear regression
Figure S13
CBDV linear regression
Figure S14
CBDVA linear regression
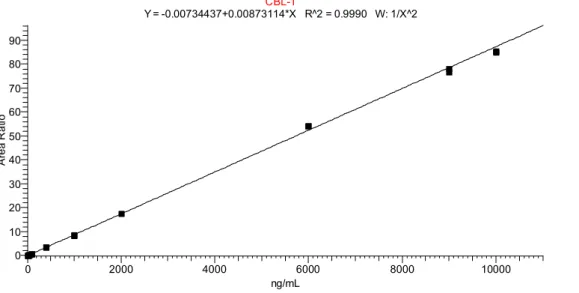
Figure S15
CBL linear regression
Figure S16
CBLA linear regression
Figure S17
Δ8-THC linear regression
3
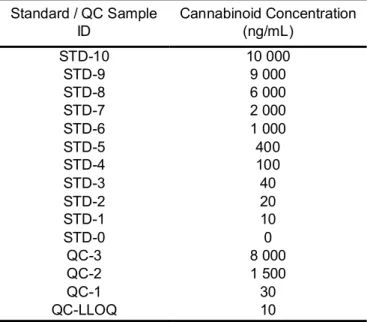
Table S1 Calibration standard and QC sample concentrations (prepared in methanol, concentrations
for each of 17 cannabinoids for each standard level)
Standard / QC Sample
ID
Cannabinoid Concentration
(ng/mL)
STD-10
10 000
STD-9
9 000
STD-8
6 000
STD-7
2 000
STD-6
1 000
STD-5
400
STD-4
100
STD-3
40
STD-2
20
STD-1
10
STD-0
0
QC-3
8 000
QC-2
1 500
QC-1
30
QC-LLOQ
10
Table S2 Chromatographic peak resolution of key cannabinoids within 2 m/z of each other
Cannabinoid-1
Cannabinoid-2
Δ m/z
Resolution
CBDV
THCV
0
5.8
CBD
Δ9-THC
0
7.2
Δ9-THC
Δ8-THC
0
1.9
Δ8-THC
CBC
0
1.9
CBC
CBL
0
2.4
CBD
CBG
2
4.7
CBG
Δ9-THC
2
2.1
CBDVA
THCVA
0
7.4
CBDA
Δ9-THCA
0
8.5
Δ9-THCA
CBCA
0
3.6
CBCA
CBLA
0
2.1
CBDA
CBGA
2
9.5
Δ9-THCA
CBGA
2
1.0
4
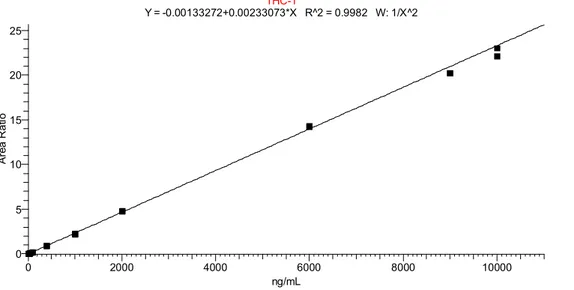
Fig. S1 Δ9-THC Linear regression, weighted 1/x
2(duplicate injection of a calibration curve,
beginning and end of batch)
Fig. S2 Δ9-THCA Linear regression, weighted 1/x
2(duplicate injection of a calibration curve,
beginning and end of batch)
THC-1 Y = -0.00133272+0.00233073*X R^2 = 0.9982 W: 1/X^2 0 2000 4000 6000 8000 10000 ng/mL 0 5 10 15 20 25 A re a R a tio THCA-1 Y = -0.00352983+0.00467283*X R^2 = 0.9986 W: 1/X^2 0 2000 4000 6000 8000 10000 ng/mL 0 5 10 15 20 25 30 35 40 45 50 A re a R a tio
5
Fig. S3 CBD Linear regression, weighted 1/x
2(duplicate injection of a calibration curve,
beginning and end of batch)
Fig. S4 CBDA Linear regression, weighted 1/x
2(duplicate injection of a calibration curve,
beginning and end of batch)
CBD-1 Y = -0.00179668+0.00237553*X R^2 = 0.9990 W: 1/X^2 0 2000 4000 6000 8000 10000 ng/mL 0 5 10 15 20 25 A re a R a tio CBDA-1 Y = -0.00492675+0.00797955*X R^2 = 0.9989 W: 1/X^2 0 2000 4000 6000 8000 10000 ng/mL 0 10 20 30 40 50 60 70 80 A re a R a tio
6
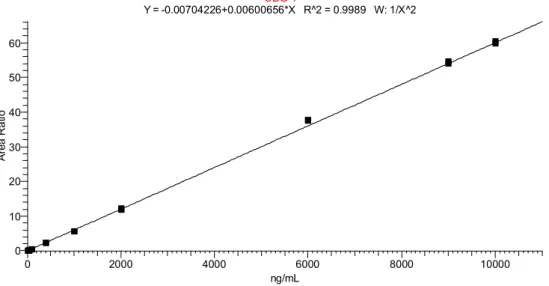
Fig. S5 CBG Linear regression, weighted 1/x
2(duplicate injection of a calibration curve,
beginning and end of batch)
Fig. S6 CBGA Linear regression, weighted 1/x
2(duplicate injection of a calibration curve,
beginning and end of batch)
CBG-1 Y = -0.00704226+0.00600656*X R^2 = 0.9989 W: 1/X^2 0 2000 4000 6000 8000 10000 ng/mL 0 10 20 30 40 50 60 A re a R a tio CBGA-1 Y = -0.0198632+0.016551*X R^2 = 0.9986 W: 1/X^2 0 2000 4000 6000 8000 10000 ng/mL 0 20 40 60 80 100 120 140 160 180 A re a R at io
7
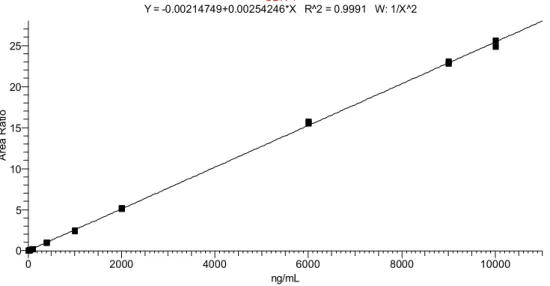
Fig. S7 CBN Linear regression, weighted 1/x
2(duplicate injection of a calibration curve,
beginning and end of batch)
Fig. S8 CBNA Linear regression, weighted 1/x
2(duplicate injection of a calibration curve,
beginning and end of batch)
CBN-1 Y = -0.00214749+0.00254246*X R^2 = 0.9991 W: 1/X^2 0 2000 4000 6000 8000 10000 ng/mL 0 5 10 15 20 25 A re a R a tio CBNA-1 Y = -0.000645604+0.000788326*X R^2 = 0.9985 W: 1/X^2 0 2000 4000 6000 8000 10000 ng/mL 0 1 2 3 4 5 6 7 8 A re a R at io
8
Fig. S9 CBC Linear regression, weighted 1/x
2(duplicate injection of a calibration curve,
beginning and end of batch)
Fig. S10 CBCA Linear regression, weighted 1/x
2(duplicate injection of a calibration curve,
beginning and end of batch)
CBC-1 Y = -0.00120058+0.000652256*X R^2 = 0.9985 W: 1/X^2 0 2000 4000 6000 8000 10000 ng/mL 0 1 2 3 4 5 6 7 A re a R a tio CBCA-1 Y = -9.82385e-005+0.000505312*X R^2 = 0.9975 W: 1/X^2 0 2000 4000 6000 8000 10000 ng/mL 0.0 0.5 1.0 1.5 2.0 2.5 3.0 3.5 4.0 4.5 5.0 5.5 A re a R a tio
9
Fig. S11 THCV Linear regression, weighted 1/x
2(duplicate injection of a calibration curve,
beginning and end of batch)
Fig. S12 THCVA Linear regression, weighted 1/x
2(duplicate injection of a calibration curve,
beginning and end of batch)
THCV-1 Y = -0.00191128+0.00243802*X R^2 = 0.9990 W: 1/X^2 0 2000 4000 6000 8000 10000 ng/mL 0 5 10 15 20 25 A re a R a tio THCVA-1 Y = -0.00412588+0.00483084*X R^2 = 0.9981 W: 1/X^2 0 2000 4000 6000 8000 10000 ng/mL 0 5 10 15 20 25 30 35 40 45 50 A re a R a tio
10
Fig. S13 CBDV Linear regression, weighted 1/x
2(duplicate injection of a calibration curve,
beginning and end of batch)
Fig. S14 CBDVA Linear regression, weighted 1/x
2(duplicate injection of a calibration curve,
beginning and end of batch)
CBDV-1 Y = -0.00196683+0.00249242*X R^2 = 0.9991 W: 1/X^2 0 2000 4000 6000 8000 10000 ng/mL 0 5 10 15 20 25 A re a R a tio CBDVA-1 Y = -0.00962057+0.00918429*X R^2 = 0.9988 W: 1/X^2 0 2000 4000 6000 8000 10000 ng/mL 0 10 20 30 40 50 60 70 80 90 100 A re a R a tio
11
Fig. S15 CBL Linear regression, weighted 1/x
2(duplicate injection of a calibration curve,
beginning and end of batch)
Fig. S16 CBLA Linear regression, weighted 1/x
2(duplicate injection of a calibration curve,
beginning and end of batch)
CBL-1 Y = -0.00734437+0.00873114*X R^2 = 0.9990 W: 1/X^2 0 2000 4000 6000 8000 10000 ng/mL 0 10 20 30 40 50 60 70 80 90 A re a R a tio CBLA-1 Y = -0.000491829+0.000467184*X R^2 = 0.9958 W: 1/X^2 0 2000 4000 6000 8000 10000 ng/mL 0.0 0.5 1.0 1.5 2.0 2.5 3.0 3.5 4.0 4.5 5.0 A re a R a tio
12
Fig. S17 Δ8-THC Linear regression, weighted 1/x
2(duplicate injection of a calibration curve,
beginning and end of batch)
d8-THC-1 Y = -0.00178739+0.00196621*X R^2 = 0.9987 W: 1/X^2 0 2000 4000 6000 8000 10000 ng/mL 0 2 4 6 8 10 12 14 16 18 20 A re a R a tio