HAL Id: inserm-01854596
https://www.hal.inserm.fr/inserm-01854596v2
Submitted on 14 Sep 2018
HAL is a multi-disciplinary open access archive for the deposit and dissemination of sci-entific research documents, whether they are pub-lished or not. The documents may come from teaching and research institutions in France or abroad, or from public or private research centers.
L’archive ouverte pluridisciplinaire HAL, est destinée au dépôt et à la diffusion de documents scientifiques de niveau recherche, publiés ou non, émanant des établissements d’enseignement et de recherche français ou étrangers, des laboratoires publics ou privés.
tomography registration for the guidance of a cardiac
arrhythmia therapy
Zulma Sandoval, Miguel Castro, Javad Alirezaie, Francis Bessière, Cyril
Lafon, Jean-Louis Dillenseger
To cite this version:
Zulma Sandoval, Miguel Castro, Javad Alirezaie, Francis Bessière, Cyril Lafon, et al.. Transesophageal 2D ultrasound to 3D computed tomography registration for the guidance of a cardiac arrhythmia therapy. Physics in Medicine and Biology, IOP Publishing, 2018, 63 (15), pp.155007. �10.1088/1361-6560/aad29a�. �inserm-01854596v2�
Tomography registration for the guidance of a
cardiac arrhythmia therapy
Zulma Sandoval1, Miguel Castro1, Javad Alirezaie2,
Francis Bessi`ere3, Cyril Lafon3, and Jean-Louis Dillenseger1
1Inserm, U1099, Rennes, F-35000, France; Universit´e de Rennes 1, LTSI, Rennes,
F-35000, France
2Ryerson University, Toronto, Canada
3Inserm, U1032, labTau, Lyon, France, and Universit´e Claude Bernard Lyon 1,
Lyon, France
E-mail: jean-louis.dillenseger@univ-rennes1.fr February 2014
Abstract. The work aims at developing a new image-processing method to improve the guidance of transesophageal HIFU atrial fibrillation therapy. Our proposal is a novel registration approach that aligns intraoperative 2D ultrasound with preoperative 3D-CT information. This approach takes advantage of the anatomical constraints imposed at the transesophageal HIFU probe to simplify the registration process. Our proposed method has been evaluated on a physical phantom and on real clinical data.
1. Introduction
Catheter ablation is regularly used to treat cardiac arrhythmia. This intervention is required when antiarrhythmic medications are ineffective. Depending on the arrhythmia, the success rate varies from 30% to more than 95% (Huang & Miller 2014). One of the critical points is the ability to diffuse via the catheter enough energy at the arrhythmogenic area that is sometimes deeply located into the muscle. The more challenging the arrhythmia is to ablate, the more complications can occur. The complication rate is about 1% to 3% (Huang & Miller 2014). Strokes represent the most serious one, and vascular injuries are the most frequent. The more challenging the arrhythmia is to ablate
As high intensity focused ultrasound (HIFU) offers the possibility to create a lesion at a distance from a transducer using dynamic focusing, methods are developed to treat cardiac arrhythmia non-invasively and more efficiently by introducing a transducer into the esophagus (Yin, Epstein & Hynynen 2006)(Constanciel, N’Djin, Bessiere, Chavrier, Grinberg, Vignot, Chevalier, Chapelon & Lafon 2013). Since the esophagus is located just behind the heart, it offers a perfect acoustic window so that HIFU can be directed
toward the heart without many acoustic fences (Ho & Ernst 2012) so this technology could allow treating foci without intravascular catheter. One of these approach is actually under feasibility study on animal testing (Bessiere, N’djin, Colas, Chavrier, Greillier, Chapelon, Chevalier & Lafon 2016). The probe is combining both a multi-element HIFU and ultrasound (US) transducers so that HIFU therapy can be delivered in real time under US 2D anatomy imaging. During the therapy, the probe would be introduced into the esophagus and placed behind the heart. From this location, HIFU waves delivered from the esophagus ablate the inner myocardial tissue without damaging intervening and surrounding tissues. The US imaging transducer aims to enable optimal positioning of the transducer as well as to verify the absence of obstacles in the acoustic beam path of the HIFU transducer. However, the limited field of view of the 2D US image, the image quality and both cardiac and respiratory motions make the guidance a very complex task. In order to enhance the guidance of the transesophageal HIFU cardiac ablation, we propose an integration of the high-resolution CT anatomical preoperative 3D imaging in which the ablation path has been defined with the intraoperative 2D US images. This would help the therapist to adjust the HIFU focal point to the the planed ablation path.
Registration of 2D US to 3D CT, using electromagnetic tracking system is reported in the literature (Linte, Moore, Wedlake, Bainbridge, Guiraudon, Jones & Peters 2009)(Huang, Moore, Guiraudon, Jones, Bainbridge, Ren & Peters 2009)(Lang, Chu, Bainbridge, Guiraudon, Jones & Peters 2013). In these approaches, preliminary registration is obtained using information of the tracking system (i.e. position and orientation of the probe tip in an external reference coordinate system). Then, final registration is performed between the CT volume and US volume reconstructed using the tracking information of the acquired 2D US images. The slice to volume registration problem is converted into a volume to volume registration. However, disadvantages such as accuracy, sensitivity to metallic interferences, requirement of additional hardware on the transesophageal probe, sensor calibration before intervention and accuracy losses in reused sensors make the integration of electromagnetic tracking during the clinical routine workflow very complex (Franz, Haidegger, Birkfellner, Cleary, Peters & Maier-Hein 2014)(Gao, Penney, Ma, Gogin, Cathier et al. 2012). In addition, no accuracy improvement is reported by Lang et. al. when comparing registration methods in phantom studies using electromagnetic tracking system with clinical studies without tracking information (Lang et al. 2013).
In this paper, we propose to perform a 2D-3D (slice-volume) registration of the intraoperative 2D US and the preoperative CT without any external tracking system. More precisely the 2D-3D registration consists of finding the 3D pose (location and orientation) of the US image slice inside the preoperative 3D volume using only image-based information.
2. Methods
To estimate the pose of the 2D US image slice inside the preoperative 3D volume, we have to find a way to reduce the amount of degrees of freedom. Our proposal is to find the pose of the 2D US image slice inside the preoperative 3D volume, exploiting the specific geometrical restrictions involved in this HIFU therapy with a transesophageal approach.
The first consideration is that the HIFU probe’s trajectory is constrained by the esophagus. In fact, the position of the esophagus in the human body is highly constrained by its surrounding organs and tissues such as the vertebral column, trachea, carotid-jugular vascularization, aortic arch, right pulmonary artery, left main bronchus, left atrium and diaphragm (Ho & Ernst 2012). Thus, we made the assumption that the probe insertion does not modify the esophageal position in the body. This constraint has a direct impact on the potential geometrical position of ultrasound probe in the human body. Consequently, for a specific US image, its origin (the apex of the image sector) is given by the position of the probe along the esophagus. A second geometrical constraint is imposed by our specific transesophageal HIFU probe. Counter to classical transesophageal echocardiography (TEE) imaging probes in which the US transducer that can rotate from 0 degree to 180 degrees to obtain different viewing planes, our prototype of the HIFU therapy probe used a US transducer which is not able to rotate. Thus, the plane acquired with this prototype corresponds with the 0 degrees view. Because the tip of the HIFU therapy probe is inside of a water-filled balloon that is used as acoustic coupling medium, we considered that the US image is perpendicular to the esophagus central axis, matching the 0 degrees orientation of TEE.
Assuming that, we were able to reduce the number of parameters to i) the depth d of the US probe along the esophagus and ii) its orientation θ around the centerline of the esophagus. In order to compensate for deviation of the esophagus centerline estimation, we also allowed a light shift (a translation) of the transesophageal probe tip position from the centerline.
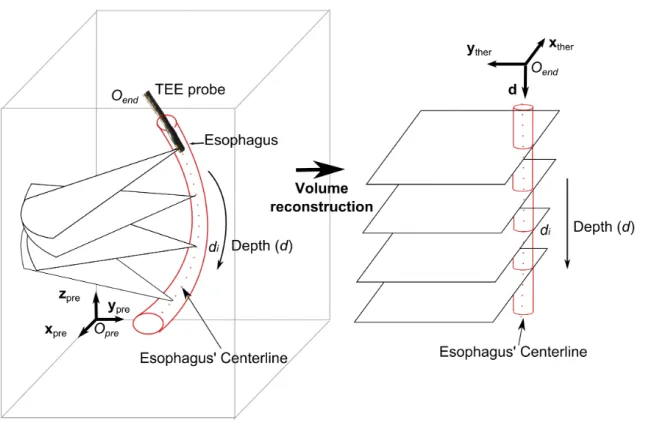
This choice will drive the global framework into two stages (Fig. 1): 1) the reformatting of the preoperative CT dataset according to the esophagus topology. The main idea is to provide CT 2D slices which potentially have the same spatial location (and so the same information) as the future TEE US 2D images; 2) an intraoperative intensity-based registration between the US image and the reformatted CT 2D slices obtained in the previous stage.
2.1. Esophagus-based volume reformatting
The goal of this resampling or reconstruction is to observe the anatomical structures in CT in the same order and orientation as the future 2D US TEE images that would be acquired during the procedure.
The preoperative volume is denoted Vprewith an associated world coordinate system (Opre; xpre, ypre, zpre) (Fig. 2-left). The TEE probe is inserted in the esophagus at a
Figure 1. The general framework of our approach. During the preoperative stage, CT datasets are reformatted following the esophagus topology. During the intraoperative stage an intensity-based registration centered in the esophagus center is performed between the US image and reformatted CT images obtained in the previous stage.
depth d from a specific insertion point Oend. We assume, for tracking purpose, that 2D US TEE images are acquired with an orientation of zero degrees, therefore the images are located on an axial plane perpendicular to the probe axis. Based on our assumption that the probe’s trajectory is constrained by the esophagus, during the insertion the US images will be a set of planes perpendicular to the esophagus centerline. From this ascertainment we proposed to create a therapy-adapted preoperative volume Vther which is made by all the sections perpendicular to the axis of the esophagus. The reference of this new volume is set as (Oend; xther, yther, d) with Oend the transesophageal probe insertion point; axis d corresponds to the esophagus’ centerline; and xtheryther define the image plane (Fig. 2-right).
The procedure to reconstruct the therapy-adapted preoperative CT image was divided into three steps: 1) the segmentation of the esophagus from the preoperative volume; 2) the definition of the centerline as a smooth spline function; and 3) the resampling of the CT using the centerline information.
Figure 2. Coordinate systems of the preoperative and the therapeutic-adapted volumes
2.1.1. Segmentation of the esophagus An automatic segmentation of the esophagus was out of our scope. So in a first step we chose to extract the inner surface of the esophagus from the preoperative volume using the software ITK-SNAP (Yushkevich, Piven, Cody Hazlett, Gimpel Smith, Ho, Gee & Gerig 2006) which proposes an implementation of the active contours segmentation in a semi-automatic mode. The user defines first a region of interest and intensity thresholds to extract the potential esophagus voxels. The active contour segmentation is initialized by spherical surfaces covering the esophagus along its major axis. The snake evolution can be manually supervised in order to avoid leakages toward other structures. A closing operator is finally used to fill the small holes.
2.1.2. Esophagus centerline function On slice i of Vpre, let Ei, the barycenter of the segmented esophagus, be a point of the centerline. This gave us a set E = {E1, E2, . . . , EN} of N centerline points. In order to obtain a smooth centerline, we fit a cubic smoothing spline (De Boor 1978) parametric function f (t) to E. On this spline, a smoothing parameter controls the trade-off between fidelity to the data and smoothness of the function estimate. In our case, we suggest to tune this parameter to get a very smooth curve to prevent the impact of the segmentation inaccuracy. The spline function was then regularly sampled using the natural parameter d(t) =Rt
t0kf
0(u)k du. This defined the d axis of the therapy-adapted preoperative volume (Fig. 2-right). We had now a set of M regularly sampled coordinates {d1, d2, . . . , dM} along the d axis in
Vther for which we have a set of M corresponding 3D points {E(d1), E(d2), . . . , E(dM)} and tangents to f at these points {f0(d1), f0(d2), . . . , f0(dM)} along the esophagus curve in Vpre.
2.1.3. Resampling of the CT For a specific coordinate di, the plane (xther, yther, di) in Vther corresponds to the 3D plane P (di) in Vpre which includes the 3D points E(di) and is perpendicular to the esophagus curve at E(di). More precisely, on this plane, we were able to define a coordinate system Ri = (E(di); ui, vi, wi) where wi is the tangent f0 of the curve f at P (di) ; ui is arbitrary set in a plane perpendicular to ypre: ui = wi× ypre ; and vi is perpendicular simultaneously to ui and wi: vi = ui× wi. We can now define a rigid transformation matrix T(di) between the reference Ri and the reference (Opre; xpre, ypre, zpre) of Vpre.
The value at any point (xt, yt, di) of Vther can now be given by the corresponding value at point (x, y, z) in Vpre with:
[x, y, z, 1]T = T(di)[xt, yt, 0, 1]T (1) It should be noted that we have a specific transformation matrix T(di) for each slice d = di of the therapy-adapted preoperative volume.
2.2. Intensity-based image registration
In this section, we will perform the registration between a specific US image (denoted IU S) and Vther. Because the TEE is ECG-gated, we were able to select from the US sequence the frames corresponding to the same cardiac phase as that of the CT volume (in our specific case 75% of the cardiac cycle (R-R interval)). The US image IU S to register was concurrently manually selected by an expert from the acquired sequences. The automatic selection was out of scope of this work, but we expect that such a selection becomes available in the future.
Because of the specificity of Vther, the registration consists of performing a 2D-2D registration between IU S and a (xt, yt) slice of Vther at a specific di. We separate the overall process into three steps: 1) finding a candidate zone of slices in Vther; 2) performing the US 2D-CT 2D registration for all the slices of this zone and; 3) estimating the most probable depth position of the probe in the zone.
2.2.1. Initialization and candidate zone definition We used various information about the transesophageal probe (inserted length, visual analysis of the image sequence during navigation, etc.) to define a candidate zone along the esophagus centerline where the image transducer center can potentially be. The size of this zone corresponded broadly to 10 mm along the esophagus. According to the depth sampling step along the esophagus, this zone covered a set of 30 to 80 adjacent slices of Vther.
2.2.2. 2D-2D registration selection In this section we will consider the 2D-2D registration between IU S and a specific slice of coordinate di in the candidate zone of Vther.
Similar to the initialization step, we first aligned the US image transducer center (the vertex of the field of view in IU S) and the esophagus center point (0, 0, di) in the slice di of Vther.
The aim of 2D-2D registration is to estimate the transformation matrix which best aligns the information in IU S to the information in the slice di of Vther.
To perform this alignment it was necessary to define three important issues: i) the kind of alignment (rigid or elastic transform), ii) the constraints of the alignment (the parameters of the transformation) and iii) the measure of the alignment (similarity metric).
The choice for the ”kind of alignment” was driven by the study of the movements and deformations introduced by the cardiac and respiration cycles (Sra & Ratnakumar 2008). In our specific case, the registered images correspond to the same cardiac phase, the deformations caused by respiration motion are small in the region of interest for therapy, and the movement of the heart during respiration is in the same direction of the probe insertion. For these reasons we chose to perform a rigid registration because the deformations caused by the cardiac cycle are mostly avoided in our application.
To define the ”constraints of the alignment” in this 2D registration, three parameters have to be estimated including the rotation angle and the two 2D coordinate positions of the rotation center.
The selection of the similarity measure depends on the nature of the image information of the involved modalities. For CT the value of the voxel intensity is related to the Hounsfield scale which gives a relatively global and homogeneous information about each tissue. In contrast, beside some specular reflections on the boundaries, in US imaging the information is mainly presented as speckle that shows some boundaries between tissues but also produces an inhomogeneous value distribution inside each tissue. There are two ways to compare image information in the process of alignment: feature-based or intensity-based. Feature-based comparison needs an additional segmentation step of the objects of interest in both image modalities. This process is usually time or computational expensive and the segmentation errors could also propagate to the posterior registration and which could have a direct impact on the final accuracy. For these reasons we chose rather to use an intensity-based approach which extracts information from gray levels without any additional process. In cardiac imaging such as US-CT, intensity-based multimodal registration has been reported by Huang et al. (Huang et al. 2009). The authors used Mutual Information (MI) to directly (or after a simple thresholding) compare CT and US cardiac images. In a previous work, we evaluated the use of different intensity-based measures reported in the literature in our application (Sandoval & Dillenseger 2013). In this study, the best similarity measures were the Woods Criterion (WC) and the Mutual Information (MI). Between these 2 methods, MI was selected because it is implemented in most of the medical
image libraries and packages.
Therefore, for a slice di we performed a 2D-2D rigid intensity-based registration with MI as similarity measure. The resulting transformation matrix is denominated T2DU S−2DCT(di).
2.2.3. Best registration result After the 2D-2D registration process on all the slices of the candidate zone, the slice of depth d which presents the highest similarity measure value after registration was considered as the final result of the registration scheme. The estimated 2D transform T2DU S2DCT(d) associated with the geometrical transform T(d) (eq. 1) gave the final 2D-3D transformation matrix :
T2DU S−3DCT = T(d) · T2DU S−2DCT(d) (2) Any 2D point (xU S, yU S) of IU S can be associated to a a 3D point (xpre, ypre, zpre) of Vpre by :
[xpre, ypre, zpre, 1]T = T2DU S−3DCT[xU S, yU S, 1]T (3) The algorithm was implemented in C++ using the Insight Segmentation and Registration Toolkit (ITK) library (Ibanez, Schroeder, Ng & Cates 2005).
3. Results
3.1. Experimental protocol
Two experiments were conducted to assess the accuracy of the proposed registration method, one on a physical phantom data, the second on real clinical data.
On either case, to perform validation for a specific US image IU S we compared the following:
• the 3D pose of IU S estimated using our proposed method (section 2). The result of this estimation is a 2D-3D transformation matrix (eq. 2) we called TRecEval. • a ground truth 3D pose of IU S. In both experiments, because no localization device
could be placed on the intracavitary probe, we had to estimate directly the pose in the original CT volume Vpre by a human expert using visual referential points. The result of this estimation is a 2D-3D transformation matrix we called TRef. The validation can be done by estimating the errors between these two 3D poses of IU S. To quantify the error, we defined specific landmarks in IU S and used the two transformations matrices TRecEval and TRef to project these points in Vpre. The estimated error, called the Target Registration Error (T RE), will be the distance between these two projected points (Fitzpatrick & West 2001):
T RE(Pj) = kTRefPj− TRecEvalPjk, (4) where Pj denotes a landmark on the US image.
The global accuracy of the CT reconstruction can then be evaluated using the mean Target Registration Error (mT RE) defined on L landmarks in IU S:
mT RE = 1 L L X j=1 T RE(Pj) (5)
3.2. Phantom study - Validation of the esophagus-based volume reformatting
This study aimed to prove that it is possible to reconstruct CT volumes based on the esophagus position with slices which correspond to TEE images (section 2.1). Hence, we compared the reconstructed CT planes and TEE images of a phantom with a known geometrical setup.
3.2.1. Data We used a commercial heart model (PVAH-01 Medical Imaging Technologies, SHELLEY Automation Inc. London, Canada) limited to the ventricles. The size of this phantom (left ventricle volume: 76 mL and right ventricle volume: 66 mL) is in the same order as a woman heart. We modified this phantom in order to include a tubular structure that simulates the esophagus (Fig. 3). We opened four windows in the tubular structure to allow the US probe to acquire some images at certain defined positions. Unfortunately, only 3 windows were usable, the fourth one was directed on the ”apex” part of the phantom with only little usable information for registration. For technical reasons the esophagus mimicking structure could not be set as close to the phantom as in the real anatomy. It was 4 − 5 cm distant from the heart instead to be adjacent. However, this allowed to include all the phantom (and so more details) in the US image field of view. The heart and esophagus models were immersed into water filling the internal region of the heart cavities and the inside of the esophagus. The water ensured the US wave propagation to image the heart phantom appropriately. We also fixed three rubber markers on the outer surface of the heart cavities to provide landmarks enabling to compute a spatial reference in the images.
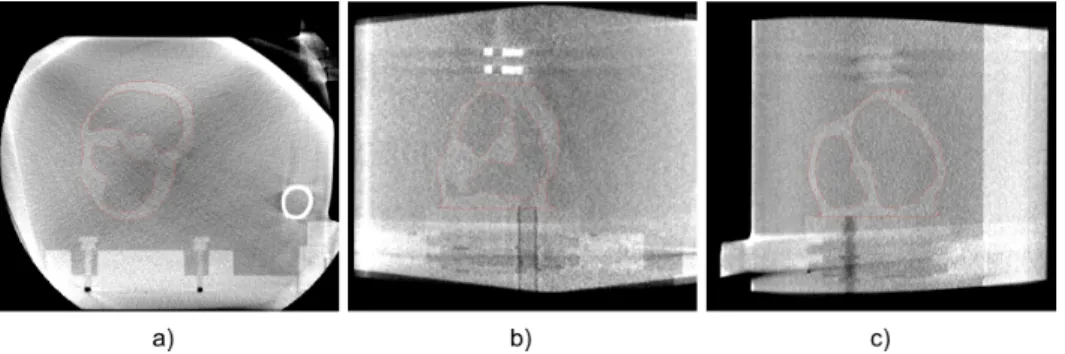
The TEE acquisitions were acquired on a Vivid Q 2D real-time cardiovascular echo system with a 6VT-D 4D TEE probe (General Electric, Healthcare, Wauwatosa, USA). On this probe we fixed the orientation angle of the acquisition plane to zero degrees. The preoperative volumes were acquired by a Cone Beam CT (CBCT) fixed on an Artis zeego C-Arm (Siemens Healthcare, Erlangen, Germany) (Fig. 4). Acquired ultrasound images had a dimension of 636 × 422 pixels with pixel size of 0.4316 × 0.4316 mm2. The CT volumes were composed by 512 × 512 × 372 voxels with a voxel size of 0.4864 × 0.4864 × 0.4864 mm3.
The TEE probe was inserted in the esophagus of the phantom and moved forward to reach the first window. On this probe position, we simultaneously acquired a 2D US image using the TEE and a 3D CT volume with the CBCT arm. The TEE probe can therefore be seen inside the esophagus at the US acquisition time in the CBCT volume. The cavities anatomy, the three rubber makers and the origin point of the TEE image
Figure 3. Physical phantom of the heart and esophagus. Three windows are opened in the simulated esophagus for TEE acquisition. Two of three markers can be seen on the outer surface of the heart.
Figure 4. CT volume of the phantom acquired with the Artis zeego C-Arm. Axial (a), coronal (b) and sagittal (c) views.
can be seen for both 2D US and 3D CT. This acquisition procedure was repeated for the other two windows.
3.2.2. Esophagus-based volume Vther The physical phantom CT image was processed as described in 2.1. A smoothed centerline was fitted from a set of 180 extracted points of segmented esophagus. From this esophagus centerline, the physical phantom CT data (Fig. 5-a and b) was processed to obtain the esophagus-based volume reconstruction
(Fig. 5-c and d). It can be seen that on this new volume, the esophagus centerline is a straight line. All the axial slices are perpendicular to the esophagus centerline. The location of the first and last slice of the reconstructed data can be seen as blue lines in Fig. 5-a.
Figure 5. Original data with segmented heart: a) mid-sagittal slice and b) a 3D view. Esophagus-based reconstructed data: c) mid-sagittal slice and d) a 3D view.
3.2.3. Ground truth The direct estimation of the IU S 3D pose in Vpre as well as the transformation matrix TRef was performed by a human expert using the software Slicer (Pieper, Halle & Kikinis 2004). Slicer allows to easily extract any oblique 3D slice from a volume and to superimpose the information from two different sources. The procedure consists of the following: i) The vertex of the IU S field of view is manually set at the center C of the TEE probe seen in Vpre; ii) The human expert performs a visual registration between the 2D US image and the CT volume. The 6 parameters of a 3D rigid transformation (3 translations and 3 rotations) that align the moving CT volume with the US image were manually tuned using the Slicer software. At each step, the superimposition of the US image and the transformed CT slice served as a
visual similarity measure. This is used to estimate the correct alignment, especially the myocardium form and the position of the fixed markers; iii) The transformation matrix provided an estimate of TRef after convergence. This process was repeated three times resulting in three transformation matrices. The final reference matrix TRef was constructed using the mean parameters of these three matrices.
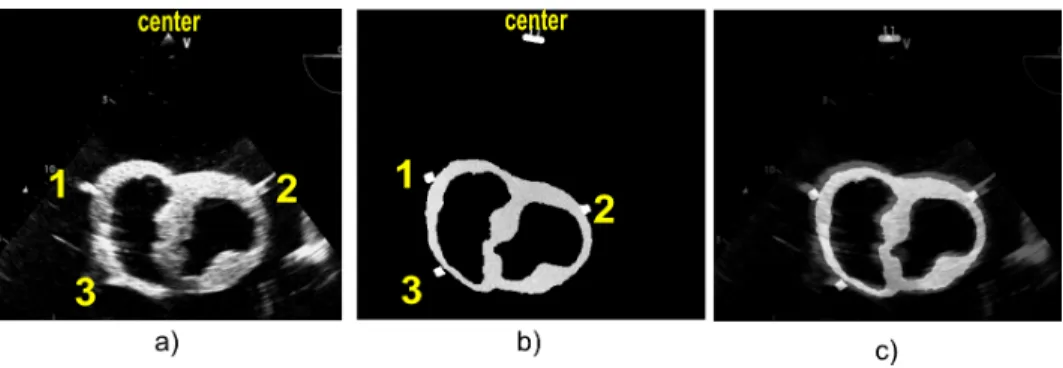
3.2.4. Registration In order to prove the validity and accuracy of our concept, we chose to reduce the number of geometrical parameters to be estimated. The transformation TRecEval is estimated in three steps. i) For a specific IU S (Fig. 6-a), the slice of coordinate di in Vther, which contains the segmented TEE tip center C, was considered the corresponding slice in the therapy-adapted preoperative volume (Fig. 6-b). On this slice, C was a common point between IU S and Vther. ii) The orientation of IU S in the corresponding slice was estimated by a rotation of IU S around C. This rotation was estimated using a 2D-2D fiducial registration procedure based on the rubber markers (Fig. 6-c). iii). The estimated 2D rotation matrix combined with T(di) gave the transformation matrix TRecEval. In order to integrate the segmentation errors, we compute TRecEval for the five slices around the presumed transducer center.
Figure 6. a) US image acquired at the TEE probe position 1 from the esophagus phantom. b) Reformatted CT image from the volume obtained after the segmentation of the heart phantom, the markers and the tip of the probe at the TEE probe position 1. c) Result of the fiducial registration.
3.2.5. Results of the phantom study As shown in Fig. 6, the myocardium form in the CT reconstruction is similar to the imaged myocardium in the US image. However, due to the speckle size, the acquired US has high boundary dispersion. The wall of the myocardium is perceived larger in the US image than in the CT volume. Moreover, the brightness of the US image seems to be too high. Although, it is difficult to see the alignment due to the quality of the US image, an error around the fiducial points is visible.
On each IU S the centers of the three rubber markers are chosen as the fiducial points Pi used to measure the T RE (eq. 4). Since the rubber markers form a large spot on the US image, each fiducial point was manually selected ten times. This allows us to include intra-observers variability in our measures.
To summarize, each fiducial point Pi, T RE(Pi) was estimated 50 times (5 slices and 10 manual selections).
Fig. 7 shows the box plots of the T RE for each fiducial points for every TEE probe position. The mT RE are always lower than 5 mm. For all the three probe positions in the esophagus, we have a minimum error lower than 3.5 mm.
Figure 7. Box plots of the Target Registration Error (T RE) at each fiducial points for each TEE probe position.
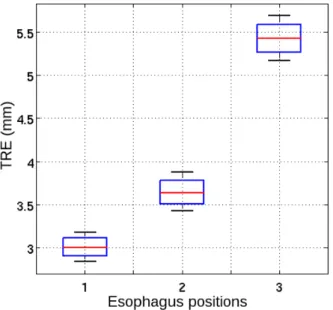
The T RE by TEE probe position are shown in Fig. 8. The mT RE is ranged between 3 mm and 5.5 mm.
Figure 8. Box plots of the Target Registration Error (T RE) for each TEE probe position.
measured as 4.03 mm.
3.3. Clinical study - Validation of 2D US to 3D CT registration
This study aimed to measure the accuracy of the proposed 2D US to 3D CT registration on real human images. To do this, we have a CT volume and a recorded TEE sequence of the same patient. This study demonstrated that the performance of the proposed registration scheme achieved clinical success with current technology and imaging protocols.
3.3.1. Data Three intraoperative US sequences and one preoperative 3D CT of a patient suffering from atrial fibrillation pathology were obtained. The US sequences were acquired from three different depths inside the esophagus using a conventional TEE probe. The rotation and inclination angles of the TEE probe was fixed on zero degrees in order to reproduce the same imaging condition. The datasets were provided by Louis Pradel University Hospital, Lyon, France.
The ECG-gated US acquisition was carried out on a Vivid-5 2D real-time cardiovascular echo system (General Electric, Healthcare, Wauwatosa, USA). One cardiac cycle was recorded as a sequence of 46 frames. The dimension of each frame was 636 × 420 voxels with an image spacing of 0.35278 × 0.35278 mm2.
An ECG-gated cardiac multislice CT image was acquired after injection of contrast agent with a Philips 64-slice scanner (Brilliance CT, Philips Healtcare) at 75% of cardiac cycle (R-R interval). The dimension of the reconstructed image was 512 × 512 × 395 voxels with an image spacing of 0.546875 × 0.546875 × 0.44998169 mm3.
3.3.2. Esophagus-based volume Vther The clinical CT image was processed as described in 2.2. The result of the esophagus segmentation can be seen on Fig. 9-a. The Esophagus-based reformatted volume Vther is shown in Fig. 9-b.
3.3.3. Ground truth The procedure to obtain the ground truth and TRef is similar to the one followed for the phantom study. For a specific IU S, the medical expert (a senior radiologist) first marked some fiducial points in both 2D US and CT volume. This allowed an initial registration. The expert then aligned interactively and visually the 2D US and on the CT volume using the software Slicer. The six parameters of a rigid transformation (3 translations and 3 rotations) were also set manually until visual convergence. This process was repeated three times resulting in three transformation matrices. The final reference matrix TRef was constructed using the mean parameters of these three matrices.
3.3.4. Registration For a specific IU S of the clinical study, we chose interactively in Vther an interval of 20 slices along the esophagus centerline as candidate zone. The registration was then performed as described in 2.2: 2D-2D rigid registration for each
Figure 9. Esophagus-based volume Vther construction steps: a) Esophagus
segmentation in Vpre; b) Esophagus-based reformatted volume Vther
slice and selection of the slice with the highest similarity value. Fig. 10-a shows the superimposition of IU S to the corresponding reformatted slice after registration. Fig. 10-b shows the final 2D US registration to 3D CT volume using the estimated final transformation matrix. In this 3D view, the segmented esophagus is shown in green, and red represents the left atrium segmented for the preclinical target definition (Tobon-Gomez, Geers, Peters, Weese, Pinto, Karim, Ammar, Daoudi, Margeta, Sandoval et al. 2015).
On a classical PC without any optimization, the mean computation time for the registration process is 5.11 s with a standard deviation of 0.98 s for each reconstructed image.
3.3.5. Results of the clinical study For each of the three US images, some corresponding fiducial points were marked by our medical expert in both the US image (Fig. 11-a) and the 3D CT volume Vpre (Fig. 11-b). The registration is then performed as described previously. The transformation matrix of the best 2D-2D registration result of the US image and the reformatted CT slice of Vther (Fig. 11-c) was used to project the fiducial points of IU S to Vpre. This allowed to determine the T RE for each fiducial point (Fig. 11-d). The framework has been repeated 10 times for the three TEE positions.
The registration process was able to estimate an insertion length for each TEE position, 15.9, 62.1 and 78.9 mm respectively, from a specific reference entrance point Oend. The box plots of the T RE at the three different depths inside the esophagus are
Figure 10. Registration results. a) superimposition of the 2D US to the corresponding 2D reformatted CT slice. b) final 2D US to 3D CT registration.
shown in Fig. 12. For the two US images close to the insertion point of the TEE (Image 1 and 2), the mT RE was 3.5 mm, and for the third image which was farther from the insertion point, the mT RE increased to 9.5 mm.
The global mT RE including all the fiducial points is 5.6 mm.
4. Discussions
4.1. Phantom study - Accuracy of Esophagus-based volume reformatting
The error for the fiducial points in each window shows that the position of the reformatted slice is around the position of the corresponding slice of the ground truth. However, with the orientation sometimes towards the left or right, or similar to window 2, the slice is oriented upwards. Also, we can observe that the error of the points closest to the vertex (fiducial 1 and 2) are not the smallest for all windows as expected given the mechanical constrictions of the probe. The transesophageal probe is flexible and follows the anatomical curves, but the tip of the probe is rigid. So, we assume that the differences between the reconstructed slice and the TEE image should be due to light displacement of the tip extremity, rather than an inclination of the tip. As the error shows the inclination of the reconstructed slice but without a global tendency, we believe that the reconstruction is sensitive to the small changes in the centerline. One of the principal sources of error in the centerline extraction, that could produce these small changes, is the segmentation process of the esophagus in the phantom images. The segmentation is challenging because the acquired images of the phantom present some artifacts introduced by the frame that supports the phantom. Also, the local morphological operations used to fill the holes of the windows can modify the real
Figure 11. Fiducial points marked in the a) US image and in the b) CT volume by the expert are presented. c) The best 2D-2D registration result of the US image and a reformatted CT slice. d) T RE for each fiducial point.
position of the centerline. However these are not sources of error in human data. As displayed in Fig. 8, we can see that the error increases in relation to the depth. The bigger error corresponds with the probe that is farthest from the insertion place. We can conclude from the measures that if the depth increases, the probe moves away from the centerline. We believe that the probe tip gains some freedom, thus it can move away from the estimated esophagus centerline.
4.2. Clinical study - Accuracy of 2D US to 3D CT registration
From Fig. 12, we can observe that the error increases while the TEE tip is progressing in the esophagus. This phenomenon has already be reported in the phantom study. Some more accuracy could probably be gained by considering the estimated pose as a starting point for performing a 6 degrees of freedom registration around it. The consequence
Figure 12. Box plots of the Target Registration Error (T RE) at three different depths inside the esophagus
would be an expense in computation time.
Concerning the registration accuracy, The global mT RE of 5.6 mm is on the same order of magnitude as those reported in the literature: less than 5 mm for (Lang et al. 2013) and 1.5 − 4.2 mm for (Gao et al. 2012). However, in those approaches, more information was available than in our case. For example Lang. et al. used a combination of two cross sections and/or 3D-TEE images to perform the registration and the target was segmented manually in the US images. In addition, a manual selection of the cross section was needed for a good initialization (Lang et al. 2013). In their approach, Gao et al. used X-Ray fluoroscopy as an intraoperative intermediate imaging system combined with a 3D model of the US imaging tip. They also needed a 3D US probe and a manual pre-positioning of the 3D pose of the 3D model before registration (Gao et al. 2012).
Beside the fact that the registration will give a 3D intraoperative view of the cardiac and extra cardiac structures to improve US navigation and to avoid sites where acoustic fences might avoid a proper focus of the US beam, its accuracy seems also to be in the range of the acceptable errors for the therapy. The goal of the therapy is to juxtapose thermal lesions to create a line of electrical isolation of a pathological zone. RF catheter ablation usually requires a 6 mm point by point inter-lesion distance to get a proper isolating line (Wolf, El Haddad, Fedida, Taghji, Van Beeumen, Strisciuglio, De Pooter, Lepi`ece, Vandekerckhove, Tavernier et al. 2018). We can thus suppose that the correlation in between US and CT should need to be under 1 cm, but some dosimetric study on transesophageal HIFU and cardiac ablation must be conducted to confirm this assumption.
The primary limitation of our method is the esophagus segmentation step. It is actually performed using the semi-automatic active-contour segmentation method. The viability of our registration step is directly related to a precise Vther which depends on an accurate esophagus centerline estimation. We believe that the smoothing splines compensates for the segmentation uncertainties provided by the human expert. More tests should be performed to verify this hypothesis. On the other hand, a more automatic and accurate segmentation method could overcome this limitation.
On a standard PC (HP Z800, 8xIntel RXeon R CPU E5620@2.40GHz, 24 GB RAM),
without optimization, the time spend for the registration process is about 5.11 ± 0.98 s which could be considered as prohibitive for a real time intraoperative usage. This time is mostly spent by the 2D/2D registration procedure which could be speed up by the implementation of the latest optimized methods and the use of GPU (MI is a good candidate for parallel computing).
5. Conclusion
We have proposed a novel 2D-US to 3D-CT registration approach adapted to the guidance of the atrial fibrillation transesophageal HIFU therapy. Our approach takes advantage of the anatomical constraints imposed at the transesophageal HIFU probe to simplify the registration process. The method was successfully evaluated on a human dataset acquired from a patient with cardiac arrhythmia pathology. Our method exhibited level of performance and accuracy equivalent to previous approaches. However, compared to the other methods, our procedure requires only a light manual initialization (choice of the cardiac phase, very rough estimation of the probe along the esophagus) and no time consuming manual pre-positioning or manual selection of cross sections for proper initialization. Moreover, there is no need for any extra intermediate intraoperative external ionizing imaging device for the registration in our procedure.
Acknowledgments
This work was part of the CardioUSgHIFU 11-TECS-0004) and CHORUS (ANR-17-CE19-0017) projects which have been supported by the French National Research Agency (ANR).
References
Bessiere, F., N’djin, W. A., Colas, E. C., Chavrier, F., Greillier, P., Chapelon, J. Y., Chevalier, P. & Lafon, C. (2016). Ultrasound-guided transesophageal high-intensity focused ultrasound cardiac ablation in a beating heart: A pilot feasibility study in pigs, Ultrasound Med Biol. 42(8): 1848– 1861.
Constanciel, E., N’Djin, W., Bessiere, F., Chavrier, F., Grinberg, D., Vignot, A., Chevalier, P., Chapelon, J. & Lafon, C. (2013). Design and evaluation of a transesophageal HIFU probe for ultrasound-guided cardiac ablation: simulation of a hifu mini-maze procedure and preliminary ex vivo trials, IEEE Trans Ultrason Ferroelectr Freq Control 60(9): 1868–1883.
De Boor, C. (1978). A practical guide to splines, Springer-Verlag New York.
Fitzpatrick, J. & West, J. (2001). The distribution of target registration error in rigid-body point-based registration, IEEE Trans Med Imaging 20(9): 917–927.
Franz, A., Haidegger, T., Birkfellner, W., Cleary, K., Peters, T. & Maier-Hein, L. (2014). Electromagnetic tracking in medicine: a review of technology, validation, and applications., IEEE Trans Med Imaging 33(8): 1702–1725.
Gao, G., Penney, G., Ma, Y., Gogin, N., Cathier, P. et al. (2012). Registration of 3D trans-esophageal echocardiography to X-ray fluoroscopy using image-based probe tracking, Med Image Anal 16(1): 38–49.
Ho, S. Y. & Ernst, S. (2012). Anatomy for Cardiac Electrophysiologists: A Practical Handbook, Cardiotext.
Huang, S. & Miller, J. (2014). Catheter Ablation of Cardiac Arrhythmias, 3rd edition edn, Elsevier. Huang, X., Moore, J., Guiraudon, G., Jones, D., Bainbridge, D., Ren, J. & Peters, T. (2009). Dynamic
2D ultrasound and 3D CT image registration of the beating beart, IEEE Trans Med Imaging 28(8): 1179–1189.
Ibanez, L., Schroeder, W., Ng, L. & Cates, J. (2005). The ITK Software Guide, second edn, Kitware, Inc., http://www.itk.org/ItkSoftwareGuide.pdf.
Lang, P., Chu, M., Bainbridge, D., Guiraudon, G., Jones, D. & Peters, T. (2013). Surface-based CT-TEE registration of the aortic root, IEEE Trans Biomed Eng 60(12): 3382–3390.
Linte, C. A., Moore, J., Wedlake, C., Bainbridge, D., Guiraudon, G., Jones, D. & Peters, T. (2009). Inside the beating heart: an in vivo feasibility study on fusing pre- and intra-operative imaging for minimally invasive therapy, Int J Comput Assist Radiol Surg 4(2): 113–123.
Pieper, S., Halle, M. & Kikinis, R. (2004). 3D slicer, 2nd IEEE International Symposium on Biomedical Imaging, Arlington, pp. 632–635.
URL:http://www.slicer.org/
Sandoval, Z. & Dillenseger, J.-L. (2013). Intensity-based similarity measures evaluation for CT to ultrasound 2D registration, IRBM 34(4-5): 278–282.
Sra, J. & Ratnakumar, S. (2008). Cardiac image registration of the left atrium and pulmonary veins, Heart Rhythm 5(4): 609–617.
Tobon-Gomez, C., Geers, A. J., Peters, J., Weese, J., Pinto, K., Karim, R., Ammar, M., Daoudi, A., Margeta, J., Sandoval, Z. et al. (2015). Benchmark for algorithms segmenting the left atrium from 3D CT and MRI datasets, IEEE Trans Med Imag 34(7): 1460–1473.
Wolf, M., El Haddad, M., Fedida, J., Taghji, P., Van Beeumen, K., Strisciuglio, T., De Pooter, J., Lepi`ece, C., Vandekerckhove, Y., Tavernier, R. et al. (2018). Evaluation of left atrial linear ablation using contiguous and optimized radiofrequency lesions: the aline study, EP Europace . Yin, X., Epstein, L. & Hynynen, K. (2006). Noninvasive transesophageal cardiac thermal ablation using a 2-D focused, ultrasound phased array: a simulation study, IEEE Trans Ultrason Ferroelectr Freq Control 53(6): 1138–1149.
Yushkevich, P. A., Piven, J., Cody Hazlett, H., Gimpel Smith, R., Ho, S., Gee, J. C. & Gerig, G. (2006). User-guided 3D active contour segmentation of anatomical structures: significantly improved efficiency and reliability, Neuroimage 31(3): 1116–1128.