Publisher’s version / Version de l'éditeur:
Journal of Glaciology, 22, 88, pp. 513-528, 1979
READ THESE TERMS AND CONDITIONS CAREFULLY BEFORE USING THIS WEBSITE. https://nrc-publications.canada.ca/eng/copyright
Vous avez des questions? Nous pouvons vous aider. Pour communiquer directement avec un auteur, consultez la première page de la revue dans laquelle son article a été publié afin de trouver ses coordonnées. Si vous n’arrivez pas à les repérer, communiquez avec nous à [email protected].
Questions? Contact the NRC Publications Archive team at
[email protected]. If you wish to email the authors directly, please see the first page of the publication for their contact information.
NRC Publications Archive
Archives des publications du CNRC
This publication could be one of several versions: author’s original, accepted manuscript or the publisher’s version. / La version de cette publication peut être l’une des suivantes : la version prépublication de l’auteur, la version acceptée du manuscrit ou la version de l’éditeur.
Access and use of this website and the material on it are subject to the Terms and Conditions set forth at
Time-series modelling of avalanche activity from meteorological date
Salway, A. A.
https://publications-cnrc.canada.ca/fra/droits
L’accès à ce site Web et l’utilisation de son contenu sont assujettis aux conditions présentées dans le site LISEZ CES CONDITIONS ATTENTIVEMENT AVANT D’UTILISER CE SITE WEB.
NRC Publications Record / Notice d'Archives des publications de CNRC:
https://nrc-publications.canada.ca/eng/view/object/?id=22e9c775-81c1-4e89-a129-8df4f2759877 https://publications-cnrc.canada.ca/fra/voir/objet/?id=22e9c775-81c1-4e89-a129-8df4f2759877Ser
TH1
,N21d
I
I
no.915
' cop.
2
I
+
National Research Conseil nationalCound Canada de recherches Canada
TIMESERIES MODELLING
OF AVALANCHE ACTIVITY
FROM METEOROLOGICAL DATA
Reprinted fim
Journal of Glaciology Vol. 22, No. 88, 1979
p. 513
-
528DBR Paper No. 915
Division of Building Research
This publication i s being d i s t r i b u t e d by the Division of Building R e s e a r c h of the National R e s e a r c h Council of Canada. It should not be reproduced in whole o r in p a r t without p e r m i s s i o n of the original publisher. T h e Di- vision would be glad to be of a s s i s t a n c e i n obtaining such p e r m i s s i o n .
Publications of the Division m a y be obtained by m a i l - ing the a p p r o p r i a t e r e m i t t a n c e (a Bank, E x p r e s s . o r P o s t Office Money Order, o r a cheque, m a d e payable t o the R e c e i v e r G e n e r a l of Canada, c r e d i t NRC) t o the National R e s e a r c h Council of Canada, Ottawa. K I A OR6. Stamps a r e not acceptable.
A l i s t of allptiblications of the Division i s available and m a y be obtained f r o m the Publication# Sectioh, Division of Building Research, National R e s e a r c h Council of Canada. Ottawa. KlAOR6,
Journal o/GMlogv, Vol. 22, No. 88, 1979
T I M E - S E R I E S M O D E L L I N G O F A V A L A N C H E A C T I V I T Y
F R O M M E T E O R O L O G I C A L D A T A
(Division of Building Research, National Research Council of Canada, B.C. Regional Station, 3904 West 4th Avenue, Vancouver, British Columbia V6R rP5, Canada)
.\I~STRACT. Avalanche-hazard evaluation by field analysts is largely achieved along causal intuitive lines, depending for its success upon the experience of the analyst in his particular area. Several attempts have been made in the past to quantify such procedures by means of statistical models based upon meteorological measurements. Modified forms of a multivariate technique known as linear discriminant analysis have been tried with only partial success. Intercorrelated variables and autocorrelated data, omission of time-lagged terms, insufficient variation in the dependent variable, and sampling difficulties may have combined to weaken the discriminant approach. These problems and the nature of the phenomenon suggest that a stochastic transfer-function time-series approach may be a useful alternative method.
A numerical weighting scheme has been devised for the representation of avalanche activity for the Rogers pass area of British Columbia in terms of terminus, size, and moisture-content codes for each Event. From various types of correlation analysis performed on data for the period 1965-73, models were developed using the "best" weighting scheme for avalanche activity representation and the most promising meteoro- logical variables, as indicated by the results of the correlation analysis.
These relatively simple models demonstrate a good fit to the actual data, in both a descriptive and a simulated-forecasting situation.
Rbsu~6. Modelisation de se'ries chronologiques de l'activite' &s avalanches d partir de donne'es me'~orologiques. L'eslimation du danger d'avalanche par des observateurs sur le terrain est en grande partie baste sur des dtductions intuitive, dont le succts dkpend de l'exptrience personnelle de l'observateur dans son secteur particulier, On a fait plusieurs tentatives dans le passt pour quantifier ces processus par des modtles statisti- q u a basts sur des donntes mttkorologiques. Des formes dtrivtes de la technique d'analyses i variables multiples, connues sous le nom d'analyses linkaires discriminantes, ont t t t essaytes avec un succl-s seulernent partiel. Des variables likes entre elles et des donntes auto-corrtltes, l'omission de termes de dtcalage dans le temps, l'insuffisance des variatidns des valeurs de la variable dtpendante et les difficultts d'bchantillonnage se sont combintes pour affaiblir l'efficacitt de l'approche discriminante. Ces problkmes et la nature du phtnomkne font penser que l'on peut recourir A une approche d'une fonction stochastique de transfert de - - s t r i a chronologiques.
Un schtma numtriqhe de pondtration a t t t irnagint pour la reprtsentation de l'activitt des avalanchk dans le secteur de Rogers Pass en Colombie Britannique par des codes donnant pour chaque Cvtnement le point extreme d'arriv&, l'ttendue et le taux d'humidict. ~iffkrents types dlanaly& de corrslation appliquts aux donnCes de la ptriode 1965-73 ont t t t mis au point, utilisant le schtma "optimum" de pondkration pour reprksenter l'activitk des avalanches et les variables mCttorologiques les plus significatives selon les rksultats des analyses de corrtlation.
Les courbes de prtvision construites d'aprb ces modtles relativement simples montrent une bonne concordance avec les donnCes rCelles, aussi bien pour la description que pour la prkvision d'une situation. ZUSAMMENPASSUNG. <eitreihenmodelle &r Lawinentatigkeit a m meteorologischen Daten. Die Auswertung von Lawinenabgangen durch Feldbeobachtuna folat meist intuitiven Kausalketten: ihr Erfolg hangt von der Erfahrung des Eeobachters in seinem spezi$len%ebiet ab. In der vergangenheit wurden mehrerk Versuche zur Quantifizierung solcher Verfahren mit Hilfe von statistischen Modellen auf der Grundlage meteoro- logischer Messungen unternommen. Modifizierte Formen einer mehrparametrigen Technik, der sog. linearen Unterscheidungsanalyse, brachten nur teilweisen Erfolg. Dies liegt an der Korrelation der Variablen und der Autokorrelation der Daten, an der Vernachlassigung von zeitverzogeten Termen, an der ungenu- genden Variation der abhangigen Variablen und an den Schwierigkeiten der Datengewinnung. Diese Probleme und die Natur des Phanomens legen es nahe, Zeitreihen auf der Basis von stochastischen Ubertragungsfunktionen zu verwenden.
Fiir die Erfassung der Lawinentatigkeit im Gebiet des Rogers-Passes, British-Columbia, wurde ein numerisches Wichtungsschema entwickelt, das Ende, Grosse und Feuchtigkeitsgehalt jedes Abganges berucksichtigt. Anhand von Daten fur die Periode 1965-73 wurden Modelle mit verschiedenen Typen der Korrelationsanalyse entwickelt, wobei auf Grund der Ergebnisse der Korrelationsanalysen das "beste" Wichtungsschema fiir die Wiedergabe der Lawinentatigkeit und die meistversprechenden meteorologischen Variablen herangezogen wurden.
Vorhersageprofile, abgeleitet aus diesen relativ einfachen Modellen, zeigen gute ubereinstimmung rnit den tatsachlichen Daten, sowohl in einer beschreibenden wie in einer simulierten vorhersagenden Situation.
5'4 J O U P N A L O F G L A C I O L O G Y
index of avalanche activity, dependent variable predicted value of
2'-
snow-pack depth new-snow depth precipitation
maximum air temperature minimum air temperature wind speed
north component of wind speed west component of wind speed south component of wind speed east component of wind speed relative humidity
independent variable deviation from mean of X deviation from mean of
2'-
sample correlation coefficient between x and y number of observations in the sample
time
input time series output time series time lag
sample autocorrelation functions sample cross-correlation function sample variances
sample covariances autoregressive coefficient moving average coefficient
number of autoregressive coefficients number of moving average coefficients backward-shift operator, e.g. Bxt = xt-, difference operator, e.g. Vxt = x t - x t - ,
white-noise series
transformed output series after prewhitening input series transfer-function coefficient for primary input series stochastic noise series
transformed stochastic noise series after prewhitening input series transfer-function coefficient for secondary input series
transfer-function coefficient estimates residual error
At a n elevation of approximately 4 350 ft ( I 330 m), Rogers Pass provides an iniportant
east-west route through the Selkirk Mountains of British Columbia via the Trans-Canada Highway and the Canadian Pacific Railway. I t is one of the most active avalanche areas in western Canada. A combination of steep-sided mountains, a characteristic of the Selkirk Range, and heavy winter snowfall has produced more than ninety major avalanche sites that affect a 50 km length of highway from the east gate of Glacier National Park to just beyond
T I M E - S E R I E S M O D E L L I N G O F A V A L A N C H E A C T I V I T Y 5I5
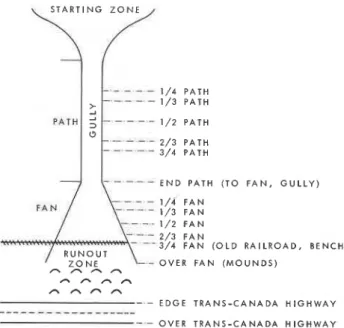
the western boundary. The greatest concentration of sites exists between two narrow defiles formed by Mounts Tupper and MacDonald, just east of the Pass, and Mounts Fidelity and Fortitude in the western section. Slope aspects are predominantly north and south. Some of the sites are on open slopes but most are mountain gullies with well-defined scree fans as depicted in Figure I . 1 / 4 P A T H
1
1
I I
1 1 3 P A T H 1/2 P A T H ---
-,- 2/3 P A T H 3 / 4 P A T H3
\--
- - -
E N D P A T H ( T O F A N , G U L L Y ) 1/4 F A N 1 / 3 F A N -FAY
\
=
I
:
1/2 F A N 2/3 F A N 3 / 4 F A N ( O L D R A I L R O A D , B E N C H ) - O V E R F A N ( M O U N D S ) norm n n n n-
- E D G E T R A N S - C A N A D A H I G H W A Y--- - ---
- - O V E R T R A N S - C A N A D A H I G H W A YFig. I . Tyfiical Rogers Pass avalanche site.
The Snow Research and Avalanche Warning Section (SRAWS) of Parks Canada conducts an ongoing programme of avalanche-hazard evaluation and control for the area. Operational objectives are to maintain an optimum balance between minimum highway closure time and the safety of the public and Parks personnel. This balance can only be achieved by the accurate evaluation of avalanche hazard backed by prompt action in the form of highway closure where necessary and appropriate use of artillery to cause avalanching under controlled conditions.
Avalanche-hazard evaluation relies essentially on three factors: the stability of the layers in the upper section of the snow-pack, the stability of the lower layers, and the availability of snow for avalanching at each site. Avalanches are often triggered by new snow in the starting zones, whereas both upper and lower layers further down the path may provide snow for the main mass of the avalanche. This hazard evaluation is made by the field analyst, often intuitively, depending for success upon his experience in the area.
I t is not always possible, however, to identify periods of instability intuitively. This paper is concerned with the problem of statistical estimation and prediction of avalanche activity using meteorological data and analytical techniques. Mathematical models have been developed that describe the phenomenon in terms of the statistical behaviour of previous avalanche and meteorological patterns. It is hoped that such models will become a useful tool enabling the field analyst to evaluate the hazard situation more accurately and to identify and predict periods of instability with greater certainty.
516 J O U R N A L O F G L A C I O L O G Y
Various attempts have been made, notably by Judson and Erickson (1973)~ Bois and others ([1975]), Fohn and others (1g77), and Bovis (1974, 1976, 1g77), to produce forecasting models for avalanche occurrences using modified forms of a multivariate statistical technique known as linear discriminant analysis. This procedure involves the assignment of cases into two or more groups, using linear discriminant functions. These functions consist of linear combinations of independent variables multiplied by appropriate coefficients (least-squares estimates) obtained by maximizing the ratio of the between groups variances to the within- groups variances (Rao, I 952).
Lagged variables
Current avalanche activity is affected by previous avalanching, precipitation, temperature, wind, and other weather variables. Models produced by the application of discriminant procedures rely on current weather variables, although Judson and Erickson (1973) intrb- duced certain arbitrary decay terms to overcome this deficiency. Bovis (1974, 1976, 1977), Bois and others ([1g75]), and Fohn and others (1977) used terms summed or averaged over several days prior to a n avalanche day. Perla and Judson (1973) investigated the possibility of introducing fading memory terms, without arbitrary factors, into the discriminant analysis procedures. Discriminant analysis, however, does not readily lend itself to time-series applica- tions.
A stochastic transfer-function time-series approach uses lagged values of variables such as precipitation, temperature, and wind. The coefficients of these terms are least-squares best estimates determined from actual data.
Intercorrelated variables and autocorrelated data
Strong interrelations of independent variables, a normal feature of weather data, are not handled well by conventional regression and discriminant methods. Furthermore, the meteorological time series are usually quite strongly autocorrelated, that is, adjacent observa- tions in time are not independent. Variable selection procedures such as forwards selection, backwards elimination or stepwise selection tend to break down. Models are produced that do not necessarily contain the "best" set of independent variables (Draper and Smith, 1966, P. 163-95).
Time-series analysis procedures operate on dependent observations "where the nature of this dependence is of interest in itself" (Box and Jenkins, 1970, p. vii).
Variation of the dependent variable
Assigning all avalanche days to one class, whether the level of activity is high or low, may not be desirable. If avalanche activity can be treated as a n ordinary dependent variable, allowing it to take on values corresponding to various levels of activity, it may more accurately reflect the changing meteorological conditions that give rise to the phenomenon.
Bovis ( 1 974, 1976, 1977), has tried to overcome this drawback in the discriminant approach
by stratifying avalanche events on the basis of magnitude for both dry and wet seasons. He recognizes that "The conditions which lead to a n avalanche day having only one event are likely to be quite different from those which lead to days which involve a major avalanche 'cycle'" (Bovis, 1977, p. 94). Four magnitude classes of avalanche activity are recognized for an area. Stratification of events in this way, however, results in a reduction of the sample sizes. If the groups are too small, the discriminant analysis procedure breaks down. Overfitting may also occur when the number of independent variables is too large relative to the sample sizes. Assigning a range of values to avalanche activity eliminates the need for stratification.
T I M E - S E R I E S M O D E L L I N G O F A V A L A N C H E A C T I V I T Y 5'7
Data imbalance between avalanche days and non-avalanche days
There is an imbalance between avalanche and non-avalanche days. Strong differences exist between the group variances, particularly for precipitation terms, and there are usually far more non-avalanche days. This can result in discriminant functions biased in the direction of the non-avalanche group, so that a greater proportion of avalanche days are misclassified than are non-avalanche days. To overcome this difficulty, Judson and Erickson (1973) use a weighted average of the discriminant means for each group as their discriminant index. This causes the probabilities of misclassification for avalanche and non-avalanche days to be approximately equal, but does little to improve the overall classification scheme.
Bois and others ([1g75]) and Bovis (1974, 1976, 1977) equalized their discriminant groups by selecting a random sample of non-avalanche days equal in number to the avalanche days. The autocorrelation functions of meteorological and avalanche series may contain information about the processes involved and should probably not be eliminated by random sampling. Serial correlations can be exploited by use of time-series procedures.
AVALANCHE ACTIVITY AS A DEPENDENT VARIABLE
Field observations of avalanche occurrences
Naturally occurring avalanches are generally recorded twice daily at Rogers Pass, often after the event and according to a prescribed format. The site name, date, and, if possible, the time of occurrence are noted, along with the observer's estimate of size, terminus, and moisture content, as indicated by the designations in Table I and Figure I . Continuous
monitoring of such an intermittent phenomenon is often difficult owing to limitations on the availability of personnel, high hazard, and poor visibility, particularly during periods of intense activity when observations are most needed. These problems, combined with the necessarily subjective nature of the measurements, set a limit on the overall accuracy of the data and ultimately determine the level of random noise in the prediction models. Artificially released avalanches are noted during artillery application and can therefore be timed reliably when visibility is good. Artillery control is performed whenever the field analyst considers that the probability of avalanching is high. Size, terminus, and moisture content are also recorded whenever possible.
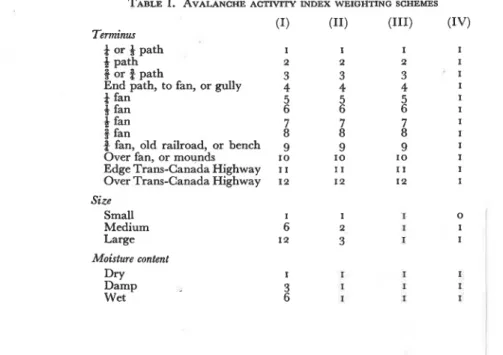
TABLE I. AVALANCHE A CINDEX W E I O H ~ N G ~ S C H E ~ S Teminuc (1) (11) (111)
f or
+
path I I I4 path 2 2 2
3 or f path 3 3 3
End path, to fan, or gully 4 4 4
f fan 5 5 5
f fan 6 6 6
) fan 7 7 7
8 fan 8 8 8
f fan, old railroad, or bench g 9 9 Over fan, or mounds 10 10 10
Edge Trans-Canada Highway I I I I I I
Over Trans-Canada Highway I 2 1 2 12 Size Small I I I Medium 6 2 1 Large 1 2 3 I Moisture content Dry I I I Damp 3 I I Wet 6 I I
5 1 ~ J O U R N A L O F G L A C I O L O G Y
For both artificially produced and naturally occurring avalanches, size is estimated in relation to the particular site, either from the visual appearance of the site and size of the deposit (for those that occur naturally, after the event) or from a visual impression of mass and energy if the avalanche is actually observed, as is often the case with those that are brought down artificially. Size is designated by the field observer as small, medium, or large.
The terminus classification gives an indication of the farthest point reached by the avalanche but does not include any information on the actual distance travelled. A low cloud base frequently obscures the starting zone, thereby preventing the point of origin or fracture line from being recorded. As individual sites consistently avalanche from the same rupture area, often at the base of cliffs, the terminus can be regarded as a n index of distance travelled. Moisture content is estimated by the observer from the appearance of the snow in the avalanche deposit or by gently squeezing a sample. If no ball forms, it is classed as dry; if one does form, it is damp; and if the surface becomes glassy, it is wet.
Avalanche activity index
Dejnition and physical interpretation. Prior to the application of statistical time-series pro- cedures it was necessary to devise a suitable index of avalanche activity that could be used as a dependent variable. An index of mass movement (Salway, unpublished) was therefore defined as the product of terminus, size, and moisture content for a particular event after appropriate numerical codes had been assigned to these designations, as shown in Table I. For example, using the codes shown in the first column (weighting scheme (I)), a damp avalanche of medium size running
4
fan would have an index given by:Avalanche activity index = (3
x
6x
5 ) = goThis index may be a good measure of avalanche activity. It includes not only size, and therefore an indication of the amount of snow picked up from lower zones after the initial movement, but also a measure of the energy associated with the avalanche in terms of the farthest point reached. Moisture content of the resulting deposit also is directly related to the type of the avalanche.
Computation. The avalanche activity index, when computed for individual events, can be summed for all sites or for a group of sites on a daily basis, resulting in values of avalanche activity that vary smoothly and continuously, lending themselves to the successful application of multiple regression or time-series techniques. LaChapelle (1970, p. 106) recognized that the greatest potential of the statistical approach lies in this direction when he stated that it "is most useful when dealing with hazard probabilities over large areas, where individual avalanches fall effectively at random, but the patterns of their occurrence in time are related to snow and weather". Effects of random errors caused by individual site peculiarities, the subjective nature of the data, and occasional unobserved avalanches are minimized. Not only does the index contain the three basic characteristics of the avalanches measured at Rogers Pass but the relative contribution of each measurement can be altered by choosing a different set of weights.
METEOROLOGICAL VARIABLES
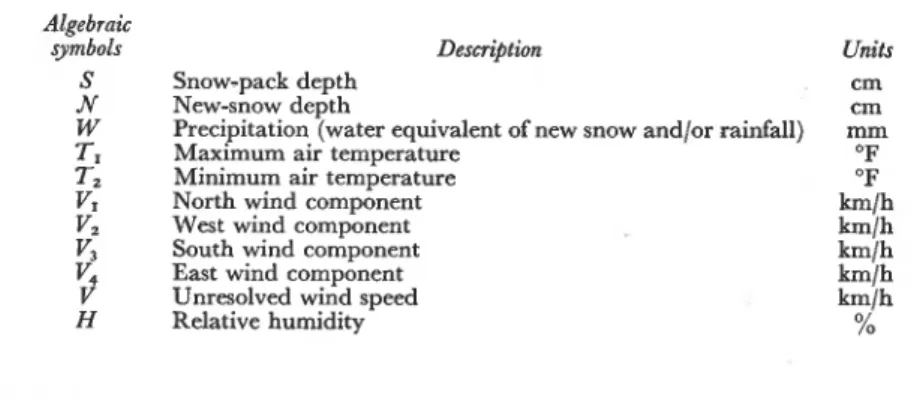
Meteorological data from the Rogers Pass observatory for the period 1965-73 were transcribed from field books and stored on computer tape. They consist of daily observations of snow-pack depth, new-snow depth, precipitation, maximum and minimum air temperature, average wind speed and direction, and relative humidity. Table I1 lists these primary meteorological variables together with assigned symbols for future reference. Such primary factors, which are known to have considerable influence on avalanche activity, and certain secondary factors formed from the primary terms were included in the analyses.
T I M E - S E R I E S M O D E L L I N G O F A V A L A N C H E A C T I V I T Y
TABLE 11. METEOROLOGICAL VARIABLES Algebraic
symbols Description
S Snow-pack depth
N New-snow depth
W Precipitation (water equivalent of new snow and/or rainfall)
7, Maximum air temperature
Tz Minimum air temperature V North wind component V , West wind component V3 South wind component
East wind component Unresolved wind speed H Relative humidity Units cm cm mm O F "F h / h h / h km/h km/h km/h % CORRELATION ANALYSES
Several correlation-analysis procedures were performed in order to identify appropriate starting, finishing, and transition dates for avalanche activity periods, the "best" avalanche- activity weighting schemes and most suitable meteorological variables to be used in the subsequent development of the time-series models (Salway, unpublished). Simple linear correlation coefficients were used to provide a good initial indication of the potential strength of models based on these variables. They are defined by the familiar equation
2
(X-X) (Y- F )where Y and X are dependent and independent variables, respectively, and M is the number of observations in the sample.
Data-selection computer program
I n order to allow complete flexibility in the application of the various types of analysis, a data-selection computer program was written. It takes the meteorological information for one or more ranges of dates, computes the appropriate avalanche activity indices for each day, and writes the entire record, including the index, into a file ready for the analysis programs. Apart from allowing freedom in the choice of dates, the program permits any combination of avalanche sites (or ranges of sites), avalanche types (artificial or natural), sizes, and moisture contents to be specified as criteria for including any one avalanche as part of the activity index.
Identijication of dates
Starting and finishing dates were defined as those for the first and last avalanches of each of the eight avalanche seasons, 1965-73. Bois and others ([1g75]) and Fohn and others (1977) grouped their data on a monthly basis, "for example, all Januarys in the 10 year sampling
period are taken as the total population for that month" (Bois and others, [1975], p. 394). This procedure was adopted to eliminate the seasonal trend but assumes that similar condi- tions occur during the same month each year on a regular basis. Some winters may be more advanced. than others, however, on a particular date each year. Bovis (1974, 1976, 1977) partitioned avalanche seasons into dry and wet avalanche periods but recognized that transition dates were hard to identify (Bovis, 1977, p. 95). Dry avalanches are not confined to the first, nor wet avalanches to the second, part of the winter. In this study, winters were
520 J O U R N A L O F G L A C I O L O G Y
divided into a first period, during which avalanching is primarily precipitation dependent, and a second period during which it is primarily temperature dependent. Extreme tempera- ture dependence is manifested in the spring avalanche cycles. Identification of optimum transition dates was achieved by visual inspection of the data patterns, combined with an incremental correlation-analysis procedure designed for this purpose. Correlation coefficients are computed between avalanche activity and certain meteorological variables, such as snow- fall, after each sequential data record has been read and added to the work file. Thus, values of the correlation coefficient can be monitored as analysis of data for a winter progresses and the best "cut-off" date is selected for the earlier period. I t was observed that for most winters such correlation coefficient values rise to a peak near the end of January or beginning of February, then drop off sharply as snow-fall becomes less significant than temperature. Periods identified as primarily precipitation dependent for the eight seasons were selected for subsequent analysis and use as the basis for development of the time-series models described in this paper. The primarily temperature-dependent periods will require a separate study. "Best" avalanche-activity weighting schemes
The three best avalanche-activity weighting schemes were found to be schemes (111), (11), and (IV), Table I, in that order, indicating that terminus is a better measure than size and that exclusion of small avalanches would not reduce the correlations significantly. Varying the moisture content codes did not result in any further improvements. I t should be noted that in scheme (111) terminus alone determines the value of the index, and that scheme (IV) implies equal weighting for all classifications, omitting small avalanches and is therefore simply a frequency count of medium and large avalanches.
"Best" meteorological variables
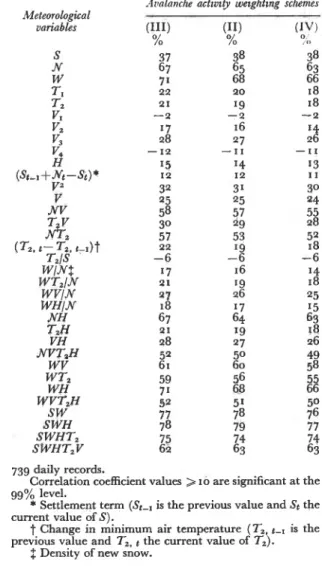
A composite meteorological variable, SWH (the product of snow-pack depth, precipita- tion, and relative humidity), was found to be the variable most highly correlated with avalanche activity. The relative significance of all the other meteorological variables is shown in Table 111, in which correlation coefficient values, expressed as percentages, have been computed using Rogers Pass meteorological data on a daily basis for the first periods of the eight winters from 1965 to 1973, and the three "best" avalanche-activity weighting schemes. Several possible reasons can be given for the importance of precipitation, snow-pack depth, and relative humidity in the SWH term.
Precipitation, the "best" of the simple meteorological variables, is better correlated with avalanche activity than is new-snow depth alone, probably because it is a more direct measure of slope loading or the magnitude of shear stress imposed by the loading. The rate of increase of shear stress in relation to the rate at which snow gains strength through sintering and compaction undoubtedly determines the short-term potential for avalanching.
Tests of relative significance may be performed assuming approximate normality. Correla- tion coefficient values for S W compared with W alone (Table 111) indicate a highly significant improvement at the 0.999 level, as described by Hotelling's t-test (Freeze, 1964, p. 108). This could not be due merely to the establishment of the minimum snow-pack depth required for avalanches to start (about 70 cm for the Rogers Pass area). This depth had already been established on or near the starting dates used in the analyses. The importance of depth of snow-pack as a major factor modifying precipitation is undoubtedly the result of the greater participation of the deepening snow-pack in avalanching.
Correlation coefficient values for S WH also demonstrate a statistically significant improve- ment over those for SW, although the effect does not appear to be great.
Wind is undoubtedly important in redistributing snow and loading lee slopes, but its effect on large-scale avalanching, as opposed to sloughing, is probably somewhat non-linear,
T I M E - S E R I E S M O D E L L I N G O F A V A L A N C H E A C T I V J T Y
TABLE 111. CORRELATION COEFFICIENTS: ROGERS PASS
METEOROLOGICAL DATA 1965-73 DAILY OBSERVATIONS,
FIRST PART OF WINTER, ALI. SITES, ARTIFICIAL AND NATURAL AVALANCHES
Ar~alanche activity weighting schemes Meteorological variables (111) (11)
(Iv)
% % i ( 8 WVTzH SW SWH SWHTz S W H T 2 V 739 daily records.Correlation coefficient values
>
10 are significant at the99% level.
*
Settlement term (St-, is the previous value and St the current value of S ) .t
Change in minimum air temperature (T2, t-, is the previous value and Tz, t the current value of T z ) .$ Density of new snow.
diminishing with increasing wind speed above a critical level (Seligman, 1936, p. 159-85; Mellor, 1968, p. 151 ; U.S. Dept. of Agriculture, 1961, p. 35; Perla and Martinelli, 1976, p. 35). This would explain the low linear correlation coefficients between wind terms and avalanche activity obtained in this study (Table 111). A separate study will be required to evaluate the complex influence of wind on avalanching at Rogers ?ass.
A versatile system was designed and programmed for the development of optimum transfer-function stochastic noise models. The main instrument in these procedures is a computer program written specifically for this study and incorporating the features required to perform the following steps.
522 J O U R N A L O F G L A C I O L O G Y
( I ) Sample autocorrelation functions, r,,(k) and r,,(k) for the input series x and the output series y, are computed up to 2 0 lags (K = 20) using the following equations,
where
and
t = r
Sample cross-correlation functions rxy(k) are also computed from where
M is the number of observations in the sequence, c,,(o) and cy,(o) are sample variances, and c,,(k), c,,(k), and c,,(k) are sample co-variances. These correlation functions are examined for "stationarity". A "stationary" process is said to be strictly stationary if its properties are unaffected by a change of time origin.
Deviations from the series means were used throughout the model development for computational convenience, i.e.
If the stochastic time series exhibits "non-stationary" behaviour, usually indicated by a slow and linear tapering of the auto- or cross-correlation functions, it may be necessary to apply some degree of differencing to the data. "We assume that a degree of differencing d necessary to induce stationarity has been achieved when the estimated auto- and cross- correlations rXx(k), ryy(k), and rzy(k) of xt = VdXt, and yt = VdYt damp out quickly. In practice, d is usually o, I or 2" (Box and Jenkins, 1970, p. 378). For avalanche activity and for most of the composite meteorological series the correlation functions decayed to insignifi- cance rapidly (at or before the third lag). Differencing was therefore unnecessary.
(2) Partial autocorrelation functions (defined as the last autoregression coefficient obtained
after successively fitting increasing orders of autoregressive process to the data) are computed for the input series up to twenty lags. Suitable autoregressive moving average (ARMA) (@, q) models are identified from the autocorrelation and partial autocorrelation functions and the parameters estimated using a least-squares approach. These models are of the form,
+x(B) xt = &(B) at, where B is the backward-shift operator defined by and
T I M E - S E R I E S M O D E L L I N G O F A V A L A N C H E A C T I V I T Y
Similarly,
+,,
&,
...,
&,
are autoregressive coefficients, xt is the input series, 8,, 8,,..
.,
eq,
are moving-average coefficients, and at is a white-noise process (Box and Jenkins, 1970, p. 9-10). (3) The ARMA model describing the first (primary) input series is used to transform it into an approximate white-noise process (random and uncorrelated), and the same trans- formation is applied to the output series. That is,
Pre-whitening of the input series produces more efficient estimates of the transfer function (Box and Jenkins, 1970, P. 379).
(4) Assuming the model
yt = v(B) xt+nt, the transfer function
v(B) = (v,+v1B+v,B2+ ...) of the process described by
pt = v(B) m t + ~ t , where ~t is the transformed stochastic noise series
~t = +x(B) ox-I(B) nt,
may then be identified and least-squares estimates of the parameters obtained using an all- ;combination approach up to five lags. The model, based on a single input series, may now
be written,
where D(B) is the estimated deterministic transfer function and nt is the stochastic noise. xt and nt are assumed to be independent.
(5) If a secondary input series is contemplated, it may be selected by calculating partial correlation coefficients between (yt-O(B) x,, t) and the residuals of x,, t after regressing x,, t on all of x,, t contained in D(B) x,, t. x,, t is the primary input series and x,, t is each of the proposed secondary input series. The highest partial correlation coefficient indicates the best choice for the secondary series. Steps (3) and (4) are then repeated, using x,, t as the new input series and (yt-D(B) x,, ,) as the new output series. The model may now be written,
yt-D(B) X I , t = Q(B) x ~ , t+nt,
where Q(B) is the estimated transfer function for the secondary input series. The process may be repeated for several secondary series.
(6) Finally, the complete transfer-function component is subtracted from the output series to obtain the stochastic-noise component, that is,
nt =yt-OW XI, t, for one input series, or
nt =yt-O(B) XI, t-G(B) x,, t,
for two input series, etc.
(7) Autocorrelation and partial autocorrelation functions for the stochastic-noise process are computed up to twenty lags and a suitable ARMA model describing the process identified and estimated,
5Q4 J O U R N A L O F G L A C I O L O G Y
(8) The transfer-function and stochastic-noise components are then combined, yt = P(B) xt++,-I(B) &(B) at,
and efficient least-squares estimates of the parameters obtained. Any insignificant terms are eliminated and the final, complete model re-estimated.
(9) In this last step, tests of model adequacy are performed as described by Box and Jenkins ( I 970, p. 392-95). Among other things, insignificant autocorrelation in the residuals
is confirmed.
Several sets of models have been developed for Rogers Pass using the foregoing procedures (Salway, unpublished). Presented here is an optimum time-series model based on the "best" weighting scheme ((111), Table I) for the total period 1965-73. Daily observations were used and all types of avalanche; slab and loose, dry, damp, and wet, were included. Artillery releases were combined with natural avalanches because these account for a significant portion, tip to 40% per year, of the total avalanching at Rogers Pass. Artificial occurrences probably result from snow-pack instabilities in the same way as do natural occurrences.
The complete model obtained, after performing the previously outlined steps ( I ) to (g), was
f t = 0.0g5Tt-, +0.060T~-~+o.ooo 685SWHt-0.000 og@WHt-,+
+o.131 WTz, t-0.035 WT2, t-Z. Tt-, and Yt-, are the first and second lags, respectively, of avalanche activity Ti. SWHt is the primary input series (SWHt-,, the first lag) and WT2, t is the secondary input series
( WT,, t-,,, the second lag). The model has an R-value (multiple-correlation coefficient) of
0.81 and a standard error of estimate of 61.3 compared to a standard deviation for the avalanche data of 103.3.
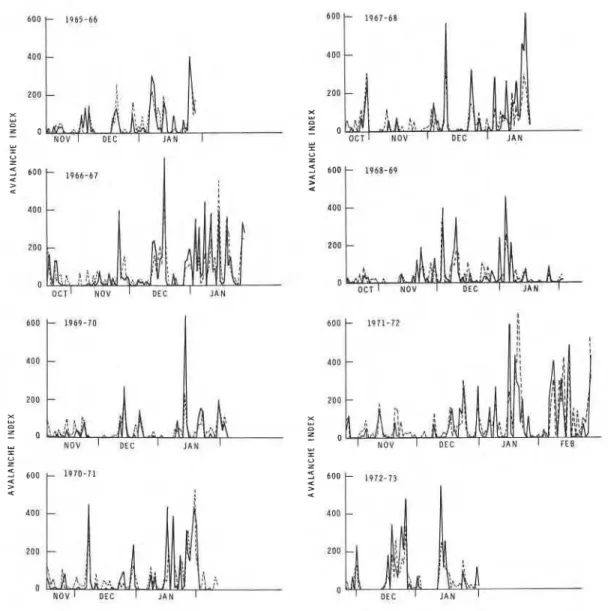
Figure 2 shows predicted values obtained with this model, plotted along with actual values of the avalanche activity index for the entire period 1965-73. Good agreement is demons- trated. The model can be used to predict avalanche activity for any winter that resembles the class of eight, defined by the period 1965-73.
Comparison with discriminant analysis
I t is difficult to make a direct comparison of time-series predictions with results obtained using a discriminant-analysis approach. In the first case, avalanche activity is treated as a quasi-continuous variable whereas in the second case a probabilistic assignment of Avalanche and non-avalanche days is made. Some idea of the relative power of the two methods is however desirable in view of work done by others using discriminant methods. Simulated discriminant results can be obtained from the time-series curves (Fig. 2) by choosing an
appropriate level of avalanche activity for discrimination and defining successes as those predictions which fall on the same side of a level as actual values. Any day on which at least one avalanche of medium size occurs on any one avalanche site could be selected as the criterion for discrimination. Examination of the 1965-73 data set indicates that this criterion corresponds to an average avalanche-activity level of 30 for weighting scheme (111) (Table I). Two or three small avalanches usually occur with a medium avalanche on a particular day. Applying this criterion to the actual and predicted time-series curves for 1965-73 (Fig. 2) provides a measure of the performance of the time-series model in a simulated discriminant situation. 197 out of 237 avalanche days were correctly classified and 397 out of 524 non- avalanche days were correct. The misclassification percentages were therefore I 7% for
avalanche days, 24% for non-avalanche days and 2 2 % overall. If an avalanche activity level of IOO is chosen, instead of 30, as the discriminant criterion, 94 out of 128 avalanche days and
595 out of 633 non-avalanche days are correctly assigned. These figures correspond to mis- classification percentages of 27% for avalanche days, 6% for non-avalanche days, and 9%
T I M E - S E R I E S M O D E L L I N G O F A V A L A N C H E A C T I V I T Y
1
Fig. 2. Avalanthe activity prediction profiles for 1965-73 (- actual values, - - - -predicted values) based on t h single
model
ft = o . o g ~ ~ t - r + o . 0 6 0 ~ t ~ 2 + o . o o o 685SWHt-0.000 O ~ ~ S W H ~ _ ~ + O . I ~ I WTz, t-o.035WT2, t-=.
overall. Bovis (1977) stratified avalanche activity into four levels for discrimination but Bois and others ([1975]) used only one. Any number of stratifications, or criteria for discrimina- tion, may be applied to Figure 2. The misclassification percentages obtained can be favour-
ably compared with those of Bois and others (1975) and Bovis (1977). Simulated forecasts
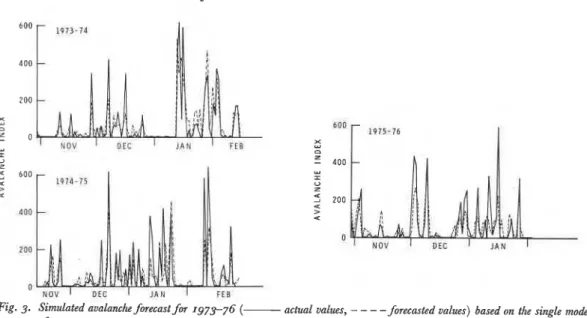
Simulated forecasts were obtained by applying the model developed from 1965-73 data to three recent winters 1973-76. Results are shown in Figure 3 where it is clear that simulated forecasts closely match actual values of the avalanche index. The R-value has dropped only
526 T O U R N A L O F G L A C I O L O G Y
Fig. 3. Simulated avalanche forecast for 1973-76 (- actual values, - -
-
-forecasted values) based on the single model pt = 0 . o g 5 Y ~ - ~ +0.0602;~,+o.ooo 685SWHt-0.000 O ~ ~ S W H ~ _ ~ + O . I ~ I W T 2 , t-0.035 WT,, 1-,.slightly to 0.80 compared with 0.81 for 1965-73. I n a simulated discriminant situation as defined previously, using an avalanche activity level of 30 for discrimination, these 1973-76 forecasts yield the following results. 91 out of 102 avalanche days and 166 out of 212 non- avalanche days are correctly assigned. Misclassification percentages are therefore I I
%
foravalanche days, 2 2
%
for non-avalanche days, and I 8% overall. Using an activity level of loofor discrimination, 43 out of 56 avalanche days and 238 out of 258 non-avalanche days are correct giving misclassification percentages of 23% for avalanche days, 8% for non-avalanche days, and I I
%
overall. This analysis indicates that the model works well when applied towinters not included in the adjustment sample from which the model was developed.
I t has been shown that a stochastic transfer-function time-series approach may be a useful alternative to discriminant analysis procedures for forecasting avalanches.
Accordingly, a numerical scheme was devised for representing avalanche activity in the Rogers Pass area of British Columbia in terms of size, terminus, and moisture content codes for each avalanche event. Avalanche activity indices have been computed for the entire area on a daily basis and treated as the dependent variable in various types of correlation analysis designed to establish optimum weights for size, terminus, and moisture content codes, appro- priate starting, finishing, and transition dates for avalanche activity periods, and the most suitable meteorological variables to be used in the subsequent development of time-series models. A composite term, SWH (the product of snow-pack depth, precipitation, and relative humidity), was selected as the "best" meteorological variable since it had the highest linear correlation with avalanche activity for the period 1965-73. Highly temperature-dependent early and late-spring avalanching was excluded. After a summary of the theory of time-series model development, a model was presented involving SWHt as the primary input series, and
WT,, t (the product of precipitation and minimum air temperature) as a secondary input
series. Lagged values of previous avalanche activity Yt-, and Yt-, also appear in the model. The importance of such terms has long been recognized by field analysts who make operational hazard evaluations and forecasts at Rogers Pass. "The results of the avalanche patrol are used
T I M E - S E R I E S M O D E L L I N G O F A V A L A N C H E A C T I V I T Y
5*7
to verify the avalanche-hazard evaluation and to help with the avalanche hazard forecast" (Schleiss and Schleiss, I 970, p: I 2 I). Perla and Martinelli ( I 976, p. 95) list "current and past
avalanches" as the second basic input for stability evaluation and state that "The most precise stability evaluation for a slope must be based on knowledge of recent avalancht activity on nearby slopes". Predicted values obtained with this model are in excellent agreement with actual values of the avalanche activity index for the period 1965-73. The model performed well when applied to three winters 1973-76 in a simulated forecasting situation. A simulated discriminant analysis yielded low misclassification percentages for both the adjustment sample
1965-73 and the simulated forecasting sample 1973-76.
Such models can be improved, not only as further data become available but also when more frequent measurements are made, particularly during storm periods. Avalanche events should be recorded as precisely as possible, for such records are undoubtedly the most impor- tant limiting factor in the development of accurate models.
ACKNOWLEDGEMENTS
The avalanche activity and meteorological data that form the basis of these studies were made available by kind permission of Parks Canada. Special thanks are due to L. W. Gold and E. Penner for their critical review of the manuscript and to P. Schaerer for his many valuable comments and suggestions.
This paper is a contribution from the Division of Building Research, National Research Council of Canada, and is published with the approval of the Director of the Division.
MS. received 6 January
1978
and in revised form 26 January1979
R E F E R E N C E S
Bois, P., and others. [1g75.] Multivariate data analysis as a tool for day-by-day avalanche forecast, [by] P. Bois, C. Obled, and W. Good. [Union Gbdisique et G6ophysique Interntionale. Association Internationale des Sciences
Hydrologiques. Commission des Neiges et Glaces.] Symposium. Micanique de la neige. Actes du colloque de Grindelwald, avril 1974, p. 391-403. (IAHS-AISH Publication No. I 14.)
Bovis, M. J. 1974. Statistical analysis. (In Armstrong, R. L., and others. Development of methodology for evaluation and prediction of avalanche hazard in the San Juan mountain area of southwestern Colorado, [by] R. L. Armstrong, E. R. LaChapelle, M. J. Bovis, J. D. Ives. University of Colorado. Institute of Arctic and
Alpine Research. Occasional Paper No. 13, p. 7 1-94.)
Bovis, M. J. 1976. Statistical analysis. (In Armstrong, R. L., and Ives, J. D., ed. Avalanche release and snow characteristics, San Juan Mountains, Colorado. University of Colorado. Institute of Arctic and Alpine Research.
Occasional Paper No. 19, p. 83-130.).
Bovis, M. J. 1977. Statistical forecasttng of snow avalanches, San Juan Mountains, southern Colorado, U.S.A.
Journal of Glaciology, Vol. 18, No. 78, p. 87-99.
Box, G. E. P., and Jenkins, G. M. 1970. Time series analysis, forecasting and control. San Francisco, Holden-Day. Draper, N. R., and Smith, H. 1966. Applied regression analysis. New York, John Wiley and Sons, Inc.
Fohn, P., and others. 1977. Evaluation and comparison of statistical and conventional methods of forecasting avalanche hazard, by P. Fohn, W. Good, P. Bois, and C. Obled. Journal of Glaciology, Vol. 19, NO. 81, p. 375-87. Freese, F. 1964. Linear regression methods for forest research. U.S. Dept. of Agriculture. Forest Service. Research
Paper FPL I 7.
Judson, A., and Erickson, B. J. 1973 Predicting avalanche intensity from weather data: a statistical analysis.
U.S. Dept. of Agriculture. Forest Service. Research Paper RM- r 12.
LaChapelle, E. R. 1970. Principles of avalanche forecasting. Canada. National Research Council. Associate Committee
on Geotechnical Research. Technical Memorandum No. 98, p. 106-13.
Mellor, M. I 968. Avalanches. U.S. Cold Regions Research and Engineering Laboratory. Cold regions science and
engineering. Hanover, N.H., Pt. 111, Sect. A3d.
Perla, R. I., and Judson, A. 1973. Study plan fading memory analysis of avalanche contributory factors. U.S.
Dept. of Agriculture. Forest Semice. Line Project No. FS-RM 1601.
Perla, R. I., and Martinelli, M., jr. 1976. Avalanche handbook. U.S. Dept. of Agriculture. Forest Service. Agriculture
528
J O U R N A L O F G L A C I O L O G YRao, C. R. 1952. Advanced statislical methods in biometric research. New York, John Wiley and Sons, Inc. Salway, A. A. Unpublished. Statistical estima~ion and prediction of avalanche activity from meteorological data.
[Ph.D. thesis, University of British Columbia, 1976.1
Schleiss, V. G., and Schleiss, W . E . 1970. Avalanche hazard evaluation and forecast, Rogers Pass, Glacier National Park. Canada. National Research Council. Associate Committee on Geotechnical Research. Technical
Memoraedu#z No. 98, p. 1 I 5-22.
Seligman, G. 1936. Snow structure and skijields; being an account of snow and ice in forms met with in nature ahd a study on avahuhes and snowcraft. London, Macmillan and Co. Ltd.
U.S. Dept. of Agriculture. 1961. Snow avalanches: a handbook of forecasting and control tncasures. U.S. 1)ept. of Agriculture. Forest Service. Agriculture Handbook 194.