Cell Systems, Volume 11
Supplemental Information
Biophysics of Temporal Interference Stimulation
Figure S1. Resonance is necessary for effective TI stimulation, related to Figures 3-5.
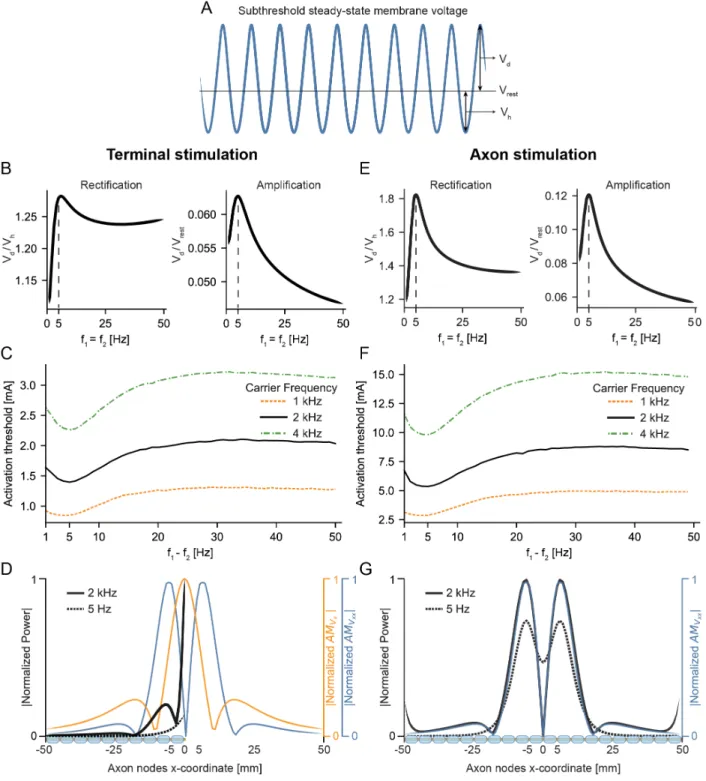
(A) We examined if the rectification properties of the axon can explain why there is a 5 Hz optimal beat frequency across all carrier frequencies that we tested. To that end, we applied a low-frequency subthreshold stimulus with a constant amplitude, but we varied its low-frequency. We defined rectification as the ratio of voltage depolarization (Vd) relative to hyperpolarization (Vh)
during a cycle of the stimulus. We also defined amplification as the ratio of depolarization voltage (Vd) to the resting potential (Vrest). The amplification can be considered as a measure of
(B) For TI stimulation near the axon terminal (Node 100 at x=0 mm), rectification (Vd / Vh) and
amplification (Vd / Vrest) for No-TI (𝑓"= 𝑓$) low-frequency stimulation applied at different frequencies. We kept the stimulus amplitude constant across all frequencies. Both rectification and amplification exhibit resonance at 5 Hz, which is equal to the optimum beat frequency (5 Hz) for TI stimulation. Therefore, TI is most effective (lowest activation threshold) where the axon shows maximum amplification and rectification.
(C) For TI stimulation near the axon terminal, minimum current (activation threshold) for beat frequencies ranging from 1-50 Hz in steps of 1 Hz, and carrier frequencies of 1, 2, and 4 kHz. We defined the activation threshold as the minimum stimulation amplitude necessary to elicit at least a single action potential during each beat and we considered ten beats in total. A beat frequency of 5 Hz shows the lowest activation threshold across all carrier frequencies.
(D) For TI stimulation near the axon terminal, spectral analysis of subthreshold voltages for nodes of Ranvier in the axon. The global maxima of normalized power for the carrier frequency (2 kHz) and the beat frequency (5 Hz) overlap with the global maximum of amplitude modulation (AM) of the electric field (Vx) along the direction of the axon at x=0 mm. There is also a local maximum of
normalized power for the carrier frequency that overlaps with one of the peaks of AM of the activating function (Vxx) along the axon near x=-7 mm. Therefore, this subthreshold power
spectrum analysis provides further evidence that the driving force for neural activity generated by TI stimulation is AM of the electric field near axon terminals.
(E) For TI stimulation near the middle of the axon (Node 50 at x=0 mm), rectification and amplification for No-TI low-frequency stimulation. We kept the stimulus amplitude constant across all frequencies. Both rectification and amplification exhibit resonance at 5 Hz, which is equal to the optimum beat frequency (5 Hz) for TI stimulation.
(F) For TI stimulation near the middle of the axon, minimum current (activation threshold) for beat frequencies ranging from 1-50 Hz in steps of 1 Hz, and carrier frequencies of 1, 2, and 4 kHz. A beat frequency of 5 Hz shows the lowest activation threshold across all carrier frequencies. (G) For TI stimulation near the middle of the axon, spectral analysis of subthreshold voltages for nodes of Ranvier in the axon. The peaks of normalized power for the carrier frequency (2 kHz) and the beat frequency (5 Hz) overlap with the peaks of AM of the activating function (Vxx) along
the axon. Therefore, this subthreshold power spectrum analysis provides further evidence that the driving force for neural activity generated by TI stimulation is AM of the activating function away from terminations.
Figure S2. Temporal analysis of axonal activity by TI stimulation, related to Figure 3.
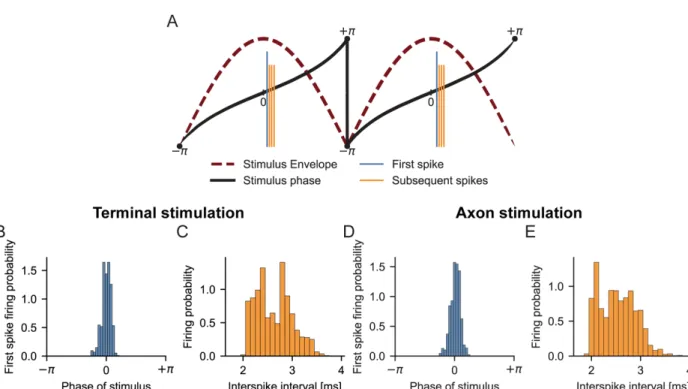
(A) We used a Hilbert transform to calculate the instantaneous phase of the stimulus envelope and recorded the phase of the stimulus when an action potential was initiated. It is important to note that the phase of the stimulus does not change linearly between −𝜋 and +𝜋 because the envelope of the stimulus is not a pure sinusoid. The phase of the stimulus envelope is zero when the envelope is at its maximum. Hence, if action potentials were the result of TI, the action potentials should be generated near zero phase. Because the first action potential is mostly influenced by the TI stimulus itself while the subsequent action potentials are also affected by the prior action potentials, we distinguished the first action potential from the subsequent action potentials generated during an individual cycle.
(B) For TI stimulation near the axon terminal (Node 100 at x=0 mm), firing probability distribution of the first spike generated during each beat. First spikes mostly occur when the phase of the stimulus envelope is equal to zero (peak of the envelope). Hence, the first action potentials are generated when the envelope of the stimulus is near its maximum. We expected variability in the phase of the first action potential for each stimulus cycle because the axon contained ion channels with large time constants (persistent sodium and slow potassium channels) that affect action potential generation in subsequent cycles. The histograms show the collective results for beat frequencies of 1-50 Hz, and carrier frequencies of 1, 2, and 4 kHz.
(C) For TI stimulation near the axon terminal, distribution of interspike intervals during each beat. All subsequent action potentials are generated within approximately 2-4 ms after the first action potential is elicited. The variability in interspike intervals also suggests that TI stimulation provides asynchronous, yet controllable, neural recruitment.
(D) For TI stimulation near the middle of the axon (Node 50 at x=0 mm), firing probability distribution of the first spike generated during each beat. First spikes mostly occur when the phase of the stimulus envelope is equal to zero (peak of the envelope). The histograms show the collective results for beat frequencies of 1-50 Hz, and carrier frequencies of 1, 2, and 4 kHz. (E) For TI stimulation near the middle of the axon, distribution of interspike intervals during each beat. All subsequent action potentials are generated within approximately 2-4 ms after the first action potential is elicited.
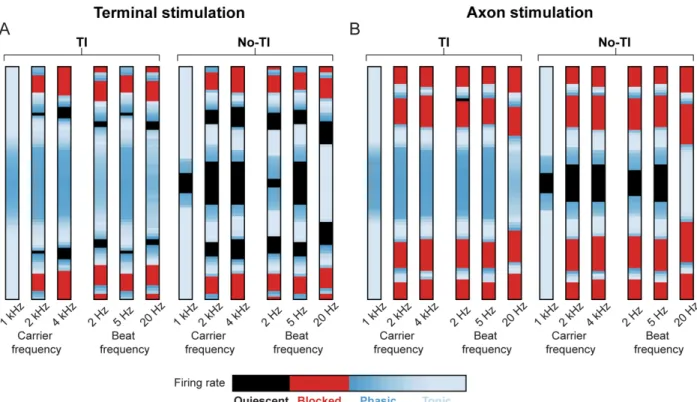
Figure S3. “Sandwich” response as a function of carrier and beat frequencies, related to Figure 6.
We investigated the spatial response to TI stimulation for carrier frequencies of 1, 2, and 4 kHz (beat frequency of 5 Hz) and for beat frequencies of 2, 5, and 20 Hz (carrier frequency of 2 kHz). We studied the response of axons that were placed from -4.0 to +4.0 mm away from the midline in increments of 0.1 mm. The bar plots represent the steady-state firing behavior of the axons as a function of distance from the midline. In these bar plots, we classified axon firing rates into the following response classes: quiescent, blocked, phasic, or tonic.
(A) Results for stimulation near the axon terminal (Node 100 at x=0 mm). For carrier frequencies, the stimulation currents were 0.8, 1.4, and 2.3 mA for carrier frequencies of 1, 2, and 4 kHz, respectively. For beat frequencies, the stimulation currents were 1.5, 1.4, and 2.0 mA for beat frequencies of 2, 5, and 20 Hz, respectively. These amplitudes were equal to the activation threshold for the axon located at the midline for the respective frequencies (Figure S1C).
(Left column) Axonal activity regimes for TI stimulation.
(Right column) Axonal activity regimes for No-TI (beat frequency of 0 Hz) stimulation.
(B) Results for stimulation near the middle of the axon (Node 50 at x=0 mm). For carrier frequencies, the stimulation currents were 2.9, 5.4, and 9.8 mA for carrier frequencies of 1, 2, and 4 kHz, respectively. For beat frequencies, the stimulation currents were 5.8, 5.4, and 8.2 mA for beat frequencies of 2, 5, and 20 Hz, respectively. These amplitudes were equal to the activation threshold for the axon located at the midline for the respective frequencies (Figure S1F).
(Left column) Axonal activity regimes for TI stimulation.
Figure S4. Axonal response regimes to TI and No-TI stimulation are robust to parameter changes, related to Figure 6.
We changed the forward and backward rates of gating variables to decrease or increase the time constants of the ion channels. We changed the forward and backward rates of the channel states equally so that the time constants were altered by ±25% and ±50% while the steady-state activation profiles remain unchanged (see STAR Methods). We performed this analysis for both TI (𝑓" = 2005 𝐻𝑧, 𝑓$= 2000 Hz) and the No-TI (𝑓"= 𝑓$= 2000 Hz) control. We also performed this analysis for stimulation near the axon terminal and near the middle of the axon. The bar plots represent the steady-state firing behavior of the axons as a function of distance from the midline. In these bar plots, we classified axon firing rates into the following response classes: quiescent, blocked, phasic, or tonic.
(A) Response regimes to TI stimulation near the axon terminal (Node 100 at x=0 mm). (B) Response regimes to No-TI stimulation near the axon terminal.
(C) Response regimes to TI stimulation near the middle of the axon (Node 50 at x=0 mm). (D) Response regimes to No-TI stimulation near the middle of the axon.
Figure S5. “Sandwich” response as a function fiber diameter, related to Figure 6.
We investigated the spatial response to TI stimulation for fiber diameters of 2.0, 3.0, 5.7, 8.7, 11.0, and 16 µm. We used a carrier frequency of 2 kHz and a beat frequency of 5 Hz for all of the simulations. We studied the response of axons that were placed -4.0 to +4.0 mm away from the midline in increments of 0.1 mm. The bar plots represent the steady-state firing behavior of the axons as a function of distance from the midline. In these bar plots, we classified axon firing rates into the following response classes: quiescent, blocked, phasic, or tonic.
(A) Results for stimulation near the axon terminal (Node 100 at x=0 mm). The stimulation currents were 6.7, 3.0, 2.4, 1.4, 1.1, and 0.9 mA for fiber diameters of 2.0, 3.0, 5.7, 8.7, 11.0, and 16 µm, respectively. These amplitudes were equal to the activation threshold for the axon located at the midline for the respective frequencies.
(Left column) Axonal activity regimes for TI stimulation.
(Right column) Axonal activity regimes for No-TI (beat frequency of 0 Hz) stimulation.
(B) Results for stimulation near the middle of the axon (Node 50 at x=0 mm). The stimulation currents were 108.5, 33.0, 15.3, 5.4, 3.3, and 1.9 mA for fiber diameters of 2.0, 3.0, 5.7, 8.7, 11.0, and 16 µm, respectively. These amplitudes were equal to the activation threshold for the axon located at the midline for the respective frequencies.
(Left column) Axonal activity regimes for TI stimulation.
(Right column) Axonal activity regimes for No-TI (beat frequency of 0 Hz) stimulation.
Axon stimulation Terminal stimulation
Quiescent Blocked Phasic Tonic
Firing rate TI No-TI TI No-TI A B 2 m 3 m5.7 m8.7 m 11.5 m 16 m 2 m 3 m5.7 m8.7 m 11.5 m 16 m 2 m 3 m5.7 m8.7 m 11.5 m 16 m 2 m 3 m5.7 m8.7 m 11.5 m 16 m Fiber diameter Fiber diameter Fiber diameter Fiber diameter