IdEP Economic Papers
2020 / 03
B. Lerch
Robots and nonparticipation in the US: where have all the workers
gone?
Robots and Nonparticipation in the US:
Where Have All the Workers Gone?
∗
Benjamin Lerch
Università della Svizzera italiana
November 2020
Abstract
I analyze the impact of one of the leading automation technologies of the last decades – industrial
robots – on the declining labor force participation in the US. Exploiting exogenous variation
in the adoption of robots across local labor markets and over time, I find that, on average,
one additional robot drives two workers out of the labor force. The massive increase in robot
adoption between the mid-1990s and 2014 explains about 15 percent of the decline in labor force
participation in these years. I next investigate the channels through which automation affects
nonparticipation and find that robot adoption leads to rising university enrollment rates among
the young, early retirement of older workers and a considerable fraction of middle-aged workers
enrolling in disability insurance.
Keywords: industrial robots, labor force participation, education, disability, early retirement.
JEL Codes: I12, I26, J21, J26.
∗
I thank Daron Acemoglu and Pascual Restrepo for sharing their data with me and David Autor, Giuseppe Di
Giacomo, David Dorn, Marius Faber, Lorenz Kueng, Fabrizio Mazzonna, Giovanni Pica and the participants of
the USI Brown Bag Seminars for valuable feedback.
1
Introduction
US labor force participation has been trending down for decades. Previous studies find that during
the second half of the twentieth century and the early 2000s this trend has been fueled in part
by compositional shifts in demographics, the expansion of disability programs, trade shocks, and
cyclicality in labor market conditions.
1More recently, a growing concern about the labor market
impact of the advancements in automation technologies – which may potentially replace millions of
American jobs (
Frey and Osborne
,
2017
) – is raising the question of whether this trend is likely to
worsen further in the future.
2In this article, I investigate the labor market effect of one of the leading breakthrough technologies
of the last decades – industrial robots – on US labor force participation. Economists have recently
started to examine the impact of the massive increase in the adoption of industrial robots that
compete with human labor in the US, finding that they reduce employment and wages (
Acemoglu
and Restrepo
,
2020
). At the same time, there is growing anecdotal evidence that automation is
not only destroying, but also creating millions of new jobs.
3These jobs often require the interplay
of humans with machines and algorithms and may not be performed by those workers who are
displaced by automation due to a skill mismatch. These workers are therefore likely to become
unemployed or to leave the labor force altogether, unless they are endowed with easily redeployable
general human capital. Until now, little is known about the contribution of robot adoption to the
decline in US labor force participation and about individuals’ margins of adjustment in response to
automation.
I focus on the labor supply decision of white working-age men, the demographic group that has
experienced the largest decline in labor force participation over the last decades, using data on
local labor markets (Commuting Zones) from the US Census and the American Community
Sur-vey matched with data on the adoption of industrial robots from the International Federation of
1
See literature review below.
2Frey and Osborne
(2017) project that 47 percent of total US employment is at high risk of automation in the
next two decades, unleashing worldwide worries about the future of work. However, this projection is likely to
overestimate the negative impact of automation (Arntz et al.,
2016,
Manyika et al.,
2017) and it is not informative
about its equilibrium labor market impact (Acemoglu and Restrepo,
2020), since displaced workers may reallocate
to other industries or occupations (Autor and Dorn,
2013,
Dauth et al.,
2019).
3
For example, the World Economic Forum estimates that in the next years automation may create up to 133 million
new roles that are expected to offset declining jobs (WEF,
2018).
Robotics.
4I follow
Acemoglu and Restrepo
(
2020
) and estimate the labor market effect of robots
us-ing a shift-share approach constructed from the interaction of baseline industry employment shares
within local labor markets with the adoption of industrial robots in the US. Identification builds on
the assumption that advancements in robotics technology vary by industry and expose local labor
markets differently depending on their industrial composition of employment. However, US firms
may adopt robots in response to domestic industry-specific shocks which influence also the demand
for labor. I account for endogeneity and identify the causal effect of robot exposure on US labor
force participation using an instrumental variable strategy. I instrument the shift component using
the contemporaneous adoption of industrial robots in Europe and instrument the share component
with plausibly exogenous industry employment shares that precede the introduction of industrial
robots, which started in the 1980s.
5I find that robots decrease employment and that for every 10 workers they displace, labor force
participation declines by almost 6 individuals. I consider displaced workers as individuals that do
not find a job or lost their job directly or indirectly because of robots.
6Industrial robots are known
to replace manufacturing workers by taking over jobs or tasks previously performed by labor. As a
response, these workers may leave the labor force or move to other non-automated jobs (e.g. low-skill
service work,
Autor and Dorn
,
2013
), displacing also workers which are not directly competing with
robots. Moreover, reduced employment in the manufacturing sector may contract aggregate demand
in the local economy, decreasing also the demand for labor in non-automated sectors (
Acemoglu
and Restrepo
,
2020
). Altogether, the magnitude of my results suggests that every additional robot
drives two workers out of the labor force. In other words, the introduction of industrial robots
between 1993 and 2014 increases the number of individuals that are not participating in the labor
force by roughly 395’000 workers, which corresponds to about 15 percent of the decline in labor
force participation in these years. This result is mainly (but not exclusively) driven by individuals
4
Of course, robots may affect also the labor supply of other demographic groups, especially of women and non-white
workers that are employed in low-skill jobs of the manufacturing sector. Analyzing the impact of robots on labor
market outcomes by gender, race and ethnicity is outside of the scope of this paper and is examined in a companion
paper (Lerch,
mimeo).
5
The rapid adoption of robots in Europe may have made European firms more competitive than their US peers,
unveiling a possible causal link with the decline in US employment via international product market
competi-tion. Although I cannot fully rule out a violation of the exclusion restriction, I address this potential threat to
identification with several robustness checks.
6
The repeated cross-sectional nature of the data does not allow me to disentangle direct from indirect displacement
effects of robots, since I am tracing local labor markets rather than the career progression of individual workers.
without a college degree.
The lower labor force participation of men is of limited concern if it is compensated by the labor
force participation of a family member (
Lundberg
,
1985
). However, I find no general support for this
hypothesis among individuals who leave the labor force because of automation, raising the question
of where these individuals went and how they could afford not to work. I address these questions
by investigating heterogeneity in the labor market effect of robots by demographic characteristics
and by examining the margins of adjustment of nonparticipants in response to this shock.
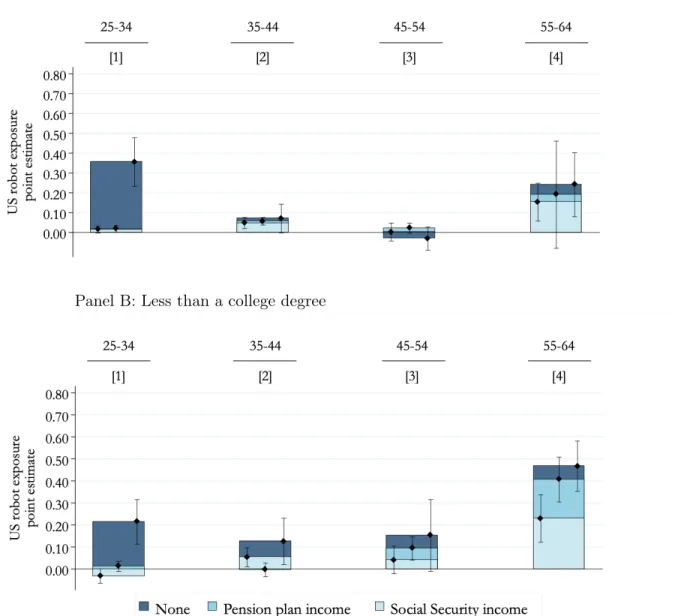
My findings show that the decline in labor force participation among young individuals comes along
with an increase in their university enrollment rates. The investment in further education is likely to
increase workers’ labor market competitiveness and to decrease the likelihood of being displaced by
robots in the future. These individuals can afford not to work temporarily because they are often not
financially independent. From the age of 35 years, a considerable fraction of the prime-age workers
that leave the labor force because of automation enrolls in Social Security Disability Insurance
(SSDI) and withdraws income from pension plans. The increase in disability take-up comes along
with robots affecting negatively nonparticipants’ self-reported physical and mental health, reduced
access to adequate healthcare services and an increase in the share of hospital admissions diagnosed
with mental disorders. These health conditions are often hard to verify and leave some margin
of error in the evaluation process of the SSDI which may be misused by displaced workers whose
real health condition does not prevent them from engaging in substantial gainful activity, but who
cannot (or do not want to) find a job in more automated labor markets. In these cases, SSDI
can be interpreted as a sort of permanent unemployment insurance.
7Finally, I find that older
workers are most likely to leave the labor force in response to the automation shock and that this
effect comes along with an increase in workers that retire prematurely by claiming Social Security
retirement benefits early or by withdrawing retirement income from pension plans. This effect is
already visible from the age of 55 years for less educated workers – when most penalties on early
withdrawals of pension plan income are waived for nonemployed individuals – and from 62 years
for college-educated workers – when they qualify for Social Security early retirement benefits.
7
This suspicion is in line with the finding of
Deshpande and Lockwood
(2020) who show that individuals with less
severe health conditions enroll in disability insurance in response to non-health related shocks and as an insurance
against future non-health risks.
This paper contributes to different strands of the literature. I predominantly relate to seminal
papers that examine the employment effects of automation in form of the adoption of industrial
robots that compete with human labor. I start by showing that – despite the reallocation of labor
across industries and occupations that is documented in the literature (
Autor and Dorn
,
2013
,
Autor
and Salomons
,
2018
,
Graetz and Michaels
,
2018
,
Dauth et al.
,
2019
,
Jaimovich et al.
,
2020
) – robots
reduce overall employment (
Acemoglu and Restrepo
,
2020
) and they contribute to the decline in US
labor force participation of the last decades.
8I then relate to three literature streams that study
the margins of adjustment of individuals that left the labor force because of adverse shocks.
First, I contribute to the literature that identifies a downward trend in labor force participation of
the young population as college enrollment increases (
Juhn and Potter
,
2006
,
Krueger
,
2017
) and
show that this trend has been fueled by the massive increase in robot adoption. This result is in line
with the empirical work that finds that college graduates adjust the timing of their labor market
entry according to labor market conditions (
Card and Lemieux
,
2001
,
Kahn
,
2010
,
Oreopoulos et
al.
,
2012
,
Altonji et al.
,
2016
,
Foote and Grosz
,
2019
). To the best of my knowledge, no study has
analyzed the effects of automation on schooling in the US.
9Second, I relate to papers that find that negative labor demand shocks and poor labor market
conditions increase disability take-up (
Black et al.
,
2002
,
Autor et al.
,
2013
,
Maestas et al.
,
2015
). In
the last decades, an increasing fraction of disability claims is related to hard-to-verify impairments
(
Autor and Duggan
,
2003
,
Liebman
,
2015
), suggesting that SSDI may be misused as a sort of
permanent unemployment insurance (
Ford
,
2015
, p.43). However, other empirical work argues that
poor labor market conditions may also have a direct impact on workers’ health (
Hollingsworth et
al.
,
2017
) and that poor health is one of the main reasons for individuals not to participate in
the labor force (
Parsons
,
1980a
,
b
,
Krueger
,
2017
). Since the early 2000s, the high job insecurity
during periods of poor labor market conditions and the exposure to trade and automation shocks
8
Anelli et al.
(2019) complement these results by investigating the short-term impact of automation on labor force
participation of men, finding no effects. In contrast,
Jaimovich et al.
(2020) find that there is an increase in labor
force nonparticipation of workers who were previously employed in routine task-intensive occupations, i.e. the
workers that are most susceptible to automation.
9
In Germany,
Dauth et al.
(2019) observe a significant increase in the share of young workers with a college or
university degree, at the expense of the share of workers who completed an apprenticeship. Although this results
provides important evidence that automation in form of the adoption of industrial robots increases the level of
education among young workers, the consequences that educational choices have for labor force participation
decisions are still unclear.
led to a substantial increase in mental health problems among working-age Americans (
Pierce and
Schott
,
2018
,
Lang et al.
,
2019
,
Adda and Fawaz
,
2020
,
Gihleb et al.
,
2020
), with the strongest
deterioration in health conditions among white males (
Case and Deaton
,
2015
,
2017
).
10,11This, in
turn, may partially justify the increase in disability rolls observed during difficult economic times.
I contribute to this literature by examining the impact of robots on individuals’ health conditions
and the enrollment in disability insurance related to the decline in labor force participation.
Third, I complement the literature which shows that unobserved technological progress – measured
as total factor productivity – increases the share of premature labor force exits of the older
pop-ulation (
Bartel and Sicherman
,
1993
,
Peracchi and Welch
,
1994
,
Burlon and Vilalta-Bufí
,
2016
),
with a considerable share of the displaced workers filing for disability insurance (
Ahituv and Zeira
,
2011
).
12This result follows from the fact that training programs for workers close to retirement are
often costly and yield little gains, as the career horizon in which they can make use of the acquired
skills is relatively short and their cognitive ability to keep up with technological progress declines
with age (
Mazzonna and Peracchi
,
2012
). In case they are displaced, most of these workers opt for
early retirement and permanently leave the labor force. In line with this literature, I show that the
adoption of robots has a strong impact on the early retirement decision of older workers.
The paper is structured as follows. Section
2
describes the data and presents some descriptive
statistics on the adoption of robots and labor force participation trends in the US. Section
3
presents
the empirical strategy and the challenges to identification. Section
4
reports the main results on
the labor market effect of robots on labor force nonparticipation and performs a set of robustness
checks. Section
5
investigates the effect’s heterogeneity by demographic characteristics and examines
different margins of adjustment of nonparticipants in response to automation. Section
6
concludes.
10
These papers mostly use data from 1990 onward and find that poor labor market conditions and job loss have a
negative impact on people’s mental health conditions (Eliason and Storrie,
2009,
Sullivan and Von Wachter,
2009,
Browning and Heinesen,
2012). In contrast, using US health data from the 1970s to the 1990s, seminal papers
argue that the relationship between health problems and recessions is mostly countercyclical (Ruhm,
2000,
2003,
Miller et al.,
2009). These findings are interpreted as resulting from rising opportunity cost of time and less leisure
time during economic upturns.
11
Gihleb et al.
(2020) find also that robot adoption reduces work-related injuries in the manufacturing sector,
sug-gesting that automation has a beneficial effect on the physical health condition of workers that have not been
displaced.
12
This result reflects the strategy of early retirees to maximize their lifetime retirement income. In fact, disability
benefits are equal to full retirement benefits, independently of the age at application and conditionally on the
disability having started before retirement. When the full retirement age is reached, disability benefits are converted
into full retirement benefits, which are larger than early retirement benefits.
2
Data
In this section, I present the main data sources that I use to construct measures of a local labor
market’s exposure to robots, employment, unemployment, nonparticipation and health outcomes.
The data description is complemented by some descriptive statistics and details about the sample
selection.
2.1
Industrial robots
I use robotics data from the International Federation of Robotics (IFR). The IFR is a survey that
collects data about shipments and operational stocks of industrial robots by country, industry and
year ranging back to 1993 for 50 countries. The IFR defines an industrial robot as an ‘automatically
controlled, reprogrammable, multipurpose manipulator, programmable in three or more axes, which
can be either fixed in place or mobile for use in industrial automation applications’ (
IFR
,
2018
, p.29).
That is, industrial robots are machines that can be programmed to autonomously perform several
manual tasks (e.g. assembly, material handling, packing and welding) without the intervention of
a human worker. They do not include conveyor belts, cranes or elevators, since these machines do
not meet the above requirements.
The IFR breaks down the stock of operational robots according to the International Standard
In-dustrial Classification (ISIC) Rev. 2-4 and provides consistent data for six broad industries outside
the manufacturing sector (agriculture, forestry and fishing; construction; education, research and
development; mining; utilities; and other non-manufacturing branches (e.g. services)) and 13
indus-tries within the manufacturing sector (automotive; basic metals; electronics; food and beverages;
industrial machinery; metal products; minerals; paper and printing; plastics and chemicals; textiles;
wood and furniture; other transport equipment (e.g. airplanes, locomotives and ships); and other
manufacturing branches). However, these data have a few limitations. First, the stock of robots
by industry going back to the 1990s is only available for a subset of countries: Denmark, Finland,
France, Germany, Italy, Norway, Spain, Sweden, and the United Kingdom. Second, a fraction of
the stock of industrial robots is not attributed to any industry and is referred to as ‘unclassified’.
Following
Acemoglu and Restrepo
(
2020
), I attribute unclassified robots proportionally to each
on the operational stock of robots only for North America as a whole, which includes the United
States, Canada and Mexico. This aggregation introduces noise, but is not a major concern for the
identification of US robot adoption, since the Unites States account for more than 90 percent of the
North American market and the instrumental variable (IV) strategy presented in Section
3
purges
this type of measurement error. Fourth, the IFR provides data on the total stock of robots in North
America from 1993 on, but it does not provide industry breakdowns until 2004. For these years,
I attribute the aggregate number of robots to industries proportionally to their shares of the total
stock in 2004.
132.2
Labor market outcomes
I measure long-term changes in local labor market outcomes contemporaneous to the introduction
of industrial robots using data drawn from the Integrated Public Use Microdata Series (IPUMS) of
the decennial census for 1970, 1980, 1990 and 2000, and the American Community Survey (ACS)
for 2007 and 2014 (
Ruggles et al.
,
2019
).
14These datasets are repeated cross-sectional surveys that
include between 1 and 5 percent of the US population depending on the year. They provide a rich
set of information on each sampled individual, such as sex, race, ethnicity, age, employment status,
industry, school enrollment, educational attainment, Social Security income, pension plan income,
and the place of residence.
15I aggregate these data to 722 Commuting Zones (CZs) that cover
all metropolitan and rural areas of the US mainland and act as proxies of US local labor markers
(
Tolbert and Sizer
,
1996
,
Autor and Dorn
,
2013
).
16,17I focus on the labor supply decision of working-age individuals between 25 and 64 years of age,
since these workers are above the usual full-time school age and below the full retirement age.
18I
further restrict my sample to non-institutionalized non-Hispanic white men, since their labor supply
13
I use the same procedure to impute the stock of robots for Denmark, a country included in the instrument (see
Equation
3
in Section
3), for which the industry breakdown started in 1996.
14
I follow the literature and increase the sample size of the ACS 2007 and 2014 samples using data from the 3-year
sample of 2006-2008 and the 5-year sample of 2012-2016.
15
Appendix
A
briefly presents the institutional background of the US Social Security and pension plan system and
discusses shortcomings in the data from the Census and ACS.
16
CZs represent economically relevant regions for labor markets and are formed by clusters of counties with strong
commuting ties within CZs and weak commuting ties across CZs.
17
The IPUMS provide county groups or Public Use Microdata Areas as lowest geographic units. I aggregate data at
the CZ level using a crosswalk that provides a probabilistic matching of sub-state geographic units in US Census
Public Use Files to CZs from
Dorn’s website.
18
In the US, the usual high school age goes from 14 to 18 years, while undergraduate college starts at 19 years until
22 to 23 years. The full retirement age starts at 66 or 67 years, depending on the year of birth.
decisions are least sensitive to external factors such as childbearing or discrimination and they have
experienced the largest decline in labor force participation of the last decades (see Table
B1
).
192.3
Health outcomes
I measure health outcomes using data from the Behavioral Risk Factor Surveillance System (BRFSS)
of the Centers for Disease Control and Prevention (CDC) and the National Inpatient Sample (NIS)
of the Healthcare Cost and Utilization Project (HCUP) for 1993, 2000, 2007 and 2011.
20The BRFSS is a health-related telephone survey that collects 400’000 adult interviews each year
on health-related risk behaviors, chronic health conditions, and the use of preventive services. For
each individual, I have information on basic demographics, employment status, self-reported health,
smoking and drinking habits, body height and weight, physical activity, healthcare coverage and
the use of healthcare services. Interviewees are also asked about their physical and mental health
condition and report whether they suffered from physical illness or injuries, or from stress, depression
or problems with emotions in the 30 days prior to the interview. Similarly to the IPUMS data, I
aggregate BRFSS data at the local labor market level and have information on 634 CZs.
21,22The NIS collects information on more than seven million hospital stays each year using a 20-percent
stratified sample of discharges from US community hospitals. For each discharge, among others,
I observe patients’ basic demographics, the length of stay and information on up to 15 diagnoses
using classification codes from the International Classification of Diseases, Ninth Revision (ICD-9).
I group ICD-9 codes into six disability-related conditions (arthritis and rheumatism; back and spine
problems; circulatory system diseases; respiratory system diseases; mental disorders; and diabetes)
and 13 conditions that are not directly related to a disability (infectious and parasitic diseases;
cancer, endocrine, nutritional and metabolic diseases; nervous system diseases; digestive system
19
Table
B1
shows that the nonparticipation rate of non-white men increased by less than 10 percent and it decreased
for women. Note that this does not imply that the labor supply of these demographic groups has not been affected
by the introduction of industrial robots. I investigate the impact of robots on labor market outcomes of different
demographic groups in a companion paper (Lerch,
mimeo).
20
After 2011, the BRFSS and NIS datasets do not provide geographic indicators that allow me to identify observations
at the CZ level.
21
I use the approach explained in footnote
14
to increase the sample size of each year including data of adjacent years.
I construct representative individual weights by computing CZ gender-race-age shares from the BRFSS (NIS) and
census/ACS. Following
Adda and Fawaz
(2020), I divide the shares from the census/ACS by the corresponding
BRFSS (NIS) shares and multiply this ratio by the CZ share in the population for each sample year. The weights
reflect the proportions of individuals according to the gender-race-age cell in the census/ACS.
22
diseases; diseases of the skin and subcutaneous tissue; unclassified pain; alcohol abuse; tobacco
abuse; drug abuse; opioid abuse; injuries; suicide attempts; and accidents).
23These data include
hospital identifiers and county codes which allow me to match hospitals to CZs and to obtain
information on 2’217 hospitals in 322 CZs.
2.4
Covariates and other data
I use additional data to construct a set of covariates. First, I collect product-level data at the
six-digit Harmonized System (HS) on Chinese imports from the UN Comtrade Database and
in-dustry employment shares from the 1991 County Business Pattern (CBP) to control for potentially
confounding effects of the China trade shock on US local labor market outcomes.
24Second, I use
data on employment and output at the industry level in the US and in European countries from
the Integrated Industry-Level Production Account (KLEMS) of the Bureau of Economic Affairs
(BEA) and from the EU KLEMS database (
Jägger
,
2017
). In conjunction with data from the IFR,
I use these data to construct a shift-share measure of robot exposure at the local labor market
level (see Section
3
). Third, I construct measures of a local labor market’s demographic (share of
women, blacks, Hispanics, college-educated individuals, and the population size and age structure),
industrial (construction, education and research, manufacturing, mining, services, and utilities) and
occupational (routine, offshorability and robot-replaceability) composition from the 1990 census to
account for systematic differences across CZs which may influence both the adoption of robots and
local labor market outcomes.
2523
Obviously, each disease has the potential to cause a disability, if it leads to serious health conditions. However, I
follow the
Centers for Disease Control and Prevention
(2009) which reports ‘disability-related conditions’ as being
the most common health problems among disability insurance beneficiaries.
24
The CBP classifies industry employment according to the Standard Classification System (SIC) until 1997 and
according to the North American Industry Classification System (NAICS) afterwards. These systems are more
detailed than the industrial classification system used in the IPUMS. I use crosswalks from
Dorn’s website
to
convert SIC and NAICS manufacturing industries and six-digit HS product-level trade data to 392 four-digit SIC
industries.
I construct the import penetration measure by matching local employment shares with converted
product-level trade data on imports from China. For confidentiality reasons, county-industry observations with
few cases are reported as ranges. In reconstructing these data, I follow the approach used in
Acemoglu et al.
(2016).
Conversely, the IFR offers an industry breakdown of industrial robots using only 19 industries. In this case, it
is more appropriate to match robot data to industry employment data from the census, as these data are more
representative at the geographical level and I do not need the detailed industry codes provided in the CBP.
25
I construct a labor market’s occupational composition by routine task intensity, offshorability and replaceability
by robots following
Autor and Dorn
(2013) and
Graetz and Michaels
(2018).
2.5
Descriptive statistics
Figure
1
shows that since the late 1990s the United States are experiencing a massive rise in male
labor force nonparticipation, increasing from 10.95 percentage points in 1990 to 15.88 percentage
points in 2014 (a 45 percent increase, see Table
1
).
26During the same period, the stock of robots has
increased by about 1.5 robots per thousand workers (a fivefold or roughly 180’000 units compared to
its 1993 level) and, according to the International Federation of Robotics, it is expected to grow even
more in the future (
IFR
,
2018
, p.535–540). Table
2
shows that most robots are used in industries
of the manufacturing sector, such as the automotive, the electronic, the plastic and chemical, and
the metal production industry. This finding suggests that the shock is mostly concentrated in the
Midwest of the US, particularly in labor markets of the Rust Belt (Indiana, Michigan and Ohio, see
Figure
2
), since they have the largest employment specialization in these industries.
Table
1
provides a descriptive overview over the data that I use in the analysis. Column 1 provides
national means across all 722 CZs included in my sample. Columns 2 to 5 separate the sample into
four quartiles based on their exposure to industrial robots and provide means for the respective
quartile. Panel A shows that the decline in labor force participation from the late 1990s is mainly
driven by the CZs with a heavier utilization of industrial robots. The positive relation is not visible
prior to 1990. Panel B shows that these CZs are also mostly exposed to the contemporaneous
increase in import competition from China. This observation highlights the potentially confounding
impact of the China trade shock on US labor market outcomes. Finally, panel C reports summary
statistics on a set of CZ characteristics (demographics, industries and occupations), which suggest
a positive relation between a labor market’s employment specialization in the manufacturing sector
and robot exposure.
26
The declining trend in
male labor force participation
is already visible from the 1950s and has been compensated by
a rise in
female labor force participation
for many years. However, since the mid 1990s, the labor force participation
rate of women stagnated and did not compensate for the persistent decline in labor force participation of men.
Tables
B1
and
B2
in the Appendix show that this increase is driven by a decline in labor force participation of
prime-age individuals without a college degree and by a rise in the share of the population aged more than 50 years.
The latter result follows from the fact that the ‘baby boom’ generation is moving from 26-44 years of age in 1990
to 50-68 years in 2014 and that older workers have lower labor force participation rates than prime-age workers.
3
Empirical strategy
My analysis relies on a task-based framework in which robots compete with human labor in the
execution of different tasks (
Acemoglu and Restrepo
,
2020
). Robots may increase or reduce
employ-ment, and accordingly have an ambiguous impact on unemployment and labor force participation.
The overall effect mainly depends on the relative size of three countervailing effects that influence the
general equilibrium impact of robots on the demand for labor (
Acemoglu and Restrepo
,
2018
,
2019
,
2020
). First, robots generate a displacement effect, as they take over tasks otherwise performed by
workers. This effect reduces the share of labor in the industry undergoing automation and may also
reduce its overall labor demand. Second, robots increase the marginal productivity of labor and
contribute to the creation of non-automated tasks, raising the demand for labor within the same
industry (composition effect ) and across industries (productivity effect ). The effect of robots on the
aggregate labor demand depends on the relative size of these effects.
I estimate the labor market effect of robots on employment, unemployment and labor force
nonpar-ticipation as a share of the working-age population using a stacked first-difference specification with
722 CZs and three time periods (1993-2000, 2000-07, 2007-14).
27,28The key estimating equation is
given by:
∆Y
c,(t0,t1)= β US robot exposure
c,(t0,t1)+ X
0c,(t0,t1)
Γ + ε
c,(t0,t1)(1)
where ∆Y
c,(t0,t1)=
NLc,t1c,t1
−
Lc,t0
Nc,t0
is the change in the outcome of interest among working-age
individ-uals in CZ c between year t
0and t
1, L
c,tis the number of employed, unemployed or nonparticipating
individuals in their working age and N
c,tis the working-age population in CZ c and year t. US robot
exposure is a measure of the introduction of robots in CZ c between year t
0and t
1. X
0is a vector
of regional characteristics and economic variables that include pre-existing trends in US labor force
participation and employment in the manufacturing sector between 1970 and 1990; Chinese import
competition; the demographic, industrial and occupational composition of CZs; and time-varying
27
The share of employment and the share of nonparticipation are synonyms of the employment rate and the
nonpar-ticipation rate. The share of unemployment is the number of unemployed divided by the working-age population,
i.e. the sum of employed, unemployed and nonparticipating individuals. This definition is different from the usual
unemployment rate, but makes the coefficients comparable and allows to identify the flows’ magnitude from one
employment status to another.
28
Since I use data on labor market outcomes from the 1990 census and health outcomes from the BRFSS and NIS,
which range only up to 2011, I rescale the 1990-2000 and 2007-11 periods to 7-year equivalent changes to achieve
comparability across periods.
census-division fixed effects to control for division-specific business cycles.
29,30Similarly to
Acemoglu and Restrepo
(
2020
), I measure a local labor market’s exposure to industrial
robots using a shift-share measure:
US robot exposure
c,(t0,t1)=
X
j∈J`
1990c,j"
R
j,tU S 1− R
U S j,t0L
U Sj,1990− g
U S j,(t0,t1)R
U Sj,t 0L
U Sj,1990#
(2)
The term in brackets is a measure of industrial robot density, measured as the national adoption of
robots in industry j, ∆R
j,(tU S0,t1)
, relative to its workforce in 1990, L
U S
j,1990
, adjusted for the adoption of
robots which is driven by overall industry growth, g
j,(tU S0,t1)
. The industry level shock is apportioned
across local labor markets using CZs’ industry employment shares, `
1990 c,j=
L1990 c,j L1990 c. The baseline
employment shares are kept constant to avoid endogeneity and serial correlation concerns across
periods of my stacked first-difference specification.
Identification builds on the assumption that advancements in robotics technology vary by industry
and expose local labor markets differently depending on the industrial composition of employment.
However, US firms may adopt robots in response to domestic industry-specific shocks which
in-fluence also the demand for labor. To address this endogeneity concern, I apply the IV strategy
presented in
Acemoglu and Restrepo
(
2020
) and instrument the shift-component of Equation
2
us-ing contemporaneous changes in the stock of robots in seven European countries with a comparable
adoption of robots as the US:
EU7 robot exposure
c,(t0,t1)
=
X
j∈J1
7
X
i∈EU 7`
1970c,j"
R
ij,t1− R
i j,t0L
ij,1990− g
i j,(t0,t1)R
ij,t0L
ij,1990#
(3)
where R
ij,tis the stock of robots in country i ∈ EU 7 at time t in industry j. EU 7 countries include
Denmark, Finland, France, Italy, Spain, Sweden and the United Kingdom.
31On average, these
29
CZs’ compositional characteristics control for systematic differences across local labor markets which may bias
the estimates of the effect of robots on labor market outcomes. They are kept constant at 1990 levels to avoid
contamination by the endogenous adjustments in CZ characteristics in response to robot exposure.
30
Census divisions are administrative divisions of the US territory into nine groups of states: New England, Middle
Atlantic, South Atlantic, East North Central, East South Central, West North Central, West South Central,
Mountain and Pacific.
31
The IFR provides data on the stock of robots by industry from the early 1990s also for Norway. However, I have
to omit this country because the employment and output data necessary to construct Equation
3
are not available
in the EU KLEMS database, since Norway is not a member of the European Union.
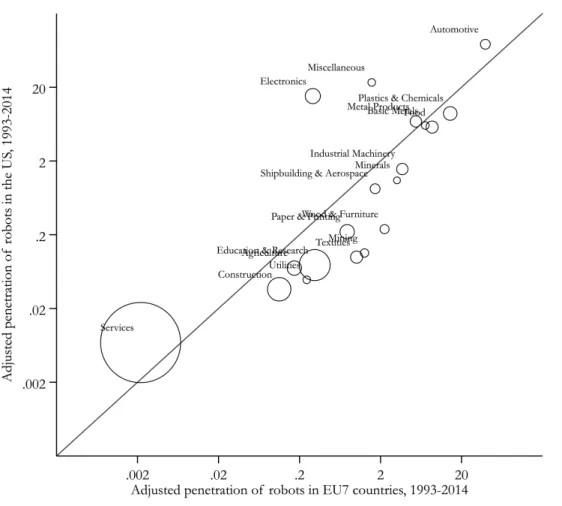
countries have a similar development in robot adoption as the US.
32The IV strategy aims at identifying the labor market effects of exogenous improvements in robotics
technology available to US firms. The strategy relies on the assumptions that the adoption of robots
in European countries is positively related to the adoption of robots in the US, but it is unrelated to
domestic labor market conditions. The first condition can be easily verified (see first-stage results
in Table
3
and industry correlations in Figure
B1
). However, the exclusion restriction may not
be necessarily fulfilled, since the rapid adoption of robots in Europe may have made European
firms more competitive than their US peers, unveiling a possible causal link with the decline in
US employment via international product market competition. Although I cannot fully rule out
this possibility, I address this potential threat to identification through the construction of the
instrument and a set of robustness checks. First, the instrument purposely does not include the
countries with the heaviest adoption of industrial robots worldwide, namely South Korea, Germany,
and Japan. These countries are also among the principal trading partners of the US and could
directly impact US employment through the national adoption of robots. Second, I use alternative
constructions of the instrument which include only countries that are least engaged in trade with
the US (Denmark, Finland and Sweden) and whose adoption of robots is unlikely to affect US
employment. Third, I account for international competition in the product market between the
US and Europe by including a shift-share measure of US import exposure from the European
countries included in the instrument.
33I control also for the existence of confounding
industry-specific shocks which may influence the adoption of industrial robots both in the US and in Europe
by sequentially excluding each industry one at a time from the shift-share measure. Furthermore,
32
Following
Autor et al.
(2013) and
Acemoglu et al.
(2016), I use a shift-share approach to measure a labor market’s
exposure to imports from China and interact CZs’ industry employment shares in the manufacturing sector prior
to the admission of China to the World Trade Organization in 2001 with the growth in product trade flows from
China to the US. Analogously to Equation
3, I exploit plausibly exogenous variation in the trade shock to estimate
its effect on US labor market outcomes. I instrument the shift component with trade flows from China to other
industrialized countries with a similar development in trade flows as the US, namely Australia, Denmark, Finland,
Germany, Japan, New Zealand, Spain, and Switzerland.
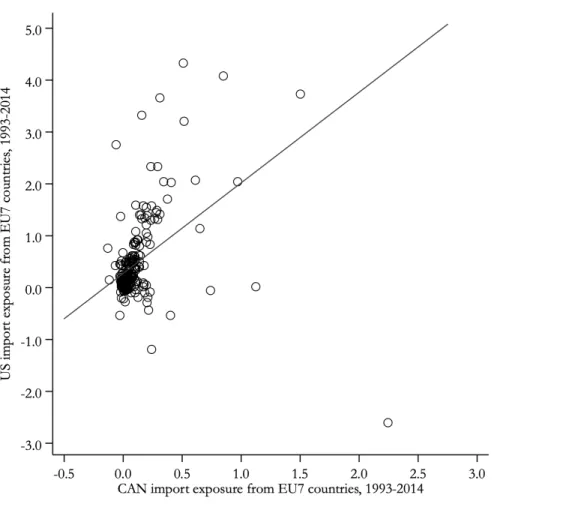
33
This measure is constructed by interacting a CZ’s initial industry employment shares in the manufacturing sector
with the growth in product trade flows from Denmark, Finland, France, Italy, Spain, Sweden and the United
Kingdom to the US. I keep the baseline employment shares constant to avoid endogeneity and serial correlation
concerns in the employment composition within labor markets. Although the shift component of this measure
may be subject to domestic shocks which affect also US employment, it helps to control for (at least some of) the
international competition in the product market which emerges from the adoption of robots in Europe. I further
address this endogeneity concern by using trade flows from Europe to Canada, an industrialized country with a
comparable trade engagement with European countries as the US (see Figure
B2).
I follow the approach presented in
Acemoglu and Restrepo
(
2020
) and
Goldsmith-Pinkham et al.
(
2020
) and instrument the share component with plausibly exogenous employment shares. I use
industry employment shares from 1970 to focus on the industrial composition of employment that
precedes the introduction of industrial robots, which started in the 1980s.
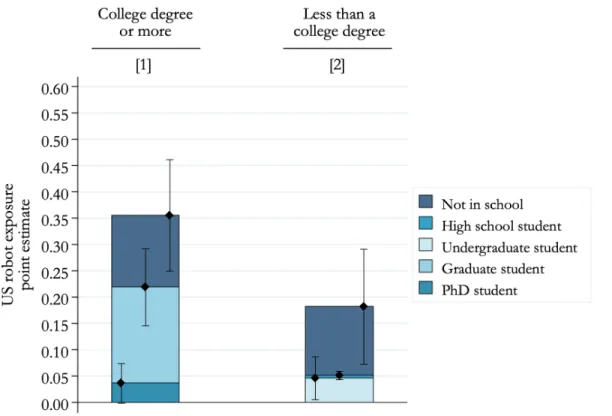
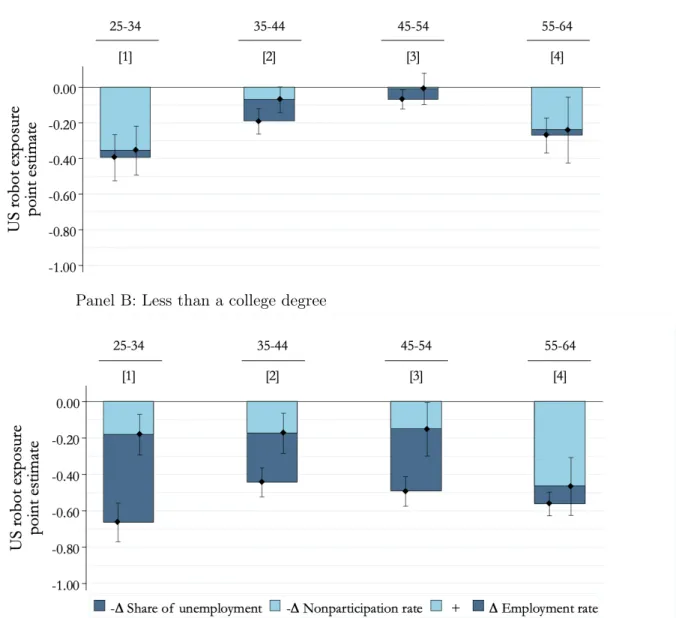
In a further step, I investigate heterogeneity in the labor market effect of robots for different groups
of the working-age population. I use a breakdown of the population by four 10-year age groups
(25-34, 35-44, 45-54 and 55-64 years) and by two education levels, distinguishing between individuals
which have achieved at least an undergraduate college degree and individuals without a college
degree (college-educated and less educated).
34I estimate the effect of robots on employment,
unemployment and nonparticipation for each of the eight population subgroups g ∈ G analogously
to Equation
1
:
∆Y
gc,(t 0,t1)= β
gUS robot exposure
c,(t0,t1)+ X
0 c,(t0,t1)Γ
g+ ε
g c,(t0,t1)(4)
In this case, ∆Y
gc,(t0,t1)
is the change in the outcome of interest among individuals of the respective
group g in CZ c between year t
0and t
1, ∆Y
gc,(t0,t1)
=
Lgc,t1 Nc,t1g
−
Lgc,t0
Nc,t0g
. US robot exposure and the
vector of regional characteristics and economic variables are the same as in Equation
1
.
4
Robots and nonparticipation
In this section, I present the results of the labor market effect of the adoption of robots on labor
market outcomes. I start by estimating Equation
1
using the change in the share of employment,
manufacturing employment, unemployment and nonparticipation as outcomes. The IV estimates of
the effect of robots are reported in Table
3
.
35The coefficients are standardized and represent the
estimated effect of a one standard deviation increase in robot exposure on the change in labor market
outcomes. All outcomes are expressed in percentage points of the working-age population. Panel A
presents the estimates of the effect of robots on employment, panel B on manufacturing employment,
34
The less educated group includes high school and undergraduate college dropouts, individuals which have achieved
at most a high school diploma, and students that are enrolled in college, but which have not achieved an
under-graduate degree.
35
OLS and reduced form estimates are presented in Tables
B3,
B4,
B5
and
B6. IV estimates of the labor market
effect of robots from Table
3
are larger in magnitude than OLS estimates since US robot adoption is likely to be
correlated with omitted demand channels that bias the estimates towards zero.
panel C on unemployment and panel D on nonparticipation. Finally, panel E displays first-stage
results which show that the adoption of robots in European countries is strongly correlated with
the adoption of robots in the US throughout all specifications.
36Column 1 presents the baseline estimates of the effect of robots on labor market outcomes
control-ling only for division-specific business cycles. Regressions are weighted by the CZ population in
1990 and standard errors allow for arbitrary clustering at the state level.
37The estimates indicate
that the introduction of robots has a negative employment effect, which is driven by a reduction in
manufacturing employment, i.e. the displacement effect outweighs the productivity and the
com-position effect. For every 10 workers that are displaced by automation, labor force participation
declines by almost 6 individuals (0.261/0.444). However, the estimates of this parsimonious
speci-fication have to be interpreted carefully, since they may be subject to an omitted variable bias. In
fact, the decline in employment and the adoption of robots could be driven by downward trends in
the demand for labor in some industries, international competition or other CZ trends which I need
to control for.
In column 2, I include the change in the local labor force participation rate and the decline in
manufacturing employment between 1970 and 1990 to account for potential pre-trends that may
influence both labor market outcomes and the adoption of robots. The inclusion of these controls
do not alter my estimates of the effect of robots, which are quantitatively and qualitatively similar
to the estimates in column 1. This result suggests that my findings are not driven by pre-existing
36
The Kleinbergen-Paar rank F-statistic is significantly higher than 10, which allows me to conclude that the
in-strument is not weak. This claim refers to the widely used ‘rule of thumb’ according to which weak identification
should not be considered a problem in cases in which the F-statistic is higher than 10 (Staiger and Stock,
1997).
However, there is no general agreement on this statement, since, to the best of my knowledge, there is no widely
accepted study which tests for weak instruments in the presence of errors which are not i.i.d.
Baum et al.
(2007)
suggest that another strategy to test for weak identification is to apply with caution the critical values complied by
Stock and Yogo
(2005) for the i.i.d. case (ref.
Cragg and Donald
(1993)). The Kleinbergen-Paar rank F-statistic
is significantly higher than the Stock-Yogo critical values throughout all specifications (not reported) which, again,
suggests that I should not worry about weak instruments.
37
Borusyak et al.
(2018) argue that standard errors need to consider also potential correlations across CZs resulting
from common industry-level shocks. I re-estimate Equation
1
as in column 4 of Table
3
with standard errors that
account for this correlation (not reported) and do not find systematic differences to my baseline standard errors.
In a separate regression (not reported), I cluster standard errors at the census-division level to control also for
the correlation of the residuals between neighboring CZs of different states. Again, the standard errors are almost
unchanged to my baseline specification and do not affect the significance of my results.
trends.
38Column 3 includes also a local labor market’s exposure to Chinese imports, which may confound
the effect of robots. Interestingly, the inclusion of the trade shock does not affect the magnitude
and significance of my results. This finding shows that, in spite of both shocks being concentrated
in the manufacturing sector (
Autor et al.
,
2013
,
Acemoglu and Restrepo
,
2020
), the labor market
effects of robots and imports are mostly unrelated to each other.
39Column 4 adds a set of demographic, industry and occupation controls to account for systematic
differences across local labor markets. Again, almost all estimates have a similar magnitude as in
the previous specifications and are statistically significant at the 1 percent level.
40Similarly to the
specification in column 1, I find that for every 10 workers that are displaced by automation, labor
force participation declines by almost 6 individuals.
41Finally, column 5 displays unweighted regression estimates of the effect of robots on labor market
outcomes. These estimates are less precise and are larger in magnitude than in the previous
spec-ifications, but they are proportionally comparable to weighted regression estimates: for every 10
workers that are displaced by automation, 5 individuals leave the labor force.
I use the specification of column 4 as my preferred specification throughout the subsequent analysis,
since it includes the full battery of controls. Moreover, I weight CZs with their population in 1990
to account for the relative contribution of the local nonparticipation rate to the national
nonpar-ticipation rate.
42I find that, on average, a one standard deviation increase in US robot exposure
38
I test for the existence of pre-trends that may bias my results also from a different angle. I perform a ‘placebo test’
and estimate a two-period model in which I regress the change in the local nonparticipation rate for the 1970-80
and 1980-90 periods on the exposure to robots during the first two periods of my sample (1990-2000 and 2000-07).
Table
B7
summarizes the results. I do not find any significant relationship between the introduction of robots and
trends in nonparticipation before the 1990s.
39
Faber et al.
(2019) compare the impact of robots and imports on local employment and find that the shocks are
similar in their geographic distribution, but that there are substantial differences with respect to the spillovers that
they exert to industries outside of the manufacturing sector, and hence on overall employment.
40
The only exception is an absolute decrease in the estimated effect of robots on employment in the manufacturing
sector from −0.440 to −0.284, which is in line with the inclusion of covariates that control for the secular decline
in manufacturing employment.
41
These estimates include the direct effect of robots on employment and spillover effects across industries and
occu-pations (Acemoglu and Restrepo,
2020). Note that the proportion of individuals that leave the labor force is lower
when considering also displaced workers who reintegrate in labor markets through other jobs.
42
As outlined in
Cadena and Kovak
(2016), when examining outcomes across labor markets of different sizes, efficient
weights must account for individuals’ sampling weights to account for inherent heteroskedasticity. They show that
optimal weights are strongly correlated with initial population sizes and therefore are well approximated by the
initial population of a local labor market.
increases the US nonparticipation rate of white working-age men by 0.271 percentage points. This
translates into an increase in the nonparticipation rate of 0.55 percentage points (0.271/0.491) or
roughly 264’000 individuals for each additional robot per thousand workers.
43,44According to the
labor force participation and robot adoption trends shown in Figure
1
, the introduction of industrial
robots between 1993 and 2014 explains about 15 percent of the decline in US labor force
participa-tion in these years, which corresponds to roughly 395’000 workers leaving the labor force, i.e. one
additional robot drives two workers out of the labor force. This effect is already visible before the
start of the Great Recession, which boosted labor force nonparticipation from the end of 2007, and
is not statistically significantly different during this period of time (see Table
B8
).
45A natural answer to the question of how workers can afford to leave the labor force in case of
displacement is that their job loss is compensated by the labor force participation of a family
member (
Lundberg
,
1985
, and Table
B1
). I find only limited support for this hypothesis, since half
of the individuals who do not participate in the labor force because of automation do not have a
partner or a family member which is employed (see Figure
B3
) and since robots reduce employment
also among women (see Table
B9
).
46The margins of adjustment of nonparticipants in response to
automation are analyzed in more detail in Section
5
.
43
I destandardize the effect of US robot exposure on the change in the nonparticipation rate by dividing the coefficient
of my preferred specification in Table
3
by the standard deviation of the variable expressed in robots per thousand
workers from Table
4.
44
I use US population data on the population of white men aged between 25 and 64 years from the
1990 Census of
Population
(Table 26, p.37) and the estimate of the effect of US robot exposure on the change in the nonparticipation
rate from my preferred specification in Table
3. These estimates report a rough estimation of the effect of robots on
US nonparticipation, but they do not consider general equilibrium effects.
Acemoglu and Restrepo
(2020) present
a parametric model to quantify aggregate local employment effects of robots in the US. They estimate that the
increase in robots between 1990 and 2014 reduced aggregate (private) employment by 720’000 jobs, which is in line
with my results.
45
A concern that I need to address is whether poor labor market conditions trigger workers’ labor supply responses
against the automation shock which are different than during ordinary times. I account for this concern in two
ways. First, I estimate Equation
1
by excluding the 2007-14 period to verify whether the effect of robot adoption
on the nonparticipation rate is already visible before the Great Recession. Second, I interact robot exposure with a
dummy for the 2007-14 period to test whether the effect of robots is statistically and economically different during
the Great Recession.
46
Among independent family units (i.e. household head or spouse), two thirds of the individuals that left the labor
force do not have a partner who could compensate their labor force exit. This result is in line with
Juhn and Potter
(2006) who argue that the employment status of the partner is not a key determinant for the labor supply decision
of men.
4.1
Robustness checks
Before moving to Section
5
, I perform a set of robustness checks in support of my preferred
specifi-cation of Table
3
and of my identification strategy.
The results presented in the previous section estimate the effect of robots by exploiting both
cross-sectional variation in robot exposure across labor markets and temporal variation in robot exposure
within labor markets. I verify the relative importance of these sources of variation using a single
long-difference specification over my entire sample period and using a stacked first-long-difference specification
with CZ fixed effects respectively. The latter specification is more demanding and accounts also
for unobserved time-invariant differences in CZ characteristics which may influence the adoption
of robots and labor market outcomes. The results are summarized in Table
4
. In the first part,
I observe that between-CZs variation in robot exposure accounts for most of the overall variation,
suggesting that the adoption of robots is mainly driven by secular industry specialization at the
local labor market level. The second part of Table
4
reports estimates of the labor market effect of
robots by exploiting each source of variation individually. I find that robots have a similar impact
on labor force participation in both specifications.
47These results support the use of the stacked
first-difference model as in my preferred specification, since cross-sectional variation is an important
source of the overall variation in robot exposure and unobserved heterogeneity across CZs does not
bias my estimates of the labor market effect of robots.
The high concentration of robots in the automotive industry (see Table
2
) might raise the concern
that the results are driven by underlying trends that affect CZs which are highly specialized in this
industry.
48To address this concern, I decompose the stock of industrial robots into robots adopted
in the automotive industry and robots adopted in other industries and construct two separate
47
In Table
4, the estimate of the effect within CZs is twice as large as the estimate of the effect across CZs, i.e. a one
standard deviation increase in robot exposure within the same CZ has a stronger impact on the nonparticipation
rate than the same difference across CZs. However, when multiplying the estimates with the respective standard
deviations of the variable, I obtain almost identical results. The long-difference estimate is equal to 0.284 (0.309 ×
0.921) and the stacked first-difference specification with CZ fixed effects is equal to 0.273 (0.699 × 0.391).
48
Table
B10
shows the average industry weights of the top eight industries of the shift-share measure – also known
as Rotemberg weights (Goldsmith-Pinkham et al.,
2020) – and the industry contribution to the national change
in the stock of robots during my sample period. The automotive industry has the highest Rotemberg weight and
contributes to the change in robot adoption for more than 50 percent. In other words, the automotive industry
accounts for half of the introduction of industrial robots between 1993 and 2014. These results show that robot
exposure strongly depends on the development in robot adoption in this industry, which increases the sensibility
of my estimates to other shocks affecting local labor markets specializing in the automotive industry.
measures of robot exposure. I extend this exercise by sequentially excluding each industry at a time
from the shift-share measure to control also for other industry-specific shocks which may confound
the labor market effect of robots (
Goldsmith-Pinkham et al.
,
2020
). Figure
4
reports 19 point
estimates of the effect of robot adoption on labor force participation including all IFR industries
but one. The point estimates are statistically significant at conventional levels for all specifications
and they are most sensitive to the exclusion of robots in the automotive industry. The latter finding
is not surprising, when considering the fact that most robots are adopted in this industry. These
results suggest that the labor market effect of robots on US labor force participation is not driven
by unrelated industry-specific shocks.
49Another concern that I need to address is that the adoption of robots in Europe may directly
influ-ence US labor markets through increased international product market competition, thus violating
the exclusion restriction of my IV strategy. Although I cannot rule out this possibility, I can show
that it is rather unlikely that my results are driven by this causal link. I first control for international
competition on the product market from European countries to the US by including a shift-share
measure of US imports from Europe as a covariate. Between the early 1990s and 2014, trade flows
from Europe to the US have increased substantially. This increase is mainly driven by a rise in US
imports of manufacturing goods which is positively related to the introduction of robots in Europe
(see Figure
B4
). International competition on the product market may therefore confound the effect
of robots on US employment and labor force participation accordingly. Nevertheless, the estimates
reported in Table
5
show that the labor market effect of robots is not affected by the inclusion of
this additional control (see panel A). However, I need to account for endogeneity of this measure,
since US imports may be subject to domestic shocks which are also affecting local employment. I
account for this concern in panel B by using trade flows from Europe to Canada – a country with
a comparable trade engagement with European countries as the US (see Figure
B2
) – rather than
to the US. The results are again quantitatively and qualitatively unaffected by the inclusion of the
additional control. In a second approach, I omit European countries with a large trade engagement
49


![Table 3: Effect of robots on employment, unemployment and nonparticipation [1] [2] [3] [4] [5] Panel A: Employment US robot exposure -0.444 ∗∗∗ -0.467 ∗∗∗ -0.464 ∗∗∗ -0.485 ∗∗∗ -0.750 ∗∗∗ (0.079) (0.086) (0.077) (0.047) (0.156) Observations 2166 2166 2166](https://thumb-eu.123doks.com/thumbv2/123doknet/14307701.494906/50.918.140.782.152.862/table-effect-employment-unemployment-nonparticipation-employment-exposure-observations.webp)