HAL Id: hal-02126146
https://hal.archives-ouvertes.fr/hal-02126146
Submitted on 10 May 2019
HAL is a multi-disciplinary open access
archive for the deposit and dissemination of
sci-entific research documents, whether they are
pub-lished or not. The documents may come from
teaching and research institutions in France or
abroad, or from public or private research centers.
L’archive ouverte pluridisciplinaire HAL, est
destinée au dépôt et à la diffusion de documents
scientifiques de niveau recherche, publiés ou non,
émanant des établissements d’enseignement et de
recherche français ou étrangers, des laboratoires
publics ou privés.
COMPARISON AND ASSESSMENT OF 3D
REGISTRATION AND GEOREFERENCING
APPROACHES OF POINT CLOUDS IN THE CASE
OF EXTERIOR AND INTERIOR HERITAGE
BUILDING RECORDING
Arnadi Murtiyoso, Pierre Grussenmeyer
To cite this version:
Arnadi Murtiyoso, Pierre Grussenmeyer. COMPARISON AND ASSESSMENT OF 3D
REGISTRA-TION AND GEOREFERENCING APPROACHES OF POINT CLOUDS IN THE CASE OF
EX-TERIOR AND INEX-TERIOR HERITAGE BUILDING RECORDING. ISPRS TC II Mid-Term
Sympo-sium ”Towards Photogrammetry 2020”, Jun 2018, Riva del Garda, Italy. pp.745-751,
�10.5194/isprs-archives-XLII-2-745-2018�. �hal-02126146�
COMPARISON AND ASSESSMENT OF 3D REGISTRATION AND GEOREFERENCING
APPROACHES OF POINT CLOUDS IN THE CASE OF EXTERIOR AND INTERIOR
HERITAGE BUILDING RECORDING
A. Murtiyoso* and P. Grussenmeyer
Photogrammetry and Geomatics Group, ICube Laboratory UMR 7357, INSA Strasbourg, France – (arnadi.murtiyoso, pierre.grussenmeyer)@insa-strasbourg.fr
Commission II, WG II/8
KEY WORDS: Point Cloud, 3D Registration, Georeferencing, Exterior, Interior, Heritage Buildings, UAV Photogrammetry, TLS,
Assessment, PCL
ABSTRACT:
In the field of 3D heritage documentation, point cloud registration is a relatively common issue. With rising needs for Historic Building Information Models (HBIMs), this issue has become more important as it determines the quality of the data to be used for HBIM modelling. Furthermore, in the context of historical buildings, it is often interesting to document both the exterior façades as well as the interior. This paper will discuss two approaches of the registration and georeferencing of building exterior and interior point clouds coming from different sensors, namely the independent georeferencing method and the free-network registration and georeferencing. Building openings (mainly windows) were used to establish common points between the systems. These two methods will be compared in terms of geometrical quality, while technical problems in performing them will also be discussed. Furthermore, an attempt to automate some parts of the workflow using automatic 3D keypoints and features detection and matching will also be described in the paper. Results show that while both approaches give similar results, the independent approach requires less work to perform. However, the free-network method has the advantage of being able to compensate for any systematic georeferencing error on either system. As regards to the automation attempt, the use of 3D keypoints and features may reduce processing time; however correct tie point correspondence filtering remains difficult in the presence of heavy point cloud noise.
*
Corresponding author
1. INTRODUCTION
3D recording of heritage buildings is a topic which has been much discussed. Various methods, both image-based and range-based, are employed to this end (Remondino, 2011). Today technological advances have diversified the recording tools, from Terrestrial Laser Scanners (TLS) (Cosso et al., 2014; Grussenmeyer et al., 2010) to drones or Unmanned Aerial Vehicles (UAVs) (Murtiyoso and Grussenmeyer, 2017). Point clouds are a typical product of these recording processes. Point cloud generation in this regard is often limited to either the exterior of the object in question or its interior. In the case of heritage buildings, an exterior model is useful for façade analysis and general visualisation (Fritsch et al., 2013). On the other hand, interior point clouds has also seen an increasing need, partly due to the advent of AR (Augmented Reality)/VR (Virtual Reality) technologies, as well as the increasing use of BIM (Building Information Model) technology (Quattrini et al., 2015). Indeed, a whole sub-topic in BIM concerning heritage objects has generated the term Historic BIM (HBIM) (Murphy et al., 2009).
The recording method for the exterior and interior parts of the building may also differ, depending on the nature of the object. For example, in order to generate exterior point clouds for tall structures, a UAV photogrammetric mission may be more appropriate than a TLS one. Conversely, UAV deployment in interior situations may be complicated, in which case TLS or close-range terrestrial photogrammetry may be better adapted.
In light of the necessity to create a complete HBIM of a heritage object, it is interesting to combine heterogeneous point clouds generated by these different sensors of the building’s exterior and interior (Fassi et al., 2011). Also in the interest of keeping the geometric quality, it is also important to devise a method of quality control for the resulting registered point cloud. This is more so when the resolution of the point clouds are heterogeneous, as in the case where the point cloud sources are different (Grussenmeyer et al., 2012).
One main problem that arises from the registration of exterior and interior data is the lack of overlap between the two point clouds, more so when both datasets were acquired separately and using different types of sensors. This paper presents a comparison of two registration approaches in order to combine the exterior and interior point clouds of a heritage building. Assessment of the geometric quality of each approach will be performed using checkpoint residuals. These checkpoints were measured independently from the main point cloud acquisition mission. In addition, some ongoing work on the automation of some parts of the exterior-interior registration workflow will also be presented. This is performed essentially using automatic 3D feature detection and matching.
A case study was performed on the St-Pierre-le-Jeune church in the city of Strasbourg, France, which was recently inscribed in the UNESCO World Heritage list. The exterior point cloud was obtained using a combination of UAV and close-range terrestrial photogrammetry (Figure 1(a)); while the interior point cloud was acquired using a TLS (Figure 1(b)).
The International Archives of the Photogrammetry, Remote Sensing and Spatial Information Sciences, Volume XLII-2, 2018 ISPRS TC II Mid-term Symposium “Towards Photogrammetry 2020”, 4–7 June 2018, Riva del Garda, Italy
(a) (b)
Figure 1. The two point clouds used in this paper: (a) exterior point cloud generated by UAV and terrestrial photogrammetry, and (b) interior point cloud generated by TLS.
2. RELATED WORK
The registration of separate point clouds into the same system has been much addressed. Basic principles of 3D registration involves similar methods to the ones used, for example, in photogrammetric absolute orientation (Wolf et al., 2014). The 3D registration of point clouds typically commences with a coarse transformation, often computed using the classical 7-parameters 3D similarity transformation. Normally this computation is based on the least-squares method, which enables a block adjustment on the whole system and is based on common points between the two point clouds. Several algorithms for solving the transformation computation can be found, e.g. Singular Value Decomposition (SVD), Principal Component Analysis (PCA), etc. (Bellekens et al., 2014). The definition of these common tie points can be addressed using several methods, including 3D feature detection, automatic detection of artificial targets (e.g. spheres and coded targets), or manual point measurement. A further refinement of the resulting transformation can then be performed using algorithms such as the Iterative Closest Point (ICP) method (Besl and McKay, 1992). Aside from the relative registration, the point clouds also need to be georeferenced to a common real-world system, so that accurate measurements may be performed on them. Several georeferencing approaches exist in the literature (Lachat et al., 2017; Schuhmacher and Böhm, 2005), which mainly involve either an independent georeferencing for each point cloud (“direct” or sensor-driven) or free-network (“indirect” or data-driven) georeferencing.
An independent georeferencing involves separate transformations for each point cloud, which puts the point clouds directly in the same system. On the contrary, free-network (henceforth “free-net”) georeferencing involves a relative registration of the point clouds, and followed by another 3D similarity transformation towards the cartographic projection system. Independent georeferencing of individual point clouds may provide a faster result, given the fact that they come from different sources, which may already involve a georeferencing process (e.g. absolute orientation in photogrammetry). An ICP process can be performed at this stage to combine both point clouds; however in the case of the
combination of exterior and interior data this is not ideal since only small overlap exists between the two data. As such, a block transformation computation between the point clouds is proposed in the free-net approach, in order to link the point clouds through a block adjustment process.
The identification of tie points between the varying point clouds is an important task in the registration workflow. One method to do this is to identify the tie points manually (Lachat et al., 2016; Munumer and Lerma, 2015). Various experiments on the automation of this task can be found in the literature. Some approaches transform the 3D point cloud into 2D depth maps (Weinmann, 2016) and perform image matching on the two resulting images to find their correspondences (Forkuo and King, 2004). Another approach involves the detection of 3D keypoints and the computation of feature descriptors on both point clouds (Hänsch et al., 2014; Holz et al., 2015).
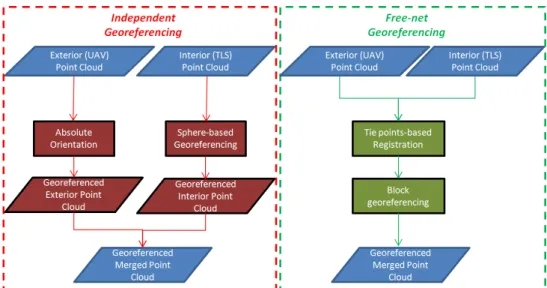
3. RESEARCH DESIGN
In this paper, two registration and georeferencing approaches will be considered (see Figure 2). The first corresponds to the independent georeferencing method, in which both point clouds (exterior and interior) were georeferenced separately. The exterior photogrammetric point cloud was georeferenced by means of absolute orientation, while the interior TLS point cloud was georeferenced using the coordinates of the 3D spheres measured during the acquisition. Both georeferencing were performed on the same system, thereby giving a merged result directly in the absolute system. The second free-net approach will register both un-georeferenced point clouds in an arbitrary coordinate system, before applying 3D similarity transformation to attach it to the georeferenced system via control points. The registration is based on a set of tie points, which are evenly distributed throughout the building. These tie points concern mainly openings such as windows. The tie points were identified in the first place by manual measurements, with results to be discussed in section 4.1. Afterwards, an ongoing work on the automation of tie point detection and matching will be presented in section 4.2. In both cases, an ICP procedure is not feasible due to the minimum overlapping zones between the two datasets.
The International Archives of the Photogrammetry, Remote Sensing and Spatial Information Sciences, Volume XLII-2, 2018 ISPRS TC II Mid-term Symposium “Towards Photogrammetry 2020”, 4–7 June 2018, Riva del Garda, Italy
Figure 2. The two approaches to point cloud registration and georeferencing used in this experiment.
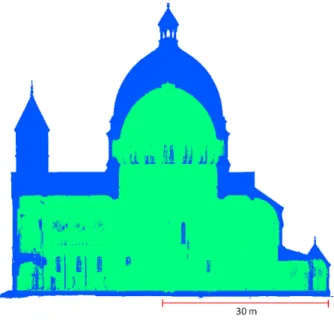
Figure 3. Horizontal profiles of the exterior (green) and interior (red) data showing the tie point distribution used for the free-net registration.
In the free-net approach, a total of 24 tie points (Figure 3) were identified on the church. The windows which represent overlapping spaces between the exterior and interior were used as point candidates, although physically they are not the same points due to the thickness of the window panes. In this regard, by assuming a window pane thickness of around 2 cm, an error of this order should be expected on the final results. Furthermore, the point clouds used in the experiment were subsampled to 1 cm in order to give a more manageable data set while keeping enough details to identify as tie point candidates. In order to assess the quality of the registration and georeferencing of both approaches, a set of independent check points were measured on the exterior and interior of the building using a total station. The spatial intersection method was chosen to measure these points, in order to generate high-precision coordinates with standard deviation values available. Measurements were based on a traverse network established in and around the church. Each check point was measured from at least two stations. In this paper, the Trimble S8 robotic total station was used to perform the measurements. Coordinates of these points on the processed point cloud issuing from both
approaches were then compared to the ones measured using the total station. The comparison of their residuals was then used as a criterion for quality assessment.
In terms of software used in the experiments, the open source software CloudCompare (version 2.9.1) and the scientific software 3DVEM were used. CloudCompare offers a 3D transformation module in which a standard similarity transformation is performed. The software gives the users possibility to choose between a 6-parameters (no scaling) or 7-parameters (with scaling) transformation. 3DVEM is a scientific software programme developed by the University of Valencia (Spain) which performs point cloud registration and georeferencing with the possibility to use the standard least-squares based method or robust estimators (namely the modified Danish and minimum sum estimators) (Fabado et al., 2013). One of its advantages is access towards supplementary statistics (e.g. standard deviations) which is often useful as means of project quality control. 3DVEM does not, however, support registrations with scaling factors. The automation experiment uses the C++-based Point Cloud Library (PCL) and its functions (Rusu and Cousins, 2011).
The International Archives of the Photogrammetry, Remote Sensing and Spatial Information Sciences, Volume XLII-2, 2018 ISPRS TC II Mid-term Symposium “Towards Photogrammetry 2020”, 4–7 June 2018, Riva del Garda, Italy
4. RESULTS AND DISCUSSIONS 4.1 Independent georeferencing
In the independent georeferencing approach, each data set was georeferenced separately using methods employed in their respective workflow. The exterior point cloud was generated entirely from images taken using UAVs and cameras; thus the georeferencing follows the absolute orientation method normally seen in photogrammetry. A total of 25 ground control points (GCPs) were used to this end, yielding an overall RMS value of 0.018 m on the GCP residuals.
The interior of the church was scanned entirely using the FARO Focus X330 terrestrial laser scanner (TLS). The registration between the stations was performed using the FARO Scene software, with the aid of automatically detected spheres and targets. The coordinates of these spheres were measured using a total station, enabling the georeferencing of the interior point cloud. A total of 31 spheres and targets were used in the georeferencing process, yielding an overall final precision of 0.010 m.
The control points used in both data sets were measured from traverse network points. This network was measured in the French national projection system, with several points fixed using GNSS-measured coordinates. Since no levelling benchmark was to be found near the site, the GNSS altitudes were used in the coordinate computation. This common projection system used by the control points in both data sets means that at the end of their respective georeferencing process the interior and exterior point clouds were directly merged in one coordinate system. The results of this approach are illustrated in Figure 4.
Figure 4. The two point clouds registered and georeferenced using the independent method. The blue-coloured part represents the exterior while the green-coloured one represents
the interior.
4.2 Free-net registration and georeferencing
The free-net approach assumes that both data sets have been neither registered on each other nor georeferenced to the reference system. In practice, in the interior TLS data this means that the point cloud was simply not georeferenced. In the
photogrammetric exterior point cloud, the absence of absolute orientation implies that the relative model is not scaled either. Since 3DVEM does not support scaling during the registration step, absolute orientation was nonetheless performed on the photogrammetric data. However, noises on the rotational and translational parts were introduced on purpose to generate a simulated data for the purposes of the experiment.
The registration was based on the 24 tie points manually measured on both point clouds. The process was performed on the software CloudCompare as well as 3DVEM. In 3DVEM, a standard least-squares (LS) based transformation as well as the minimum sum (MS) robust estimator (Sharon et al., 2009) were tested. The results in terms of tie point residuals are showed by Table 1. Free-net Registration Software Residuals RMS (m) CloudCompare 0.028 3DVEM LS 0.029 MS 0.029
Table 1. RMS of the tie point residuals used for the registration of the exterior and interior point clouds using the free-net
approach.
As can be seen from Table 1, all proposed algorithms give similar results of the order of 0.030 m in RMS. Assuming a point marking precision of 0.010 m, this value is only slightly outside the a priori tolerance of 2σ (for a level of confidence of 95%) but falls within the 3σ (99.8% level of confidence) range. It is also worth noting here that the use of robust estimators in this case does not show a significant difference from the use of standard least squares solution.
Once the registration was performed, the georeferencing step followed which used 15 photogrammetric GCPs on the exterior and 6 measured 3D spheres in the interior. This georeferencing was performed in block, using all 21 control points at the same time. Again, CloudCompare and 3DVEM were used to this end. Both implement a standard rigid-body transformation to perform this step. Results to this georeferencing process can be consulted in Table 2.
Free-net Georeferencing Software Residuals RMS (m)
CloudCompare 0.031
3DVEM 0.031
Table 2. RMS of the control point residuals used in the georeferencing process using the free-net approach. The RMS of the control point residuals in both solutions shows similar results. The values obtained are also of the same order with the registration RMS, further showing the georeferencing precision of the process and the absence of systematic error.
4.3 Checkpoint validation
In order to validate the accuracy of the results from the independent and free-net approaches, checkpoints were compared between those measured separately using a total station and those measured on the resulting merged point clouds. While the georeferencing RMS in each method shows their respective precisions, this checkpoint analysis will enable us to determine the accuracy of each result. The average standard deviation of these check point coordinates is 0.008 m.
The International Archives of the Photogrammetry, Remote Sensing and Spatial Information Sciences, Volume XLII-2, 2018 ISPRS TC II Mid-term Symposium “Towards Photogrammetry 2020”, 4–7 June 2018, Riva del Garda, Italy
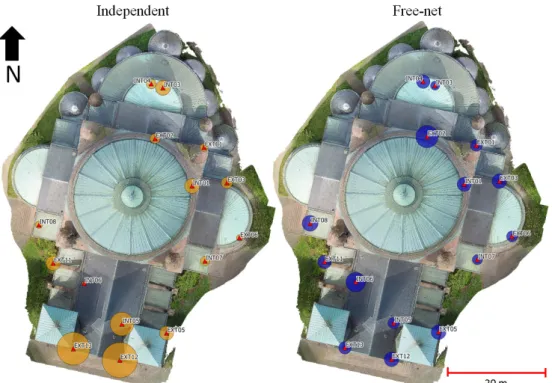
Figure 5. Distribution of the measured checkpoints superimposed on the nadiral orthophoto of the church. The radii of the circles around the points represent the 3D residuals of each point, magnified by a factor of 500 for presentation purposes.
Methods RMS X (m) Y (m) Z (m) 3D (m) Independent 0.017 0.015 0.018 0.029 Free-net CloudCompare 0.014 0.012 0.016 0.024 3DVEM - LS 0.012 0.013 0.018 0.025 3DVEM - MS 0.015 0.013 0.018 0.027 Table 3. RMS of the checkpoint residuals for all tested methods. The results of the checkpoint analysis in terms of RMS values can be seen in Table 3. The 3D RMS values of the free-net approach all show consistencies with their respective registration and georeferencing RMS values. When compared against each other, the free-net RMS values have slight differences, but these are of the order of 0.001 – 0.003 meters and may well reflect the influence of random error during the checkpoint measurement on the point clouds. The independent approach shows a slightly higher value compared to the precision of the respective georeferencing process of the exterior and interior point clouds. In order to detect any irregularities, a comparison was performed for each individual checkpoint.
Upon closer look, the independent method shows signs of systematic error towards the front of the building (see Figure 5). This is particularly true for the exterior data, and may have originated from error propagated from the absolute orientation process of the photogrammetric data. It should be noted that the photogrammetric point cloud was generated in smaller parts before combined in one merged point cloud of the exterior with the aid of GCPs. Furthermore, the front façade of the church presents a case where the imaging sensor is different from the rest of the building. This may have also generated small errors, which results in the systematic trend of the checkpoint residuals as can be seen here.
The free-net checkpoint residuals, as can also be seen in Figure 5, show a more even distribution of error throughout the whole
site. This is to be expected, due to the fact that the georeferencing was performed in block in one same system. The systematic errors present in either of the data sets were therefore adjusted in this case.
4.4 Experiments on partial automation of the workflow
In the previous section, the free-net approach has been demonstrated to be useful in cases where independent georeferencing may induce systematic errors. However, in terms of processing time, the independent approach requires less time in the context of an exterior-interior data acquisition. This is more so because in many projects, the presence of control points are part of the accepted workflow and will in any case be used to georeference the data. The free-net approach, on the other hand, requires additional work in terms of the identification of tie points for the purpose of the registration. This can be a tedious process, and a way to automate this step can greatly reduce the overall processing time. In this regard, this section will describe some ongoing experiments on the automation of the tie point identification.
In these experiments, the PCL library of functions was used. This section will describe mainly the detection of 3D keypoints, the computation of the feature detectors, and the matching of these 3D tie points using some of the functions already implemented in PCL version 1.8.0.
The first step to the proposed approach involves the pre-segmentation of the exterior and interior point clouds into smaller ones centred on several openings (i.e. windows). The automatic detection of openings has been much discussed in the literature (see for example Boulaassal et al. (2007) and Roca et al. (2013)); however this will not be discussed in this paper. For the purposes of our tests, the segmentation was performed manually, using the same distribution of tie points as seen in Figure 3. Figure 6 shows some of the steps taken in this experiment.
The International Archives of the Photogrammetry, Remote Sensing and Spatial Information Sciences, Volume XLII-2, 2018 ISPRS TC II Mid-term Symposium “Towards Photogrammetry 2020”, 4–7 June 2018, Riva del Garda, Italy
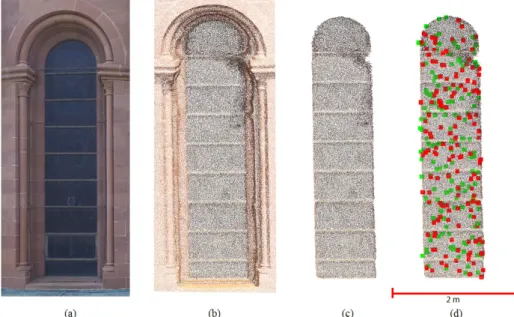
Figure 6. The steps in the keypoint detection and matching: (a) image of an example window opening. Here is shown the exterior side; (b) segmented point cloud of this window; (c) window pane extracted using a RANSAC algorithm; (d) detected SHOT
keypoints. Red denotes exterior keypoints and green interior keypoints. Direct keypoint detection and matching to this kind of
segmentation proved to be insufficient, as the algorithm takes the exterior and interior parts to be the same object. A RANSAC-based plane fitting was therefore employed in order to extract the window panes, the part which involves the overlapping zone between the two data (Figure 6(b)). Working with this data, 3D keypoints were detected on the window glasses. To this end, the 3D SIFT algorithm was used. The 3D SIFT is an implementation of the SIFT method (Lowe, 2004) for 3D data. Results of the keypoint detection can be seen in Figure 6 (c).
In order to find correspondence matches between the detected keypoints, descriptors need to be computed for each keypoint on each data. In this experiment, the SHOT (Signature of Histograms of OrienTations) (Tombari et al., 2010) and FPFH (Fast Point Feature Histograms) (Rusu et al., 2009) descriptors were tested. SHOT gives better results in this particular case. After the computation of the descriptors, a reciprocal correspondence was computed on both keypoint sets to find matches. Finally, a filtering was performed on the detected correspondences to reject bad matches. This filtering step also encounters problems, mainly when faced against noisy point cloud. As the object in question constitutes a reflective material, noise is a very important issue, both for photogrammetry and TLS. This becomes worse with the presence of vegetations on the exterior and bad scanning angles in the interior.
The approach proposed in this section managed to generate a total of 35 tie points from 24 pre-segmented openings. Upon performing the point cloud registration using this set of automatic tie points, an RMS on the computed 3D residuals gives a value of 0.044 m. This is admittedly still not as good as the results obtained from manual measurements; however this ongoing development may prove to be a very useful tool in reducing the processing time of tie point identification.
5. CONCLUSIONS
Analysis on the two approaches tested showed that while it is possible to obtain similar final results from both methods, there
are some advantages as well as disadvantages to each. The independent approach provides a faster solution. Indeed, in projects where control points are measured as part of the established workflow, independent georeferencing is in a way unavoidable. However, the quality of the end result will depend strongly on the separate georeferencing processes implemented in the interior and exterior point cloud. The free-net approach, on the other hand, enables the combining of both data in the same adjustment system. This compensates for any eventual systematic error, as can be seen in this paper. However, the downside of this approach is the necessity to identify tie points on both sides of the building, which may take a lot of time when performed manually.
This paper also proposes a simple chain of automation implemented using PCL, which enables the partial automation of this tie point identification process. Several aspects of this automation process still need to be addressed. For example, the detection and segmentation of the openings remains manual. The filtering of the matched correspondences also needs further improvements, in order to perform more robustly in the presence of noisy data.
The paper aims to test two registration and georeferencing methods for exterior and interior point clouds, in the case of heritage building recording. This is done primarily as a preliminary quality assessment for the point cloud generated by different sensors, before further use in other domains such as HBIM modelling. Indeed, geometric accuracy quality in BIM becomes more and more important in order to faithfully represent the reality. This has led to the necessity to properly validate point cloud data obtained from reality-based techniques, as can be seen in this paper.
ACKNOWLEDGEMENTS
The authors would like to express their gratitude to Samuel Guillemin and Emmanuel Moisan for their help in performing the topographic measurements. The research also benefits from the Indonesian Endowment Fund for Education (LPDP), Republic of Indonesia.
The International Archives of the Photogrammetry, Remote Sensing and Spatial Information Sciences, Volume XLII-2, 2018 ISPRS TC II Mid-term Symposium “Towards Photogrammetry 2020”, 4–7 June 2018, Riva del Garda, Italy
REFERENCES
Bellekens, B., Spruyt, V., Berkvens, R., Weyn, M., 2014. A Survey of Rigid 3D Pointcloud Registration Algorithms, in: Proceedings of AMBIENT 2014. pp. 8–13.
Besl, P., McKay, N., 1992. A Method for Registration of 3-D Shapes. IEEE Transactions on Pattern Analysis and Machine Intelligence Vol. 14(2), pp. 239–256.
Boulaassal, H., Landes, T., Grussenmeyer, P., Kurdi, F., 2007. Automatic segmentation of building facades using terrestrial laser data. The International Archives of the Photogrammetry, Remote Sensing and Spatial Information Sciences, Vol. XXXVI, 3/W52, 2007, pp. 65-70.
Cosso, T., Ferrando, I., Orlando, A., 2014. Surveying and mapping a cave using 3D Laser scanner: The open challenge with free and open source software, in: The International Archives of the Photogrammetry, Remote Sensing and Spatial Information Sciences. Vol. XL-5, pp. 181–186.
Fabado, S., Seguí, A.E., Cabrelles, M., Navarro, S., García-De-San-Miguel, D., Lerma, J.L., 2013. 3DVEM Software Modules for Efficient Management of Point Clouds and Photorealistic 3D Models. The International Archives of the Photogrammetry, Remote Sensing and Spatial Information Sciences. Vol XL-5/W2, pp. 255–260.
Fassi, F., Achille, C., Fregonese, L., 2011. Surveying and modelling the main spire of Milan Cathedral using multiple data sources. The Photogrammetric Record Vol. 26, pp. 462–487. Forkuo, E., King, B., 2004. Automatic fusion of photogrammetric imagery and laser scanner point clouds. The International Archives of the Photogrammetry, Remote Sensing and Spatial Information Sciences Vol. XXXV, pp. 921–926. Fritsch, D., Becker, S., Rothermel, M., 2013. Modeling Façade Structures Using Point Clouds From Dense Image Matching. Proceedings of the Intl. Conf. on Advances in Civil, Structural and Mechanical Engineering, pp. 57–64.
Grussenmeyer, P., Alby, E., Landes, T., Koehl, M., Guillemin, S., Hullo, J.F., Assali, P., Smigiel, E., 2012. Recording approach of heritage sites based on merging point clouds from high resolution photogrammetry and Terrestrial Laser Scanning. The International Archives of the Photogrammetry, Remote Sensing and Spatial Information Sciences, Vol. XXXIX-B5, pp. 553-558.
Grussenmeyer, P., Landes, T., Alby, E., Carozza, L., 2010. High Resolution 3D Recording and Modelling of the Bronze Age Cave “Les Fraux” in Perigord (France), in: The International Archives of the Photogrammetry, Remote Sensing and Spatial Information Sciences, Vol. XXXVIII, Part 5, pp. 262–267. Hänsch, R., Weber, T., Hellwich, O., 2014. Comparison of 3D interest point detectors and descriptors for point cloud fusion. ISPRS Annals of Photogrammetry, Remote Sensing and Spatial Information Sciences Vol. II-3, pp. 57–64.
Holz, D., Ichim, A.E., Tombari, F., Rusu, R.B., Behnke, S., 2015. Registration with the Point Cloud Library: A Modular Framework for Aligning in 3-D. IEEE Robotics & Automation Magazine, December Issue, pp. 110–124.
Lachat, E., Landes, T., Grussenmeyer, P., 2017. First Experiences with the Trimble SX10 Scanning Total Station for Building Facade Survey. The International Archives of the Photogrammetry, Remote Sensing and Spatial Information
Sciences. Vol. XLII-2/W3, pp. 405–412.
Lachat, E., Landes, T., Grussenmeyer, P., 2016. Combination of TLS Point Clouds and 3D Data From Kinect V2 Sensor To Complete Indoor Models, in: The International Archives of the Photogrammetry, Remote Sensing and Spatial Information Sciences. Vol. XLI-B5, pp. 659-666
Lowe, D.G., 2004. Distinctive image features from scale invariant keypoints. International Journal of Computer Vision Vol. 60, pp. 91–110.
Munumer, E., Lerma, J.L., 2015. Fusion of 3D data from different image-based and range-based sources for efficient heritage recording, in: Proceedings of 2015 Digital Heritage. pp. 83–86.
Murphy, M., McGovern, E., Pavia, S., 2009. Historic building information modelling (HBIM). Structural Survey Vol. 27, pp. 311–327.
Murtiyoso, A., Grussenmeyer, P., 2017. Documentation of heritage buildings using close-range UAV images: dense matching issues, comparison and case studies. The Photogrammetric Record Vol. 32, pp. 206–229.
Quattrini, R., Malinverni, E.S., Clini, P., Nespeca, R., Orlietti, E., 2015. From TLS to HBIM. High quality semantically-aware 3d modeling of complex architecture, in: The International Archives of the Photogrammetry, Remote Sensing and Spatial Information Sciences. Vol. XL-5/W4. pp. 367–374.
Remondino, F., 2011. Heritage recording and 3D modeling with photogrammetry and 3D scanning. Remote Sensing Vol. 3, pp. 1104–1138.
Roca, D., Laguela, S., Diaz-Vilarino, L., Armesto, J., Arias, P., 2013. Low-cost aerial unit for outdoor inspection of building façades. Automation in Construction Vol. 36, pp. 128–135. Rusu, R.B., Blodow, N., Beetz, M., 2009. Fast Point Feature Histograms (FPFH) for 3D registration, in: Proceedings of 2009 IEEE International Conference on Robotics and Automation. pp. 3212–3217.
Rusu, R.B., Cousins, S., 2011. 3D is here: point cloud library, in: Proceedings of IEEE International Conference on Robotics and Automation. IEEE, Shanghai, pp. 1–4.
Schuhmacher, S., Böhm, J., 2005. Georeferencing of Terrestrial Laserscanner Data for Applications in Architectural Modelling, in: Proceedings of 3D-ARCH 2005: Virtual Reconstruction and Visualization of Complex Architectures. p. 7.
Sharon, Y., Wright, J., Ma, Y., 2009. Minimum sum of distances estimator: Robustness and stability, in: Proceedings of the American Control Conference. pp. 524–530.
Tombari, F., Salti, S., Di Stefano, L., 2010. Unique signatures of histograms for local surface description, in: Daniilidis, K., Maragos, P., Paragios, N. (Eds.), ECCV 2010, Part III, LNCS 6313. Springer Berlin Heidelberg, Heraklion, Greece, pp. 356– 369.
Weinmann, M., 2016. Preliminaries of 3D Point Cloud Processing, in: Proceedings of Reconstruction and Analysis of 3D Scenes: From Irregularly Distributed 3D Points to Object Classes. Springer, pp. 17–38.
Wolf, P., DeWitt, B., Wilkinson, B., 2014. Elements of Photogrammetry with Applications in GIS, 4th ed. McGraw-Hill Education.
The International Archives of the Photogrammetry, Remote Sensing and Spatial Information Sciences, Volume XLII-2, 2018 ISPRS TC II Mid-term Symposium “Towards Photogrammetry 2020”, 4–7 June 2018, Riva del Garda, Italy