Publisher’s version / Version de l'éditeur:
Vous avez des questions? Nous pouvons vous aider. Pour communiquer directement avec un auteur, consultez la première page de la revue dans laquelle son article a été publié afin de trouver ses coordonnées. Si vous n’arrivez pas à les repérer, communiquez avec nous à [email protected].
Questions? Contact the NRC Publications Archive team at
[email protected]. If you wish to email the authors directly, please see the first page of the publication for their contact information.
https://publications-cnrc.canada.ca/fra/droits
L’accès à ce site Web et l’utilisation de son contenu sont assujettis aux conditions présentées dans le site LISEZ CES CONDITIONS ATTENTIVEMENT AVANT D’UTILISER CE SITE WEB.
American Ceramic Society Bulletin, 57, 5, pp. 493-495, 1978-05
READ THESE TERMS AND CONDITIONS CAREFULLY BEFORE USING THIS WEBSITE. https://nrc-publications.canada.ca/eng/copyright
NRC Publications Archive Record / Notice des Archives des publications du CNRC :
https://nrc-publications.canada.ca/eng/view/object/?id=8810b2c1-ae6b-441e-946b-b5bf774ee722
https://publications-cnrc.canada.ca/fra/voir/objet/?id=8810b2c1-ae6b-441e-946b-b5bf774ee722
NRC Publications Archive
Archives des publications du CNRC
This publication could be one of several versions: author’s original, accepted manuscript or the publisher’s version. / La version de cette publication peut être l’une des suivantes : la version prépublication de l’auteur, la version acceptée du manuscrit ou la version de l’éditeur.
Access and use of this website and the material on it are subject to the Terms and Conditions set forth at
X-ray diffraction method for determining the firing temperature of clay
brick
National Research
Conseil national
CouncilCanada
.
2de
recherches Canada
X-RAY
DIFFRACTION METHOD FOR
DETERMINING THE FIRING TEMPERATURE
OF CLAY BRICK
4 ~ 4 t
by
Patrick
E.
Frattan-Bellew and Gerard G. Litvan
/
,&?.2y
...GaJ_ $ :.$a, 1 bReprinted from
I ~ T I O I I A L P C ~ L A I L n C O U N ~ I LI
American Ceramic Society Bulletin
hVol.
57, No. 5,
M a y
1978
p.
493 495
DBR Paper No. 804
Division of Building Research
Reprinted from the American Ceramic Society Bulletin, Vol. 57, No. 5 May 1978. Copyright 1978 by The American Ceramic Society
X-Ray Diffraction Method for Determining
the Firing Temperature of Clay Brick
PATRICK E. GRATTAN-BELLEW
and
GERARD G. LITVAN*
National Research Council of Canada, Ottawa, Ont.
T h e durability of brick under freeze-thaw conditions is affected by several material properties, notably composition,' firing temperature, porosity, pore shape and pore size di~tribution.~.~ Variation in the composition of the raw mix can be monitored readily by X-ray diffraction or by chemical analysis. For a given clay mix, the characteristics of the pore structure are dependent mainly on the heating regime. No satisfactory method exists, how- ever, for determining the maximum temperature at which the finished product was fired. There appears to be good evidence for the view that, for fairly uniform raw material, if a reliable test method were available, quality control in the brick plant could be reduced to verification that the finished product had been fired at the correct temperature. Such a procedure would prevent the release of production lots of inferior quality.
At present it is difficult to determine accurately the temperature distribution in a kiln because of the high temperatures involved (ili excess of 1000°C). The permissible range is so narrow that, for example, if the optimum firing temperature is 1030°C, a brick fired at 1010°C could be underfired and sus'ceptible to frost damage whereas if it were fired at 1050°C could be an overfired, deformed product. A test to determine the temperature at which the brick was fired could also be used to eliminate temperature differences in the kin.
The shortcomings of the presently used "saturation coefficient test" were discussed in a previous publication4 and a new method of testing, based on the determination of the BET nitrogen area (which is a unique function of the firing temperature) was proposed. In the present paper, another new method based on X-ray diffraction analysis is described.
Principles of the Proposed Test Method
The mineralogical composition of brick clays changes during firing. The first change to occur as the temperature rises is the loss of water from the clay minerals and other hydroxides. This change is followed by decomposition of the carbonates, with loss of CO,. At higher temperatures, various phases interact to produce new crystal- line minerals and a liquid that, during cooling, solidifies as a glass. Most fired clay bricks consist of a mixture of crystalline and glassy phases. The mineralogical changes that occur during heating of brick clays may be monitored by X-ray diffraction. At the outset of the present study, the hypothesis that unambiguous relations exist between temperature and mineralogical composition was adopted. This hypothesis was tested on a clay originating in southern Ontario, Canada.
Phase Transitions in the SiO, System
Quartz, one component of the brick clays, should transform to tridymite at 870°C,5 but because this reaction is sluggish, quartz persists above its theoretical stability range unless a suitable mineralizer, e.g. water or sodium tungstenate, is present. No tridy-
I
member, the American Ceramic Society.Study of the X-ray diffractograms of fired
samples of a brick clay revealed that the ratio
of theintensities of quartz reflection at 3.34
A
to that of labradorite reflection at 3.2
A
is a
linear function of the temperature at which
the samples have been fired. This relation
can be used to estimate the firing tempera-
ture of a particular brick, with standard devia-
tion of
7.75"C.
The method described can be
valuable in assessing freeze-thaw resis-
tance of brick and in detecting temperature
gradients in kilns.
mite was detected in any of the brick samples when they were quenched rapidly from 1015°C to room temperature, a procedure that was designed to preserve any tridymite present at the high temperature. Above 1470°C, cristobalite is the stable phase of the SiO, system, but it is frequently stabilized at 1000°C by the presence of impurity ions in the s t r ~ c t u r e . ~ A weak peak, corresponding to the strongest cristobalite X-ray reflection, was observed at 4.05
A in
samples fired to>
1005°C.Experimental
A commercially fabricated unfired red clay brick, brick A, made of Queenston shale, was obtained. The main constituent of Queenston shale is a mixture of illite and ~ h l o r i t e . ~ It also contains 33% quartz, 10% calcite and 3% feldspar.
A small fragment of the brick was ground under accetone to achieve good homogeneity. Samples (50 mg each) were fired to various temperatures in the two Pt sample holders of a ther- moanalyzer,* the thermocouple of which was calibrated at the melting point of gold (1063°C). The temperature range from 990" to 1055°C was explored in the present study because SEM examina- tion indicated this to be the pertinent range.
Because firing schedules of the kilns in brick plants do not permit completion of all the reactions and transformations in the mix, metastable phases may, and usually do, exist in the fired clay. For this reason it is important to simulate the firing regime of the kiln in laboratory experiments. Accordingly, the selected firing tempera- ture maintained (within k4"C) for 20 h was preceded and followed by 8-h heating and cooling periods. Thus the complete cycle lasted 36 h. It should be noted that increasing the cycle time to 66 h yielded samples with X-ray reflection intensities similar to those of samples in the standard 36-h schedule that had been fired at temperatures 5"- 10°C higher.
After being cooled, the fired samples were ground under acetone in a ball mill (mixer millr with agate vials and balls) for 3 min, then dried. Thirty milligrams of the sample were uniformly dispersed on a cover glass which served as a sample holder in the X-ray diffrac- tometer. From a preliminary study of X-ray diffractogram? made on brick clay samples fired at various temperatures, the (1 010) quartz reflection at 3.34 A and the (040) reflection from laboradorite at 3.2
A
were selected for intensity determination.The main source of uncertainty in the determination of X-ray intensities with the laboratory apparatus has been the fluctuations of the primary X-ray beam intensity, which can vary by 2 7% over a
SILICON P W K 2 8 . 3 3 - 2 8 . 4 0 ° 28 QUARTZ PEAK 2 6 . 5 8 - 2 6 . 6 5 ° 2 8 0 0 9 8 6 4 0 0 9 6 6 9 ... ... QUARTZ BACKGROUND 2 5 . 4 0 - 2 5 . 5 0 - 28 0 4 1 3 0 2 0 0 1 3 4 2 0 0 1 2 9 7 0 0 1 2 7 3 0 0 1 1 9 3 - ... IABRhDORITE PEAK 2 7 . 7 9 - 2 7 . 8 8 ' 20 SILICON P W ( 2 8 . 3 1 - 2 8 . L 0 ° 28 SILICON P M 2 8 . 3 1 - 2 8 . 6 0 ° 28
P
... 9UARTZ PEAK 2 6 . 5 8 - 2 6 . 6 5 ' 2 8 QUARTZ BACKGROUND 2 5 . 4 0 - 2 5 - 5 0 ' 28 LABUDORITT PEAK 2 1 . 7 9 - 2 7 . 8 8 ' 28 UBRhDORlTL BACKGROUND 2 8 . 1 0 - 2 8 . 8 0 ° 28 0 0 0 9 0 5 0 0 0 8 8 1 0 0 0 8 8 4 0 0 0 9 0 0 0 0 0 9 0 5 ... ... SILICON PEAK 2 8 . 3 3 - 2 8 . 4 0 ° 28Fig. 1. Printout of X-ray diffraction procedure used to determine intensities of quartz (10i0) and labradorite (040) reflections. The diffractometer step scanned acros the 20 interval indicated, and counts were made for 10 s at each step. The number of counts recorded at each step is given in the column of figures; the step interval was 0.01" 28 .The table shows the sequence in which the measurements were done.
period of four days. The method used to determine the intensity of the quartz and labradorite reflections was designed to minimize the effects of the intensity fluctuations. It consisted of 1) selecting a range of 20 of maximum but constant intensity and 2) step scanning across the selected range with a step interval of 0.01" 20.
At each step, counts were taken for 10 s and the average for the period was calculated. The intensity of the background which is subtracted from the peak intensity was determined by repeating the foregoing procedure in the vicinity of the quartz or labradorite peak in a region of the spectrum free from any reflections. Before and after each set of quartz and labradorite determinations, the intensity of an external silicon standard was determined in the same manner. If the average intensity of the silicon reflections differed from the mean obtained in a separate experiment, the quartz and labradorite intensities were adjusted appropriately. Any other accurate method of peak intensity determination could also be used. In the separate experiment mentioned before, the mean intensity of the silicon standard was determined from continuous measurements lasting for four days. The procedure used to determine the quartz and labrado- rite intensities is outlined in Fig. 1. An external standard was selected in preference to an internal one to avoid dilution of the 30-mg samples. The same procedure was used by Gleitzer et al. in their study of the X-ray analysis of the refractorie~.~
Precision of the Determined X-Ray Intensities
The observed intensities of the quartz and labradorite reflections depend primarily on the concentrations of these constituents. The concentrations, in turn, are a function of the temperature and,
l ~ l ~ l ~ l ] l ~ l
-
0 POINTS DETERMINED-
I N O R I G I N A L SERIES - OF FIRINGS POINTS DETERMINED I N REPEAT SERIES OF FIRINGS-
-
-
-
-
-
-
-
-
L l l l l l l l l L l l l l
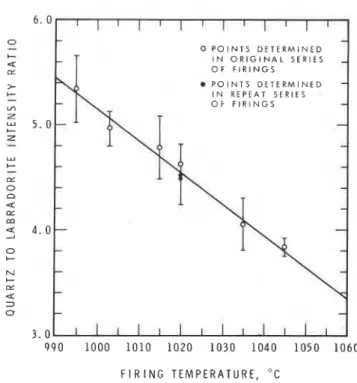
F I R I N G T E M P E R A T U R E , "CFig. 2. Plot of ratio of intensity of (1 070) quartz reflection to intensity
of (040) labradorite reflection vs firing temperature for red clay brick A
from Queenston formation, southern Ontario. Regression line was fitted by the method of least squares; correlation coefficient is - 0.994. Bars on either side of points indicate 1 standard deviation from mean.
therefore, even undetectably small deviations from the nominal firing temperature may affect the intensities. Fluctuations in the primary X-ray beam and instability of the detector can also cause intensity variations. The stability of the X-ray detector system was checked by using a "Fe source to replace the generator, thus eliminating beam intensity fluctuations. The standard deviation from the mean value, over a period of one day, was 1.6%.
Intensities are sensitive to the manner in which the sample is prepared for XRD. For this reason, a standard sample-preparation procedure was adopted. Thirty milligrams of the fired sample were ground under acetone for three minutes in a ball mill and then sedimented onto a cover glass which s e w e t a s the sample mount on the diffractometer. The intensitv of the (1010) quartz reflection was measured repeatedly on a sample of bri'ck that was remounted four times. The standard deviation from the mean of the four intensities was 3.5%. Because this value was essentially the same as the standard deviation of the mean measured on the silicon reference material, it is concluded that the mounting procedure was satisfac- torily standardized.
The intensities of the (1070) quartz reflections of four samples of brick clay fired at a nominal 1020°C in separate runs were deter- mined and the standard deviation from the mean of the four values was 6.6%. The 3-percentage-point increase of the standard devia- tion over that obtained with the silicon standard is probably caused by differences in the temperature at which the four samples were fired. Because of lack of precision in the temperature recorder, it was not possible to determine the average temperature over the 20-h firing period with an accuracy better than ? 4%"C.
Results
When heated above =85O0C, clays of the Queenston formation break down and react with other minerals to form a feldspar phase, which was tentatively identified as labradorite. Labradorite has a composition in the range 50-30% Na AlSi,O, and 50-70% Ca Al,Si,O,. The amount of quartz present in the fired product varies with temperature. At some temperatures quartz is used in the reac- tion to produce labradorite. At others, SiO, is in excess and crystal- lizes as quartz with possibly a little crystobalite. At temperatures
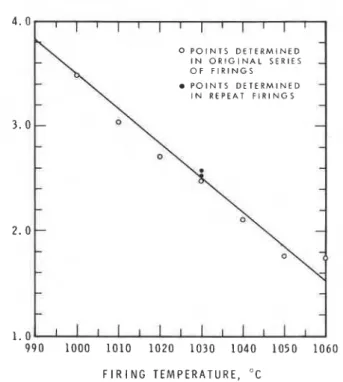
FIRING T E M P E R A T U R E , " C
Fig. 3. Plot of ratio of intensity of (1 0i0) quartz reflection to intensity of (040) labradorite reflection vs firing temperature for red clay brick B from Queenston formation. Regression line was fitted by the method of least squares; correlation coefficient is - 0.9840.
above 990°C, a liquid phase is formed; during cooling, this sol- idifies as a glass. Due to the complexity of the reactions, no simple relation was found between the intensities of the X-ray reflections of either quartz or labradorite, and the firing temperature. However, at several temperatures, when the intensity of the quartz peak was divided by that of the labradorite peak and the ratios plotted as a function of firing temperature, a straight-line relation was found (Fig. 2).
Each point plotted on Fig. 2 represents the average of four
intensity determinations. At each selected temperature, two sam- ples were fired simultaneously in the furnace and each specimen was run twice on the X-ray diffractometer. The standard deviation for each point is also given. The average standard deviation of the points from the regression line is 7.75"C. If more samples from the same clay had been run, the confidence limits of the fitted line would, of course, be improved. The reproducibility of the results was checked by firing two additional samples at 1020°C. The ratios obtained for these are also shown in Fig. 2; one falls on the regres- sion line, the other 2.5" off it.
The proposed method for determining the firing temperature of brick was testedon a brickclay, B,originating from another pit. The clay was fired at a series of temperatures between 990" and 1060°C. The quartz and labradorite X-ray intensities were determined and the ratios plotted vs firing temperature on Fig. 3. A regression line was fitted to the points using the least-squares method, and the
correlation coefficient was - 0.984, indicating a good fit. As a
check on the reproducibility of the results, two additional samples
were fired at 1030°C, the results from these two samples are also
shown in Fig. 3. The determined points are near the regression line, the farthest being two degrees off.
Conclusions
A linear relation exists between the ratio of the X-ray reflection intensities of quartz and labradorite and the temperature at which a Queenston shale brick was fired. This relation can be used for estimating the temperature at which a particular brick fabricated from this shale was fired. Although the method is perhaps impracti- cal for quality control purposes in a plant, it can be used to advan- tage in trouble-shooting and research. Undoubtedly, the standard
VOL.
57,
No.5 (1978)
Patrick E. Grattan-Bellew Gerald G. Litvan
Patrick E. Grattan-Bellew is a research officer in materials
science, Div. of Building Research, National Research Coun- cil, Ottawa, Ont., Canada. He obtained his B.Sc. in chemistry and geology from University College, Dublin, Ireland, in 1957, his M.Sc. in mineralogy from McGill University, Canada, in 1963 and his Ph.D. in mineralogy from the University of Cam- bridge, England, in 1969. Dr. Grattan-Bellew worked as an exploration geologist in southwest Africa during 1957-61, in west Africa during 1963-65 and in Canada during 1969-71. With the National Research Council since 1971, his main research interest is alkali reactivity in concrete.
Gerald G. Litvan has been a research officer, Materials
Section, Div. of Building Research at the National Research Council since 1962. He received his B.Sc. in chemistry from Eotvos University, Hungary, in 1952 and his Ph.D. in surface chemistry from the University of Toronto, Canada, in 1962. Dr. Litvan was assistant professor at Eotvos during 1952-55; re- search associate at the Central Chemical Research Institute of the Hungarian Academy of Sciences during 1956; and
research chemist for Canadian Industries Ltd. during 1957- 59. He has been concerned with surface chemistry of porous solids and behavior of absorbates and temperatures below their bulk freezing point.
deviation can be reduced significantly by using a larger number of samples. The described method could be a valuable tool in efforts to eliminate temperature differences in kilns.
Acknowledgment
The authors are indebted to P. J. Lefebvre for his careful determi-
nation of the X-ray intensities which were used in this paper and to Mrs. K. K. Karpati for assistance in the statistical analysis. This paper is a contribution from the Division of Building Research, National Research Council of Canada, and is published with the approval of the Director of the Division.
References
'
Gerhard Piltz, "Investigation of the Relationship Between Raw Materials and Frost Resistance," Ziegelind., 24 [Ill 474-88 (1971).The Resistance of Tile to Frost, Publication No. 6. Federation of Brick and Tile Manufacturers, Paris, 1959.
H. G. F. Winkler, "Problem of Frost Resistance of Roofing Tile," Err. Deur.
Keram. G r s . , 36 [lo] 327-32 (1959).
G. G. Litvan, "Testing the Fmst Susceptibility of Brick, Masonry: Past and Present," ASTM S w c . Tech. Publ. No. 589. 7
..
DD. 123-32. American Societv -- --~-J -for - - - ~Testing and ~ a t e r i h s , Philadelphia, Pa.
C. N. Fenner, "Stability Relations of Silica Minerals," Am. J. Sci., 4th Ser., 36
[214] 331-84 (1913).
V. G. HiB and Rustum Roy, "Silicate Structure Studies: VI." Trans. Br. Ceram.
Soc., 57 (81 496-510 (1958).
'
G. R. Guillet, "The Clay Products lndustry of Ontario," Industrial Mineral Report No. 22. Ontario D e ~ t . of Mines. Ottawa. 1967.a ~ h : ~ l e i t z e r , ~.'~ourrier, ~ . ' ~ o i r s o n k d J . C. Goudaoueu, "Use of Quantitative X-Ray Crystallographic Analysis in the Study of Refractories," Trans. J. Br. Ceram.
Soc., 75 [3] 61-67 (1976).