Chirped-pulse millimeter-wave spectroscopy for
dynamics and kinetics studies of pyrolysis reactions
The MIT Faculty has made this article openly available. Please share
how this access benefits you. Your story matters.
Citation Prozument, Kirill, et al. “Chirped-Pulse Millimeter-Wave
Spectroscopy for Dynamics and Kinetics Studies of Pyrolysis Reactions.” Phys. Chem. Chem. Phys., vol. 16, no. 30, 2014, pp. 15739–51.
As Published http://dx.doi.org/10.1039/c3cp55352c
Publisher Royal Society of Chemistry (RSC)
Version Author's final manuscript
Citable link http://hdl.handle.net/1721.1/114506
Terms of Use Creative Commons Attribution-Noncommercial-Share Alike
1
Chirped-pulse millimeter-wave spectroscopy for dynamics
and kinetics studies of pyrolysis reactions
Kirill Prozument
1), 2), G. Barratt Park
1), Rachel G. Shaver
1),
AnGayle K. Vasiliou
3), James M. Oldham
2), Donald E. David
4),
John S. Muenter
5), John F. Stanton
6), Arthur G. Suits
2),
G. Barney Ellison
4), and Robert W. Field
1)1) Department of Chemistry, Massachusetts Institute of Technology, 77 Massachusetts Ave,
Cambridge, MA 02139
2) Department of Chemistry, Wayne State University, 5101 Cass Ave, Detroit, MI 48202 3) Department of Chemistry and Biochemistry, Middlebury College, 276 Bicentennial Way,
Middlebury, VT 05753
4) Department of Chemistry and Biochemistry, University of Colorado at Boulder, Cristol
Chemistry 58, Boulder, CO 80309
5) Department of Chemistry, University of Rochester, 120 Trustee Road, Rochester, NY
14627
6) Department of Chemistry, The University of Texas at Austin, 1 University Station A5300,
Austin, TX 78712-0165
28 March 2014
Keywords: millimeter wave spectroscopy, microwave spectroscopy, broadband rotational
spectroscopy, chirped pulse, free induction decay, fast passage, flash pyrolysis, branching, concentration of reaction products, kinetics, dynamics, thermal decomposition, ethyl nitrite, CH3CH2ONO, C2H5ONO, methyl nitrite, CH3ONO, formaldehyde, acetaldehyde, nitroxyl,
H2CO, CH2O, CH3CHO, HNO, multi-chirp, Chen nozzle, pulsed valve, tubular reactor,
vibrational relaxation, collisional cooling, vibrational temperature, vibrational population distribution, rotational temperature, Coriolis interaction, ortho, para, nuclear spin statistics.
2
Abstract
A Chirped-Pulse millimeter-Wave (CPmmW) spectrometer is applied to the study of chemical reaction products that result from pyrolysis in a Chen nozzle heated to 1000 – 1800 K. Millimeter-wave rotational spectroscopy unambiguously determines, for each polar reaction product, the species, the conformers, relative concentrations, conversion percentage from precursor to each product, and, in some cases, vibrational state population distributions. A chirped-pulse spectrometer can, within the frequency range of a single chirp, sample spectral regions of up to ~10 GHz and simultaneously detect many reaction products. Here we introduce a modification to the CPmmW technique in which multiple chirps of different spectral content are applied to a molecular beam pulse that contains the pyrolysis reaction products. This technique allows for controlled allocation of its sensitivity to specific molecular transitions and effectively doubles the bandwidth of the spectrometer. As an example, the pyrolysis reaction of ethyl nitrite, CH3CH2ONO, is studied at different
temperatures of the Chen reactor, and CH3CHO, H2CO, and HNO products are
simultaneously observed, exploiting the multi-chirp CPmmW technique. Rotational and vibrational temperatures of some product molecules are determined. Subsequent to supersonic expansion from the heated nozzle, acetaldehyde molecules display a rotational temperature of 4 ± 1 K. Vibrational temperatures are found to be controlled by the collisional cooling in the expansion, and to be both species- and vibrational mode-dependent. Rotational transitions of vibrationally excited formaldehyde in levels ν4, 2ν4, 3ν4, ν2, ν3, and ν6 are
observed and effective vibrational temperatures for modes 2, 3, 4, and 6 are determined and discussed.
Introduction
Pyrolysis, which is the thermal decomposition of molecules in the absence of oxygen, has both scientific [1-16] and industrial [17-19] applications. In flash pyrolysis jet experiments, the molecules undergo thermal decomposition as they pass through the heated nozzle. The subsequent supersonic expansion into vacuum results in rotational cooling [3, 8, 11, 16] of the products that simplifies spectral assignment and improves the sensitivity of a rotational spectroscopy [1, 5] experiment. Isolated in a molecular beam, reactive molecules and radicals, that may be important in atmospheric or interstellar chemistry, or are intermediates in combustion or pyrolysis applications, become available for spectroscopic studies [1-15]. A version of the pyrolysis nozzle designed by Chen et al [2, 6] has become a
3
widely used instrument for laboratory studies of the products of pyrolysis reactions. Recently, the mechanisms of chemical reactions inside the flash pyrolysis reactor were investigated in the research group of G. B. Ellison. [13-15]
Quantifying concentrations of reaction products is important for understanding dynamics and kinetics in a pyrolysis reactor, but is also a challenging task. In the last decade there has been significant advances in quantifying photolysis [20-22] and pyrolysis [15] reaction products in a molecular beam using photoionization mass spectrometry (PIMS) that employs tunable VUV radiation from a synchrotron [23, 24]. The photoionization efficiency (PIE) dependence on the photon energy helps to distinguish between isomers and species with the same mass-to-charge ratio, which is not possible in PIMS experiments that use a fixed frequency laser for ionization. The universality of the tunable VUV PIMS method for chemical dynamics and kinetics studies depends on the availability of the reference PIE curves for each reaction product, which must be measured in carefully crafted experiments [25, 26]. Features that may complicate understanding and quantifying PIMS results are dissociative photoionization of neutral reaction products and photodissociation of ions. The availability of synchrotron beamline time must be considered as well. A promising alternative ionization method, strong-field ionization by femtosecond laser pulses, was recently demonstrated [27]. Although similar issues of photo-induced dissociation must be considered, the technique is conveniently lab-based.
Chirped-pulse Fourier transform microwave (CP-FTMW) spectroscopy, pioneered by Brooks Pate and coworkers [28-33] is transforming microwave spectroscopy and advancing into the millimeter-wave and THz regions [31, 33-35]. Spectral regions as broad as ~10 GHz are covered in a single chirped pulse with high resolution (~100 kHz) and meaningful relative transition intensities. Due to its ~1 part per million spectral resolution, pure rotational spectroscopy has exceptional precision for determining the structures of molecules and
4
radicals [36]. Chirped-pulse (CP) rotational spectroscopy retains the advantages of traditional narrowband rotational spectroscopy: unambiguous assignment of molecules and radicals, distinguishing conformers and even enantiomers [37], vibrational states, and fine and hyperfine states. The elegant study [38] of isomerization dynamics by Pate and coworkers is the first example of how the broadband feature of the chirped-pulse technique may be applied to studying chemistry. In their experiments, rotational transitions of two molecular conformers of cyclopropane carboxaldehyde, separated by several GHz, are detected simultaneously. As the conformers are laser-prepared in different “zero-order” vibrational states near the energy of the isomerization barrier, the observed rotational line intensity is being redistributed and shifted, reflecting the degree of mixing of the conformers’ wavefunctions, or, equivalently, the rate of isomerization. Simultaneous and rapid acquisition of spectra extending over a broad spectral range is essential for the feasibility of these experiments. The traditional Balle-Flygare Fourier transform microwave spectrometer [5, 7, 39, 40], the most advanced pre-chirped-pulse microwave spectrometer, is intrinsically a narrow bandwidth instrument, which uses a high-Q cavity to achieve maximal signal-to-noise (S/N) ratio. The high-Q cavity must be mechanically adjusted to maintain the cavity enhancement of the microwave field, in order to scan successive ~1 MHz spectral intervals. Due to unavoidable fluctuations in experimental conditions, reliable comparisons of line intensities separated by several GHz in a scanning rotational experiment with sub-MHz resolution can be a challenging task.
In a CP experiment, the arbitrary waveform generator (AWG) generates microwave chirps that sweep the entire frequency range of interest in ≲ 1 μs. Rotational transitions in molecules and radicals that fall into the chosen frequency range are polarized by the chirped pulse with a linear in time frequency sweep and undergo free induction decay (FID), which is digitized in the time-domain by the fast oscilloscope. The Fourier-image of the recorded FID
5
is the spectrum of the molecular sample in the entire region. All transitions are affected equally by possible shot-to-shot fluctuations introduced by a pulsed molecular beam source or by slow changes in experimental conditions. Transitions that belong to multiple species can be recorded simultaneously with meaningful relative intensities and can be converted to branching of reaction products.
Another fundamental advantage of CP spectrometers compared to a traditional narrow-band apparatus, is the more efficient excitation of rotational transitions by a chirped pulse when broad spectral ranges are considered.[28] Unlike with transform-limited (TL) single-frequency excitation, the bandwidth of a frequency-chirped excitation, Δν, is decoupled from its duration. For example, a Δν = 10 GHz chirp can have a duration of 1 μs (or longer), whereas a TL pulse of the same bandwidth must be as short as ~ 1 ns, thus severely limiting the amount of energy from that pulse that is available for polarizing molecular transitions. Treatment of fast passage excitation in the weak-field limit by McGurk et al [41, 42] [Footnote: for more discussion of this topic, see the Chapter by Shoemaker [43], CP papers by the Pate [28], Schnell [44] and Field [35] research groups, and the book by Akulin and Karlov [45] for an overview of semiclassical treatment of light-matter interactions], which is appropriate for most rotational CP experiments, shows that the induced polarization (and thus the FID signal strength) is proportional to 1/√∆𝜈 (Eq. 4), which is a more favorable scaling, especially for large bandwidth excitations, than the 1/Δ𝜈 dependence with TL pulses. A remarkable illustration of the efficiency of chirped-pulse excitation combined with broadband detection is given by Dian et al [38]: in the coalescence experiment discussed above, measurements that took 52 hours using the CP-FTMW technique would require 27 years to complete with the traditional cavity-FTMW spectrometer! For the current status of the research with broadband CP spectroscopy, the
6
reader is referred to the recent review by M. Schnell [46] and the special issue of the Journal of Molecular Spectroscopy [47].
In the present work we introduce broadband chirped-pulse rotational spectroscopy for studies of dynamics and kinetics in a flash pyrolysis reactor. We demonstrate that chirped-pulse spectroscopy is a nearly universal tool for simultaneous and quantitative detection of multiple reaction products. The deduced product branching can be compared with results of computer modeling to attain an understanding of kinetics and dynamics of underlying chemical reactions. We optimized the excitation of multiple species by introducing the multi-chirp approach, in which a series of relatively narrowband multi-chirps excite known molecular rotational transitions. The bandwidth of the chirps is reduced to take full advantage of the limited power of solid state amplifiers in the millimeter-wave range, but at the same time the bandwidth is made sufficiently broad for the excitation to remain in the weak-field limit and to avoid saturation. Excitation with multiple narrowband chirps thus achieves the optimal FID signal for the given hardware and permits a straightforward interpretation of the observed transition intensities.
In other series of experiments, which are described in this Perspective, broadband chirped excitation is utilized to locate rotational transitions that belong to vibrationally excited molecules. The intensities of those lines sample the vibrational population distribution in the molecules following adiabatic cooling in the jet, and are rationalized in terms of intramolecular energy flow induced by collisions with rare gas atoms. It is important that in both types of experiment, we apply broadband FID detection and obtain meaningful relative intensities of rotational transitions, which can be quantified to obtain reaction product branching and vibrational population distribution.
7
The approach of quantifying reaction product ratios, with isomer- and quantum state- selectivity, using CP rotational spectroscopy can be extended beyond studies of pyrolysis reactions. Detailed understanding of elementary chemical reactivity can be gained in a CP experiment, in which a chemical reaction is initiated by the laser excitation. The nascent vibrational population distribution in products of unimolecular photo-decomposition was recently observed in a CPmmW study and proposed as an additional tool for understanding the transition state(s) properties [48]. In such an experiment, a balance must be struck to ensure that there are sufficient post-photolysis collisions in the beam in order to equilibrate all product molecules at a lower rotational temperature, but not so many as would cause secondary reactions and would corrupt the nascent vibrational state distributions. Another approach could be to initiate and study complex chemistry in a cold beam. Experiments are under way in the Suits group to apply CP spectroscopy to dynamics and kinetics studies in a well-characterized pulsed uniform supersonic flow [49] obtained with the Laval nozzle.
Our choice of the millimeter-wave (mm-wave) spectral region for the present experiments is dictated by the type of chemistry we have chosen to study. When investigating the mechanisms of chemical reactions in relatively small organic molecules, it is often desirable to monitor small, two-heavy-atom products such as H2CO, HNO, HCN, HNC,
HCO, methoxy, HO2, vinylidene [50], C2H, and their isotopologues. In a cold (T = 4 K, kT/hc
= 3 cm-1) molecular beam, these molecules have their most intense J = 1 – 0 rotational
transitions in the mm-wave region (60 – 100 GHz). Rotational transitions with J = 4 – 3 and J = 7 – 6 of larger, three- and four-heavy-atom molecules, such as CH3CHO, CH2CO and
CH3COCH3, occur in this spectral region as well. Chirped-Pulse millimeter-Wave (CPmmW)
spectroscopy, developed recently in the Field group [35, 48, 51, 52] as part of a collaboration with the Pate group, is an extension of the CP-FTMW technique to the mm-wave region. In the present paper we describe how the CPmmW spectrometer can be of transformative value
8
in studies of pyrolysis dynamics and kinetics, further enhanced by the multi-chirp scheme that is described here.
CPmmW pyrolysis experimental setup
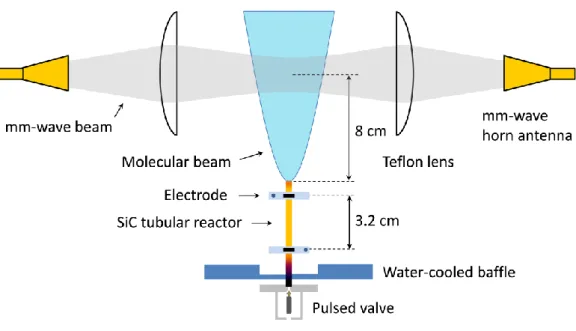
The Chen nozzle was manufactured in the University of Colorado at Boulder machine shop and is a modified version of the nozzle used by the Ellison group [10]. Figure 1 shows the schematics of the nozzle and the spectrometer of the Field group CPmmW pyrolysis experiment. The 5.7 cm long, 1 mm inner diameter silicon carbide (SiC) tube (Saint-Gobain Ceramics, Hexoloy SE), the “tubular reactor”, is inserted into a counterbore in the faceplate of the pulsed valve (General Valve, Series 9). Two carbon discs with Molybdenum electrodes connect the SiC tube to the electrical current supply that resistively heats the 3.2 cm section of the tube that is located between the two electrodes. The temperature of the outer wall of the SiC tube, which is indicative of (but not necessarily equal to) the temperature inside the reactor, is measured by an optical pyrometer (Leeds & Northrup 8632-C) in the Twall = 1000 –
1800 K range. A water-cooled baffle provides support for the SiC tube and isolates the pulsed valve from thermal radiation emitted by the hot SiC tube. The gap between the baffle and the faceplate of the valve serves as an additional thermal isolation protecting the valve. At a 20 Hz gas pulse repetition rate and a stagnation pressure in the valve of p0 = 3 bar, the pressure
in the chamber, maintained by a 2400 ℓ/s turbomolecular pump (Osaka TG2400MBWC), is 2.5 × 10⁻⁵ mbar.
Ethyl nitrite was synthesized by adding hydrochloric acid to a solution of NaNO2 (6
g) and ethanol (8 ml) in 25 ml of water. The ethyl nitrite vapor was condensed at −78 °C and then mixed with argon carrier gas in a sample cylinder. A mixture was made to contain 0.1% CH3CH2ONO and 99.9% Ar (by mole).
9
Figure 1. Schematic of the experimental setup. A pulsed valve and the attached SiC tube (tubular reactor) are mounted inside the vacuum chamber. The part of the reactor located between the two electrodes can be resistively heated to Twall = 1000 – 1800 K. A water-cooled copper baffle disk isolates the valve from the hot part of the SiC tube. Precursor molecules entrained in a carrier gas are introduced to the tubular reactor where flash pyrolysis reactions take place. The reaction products emerge from the SiC reactor and expand supersonically into the vacuum chamber. The molecules are cooled during the adiabatic expansion to about 4 K rotational temperature and can be studied by rotational spectroscopy. The millimeter-wave beam of the CPmmW spectrometer, shaped by two Teflon lenses, crosses the gas jet in the collision-free region of the expansion.
The CPmmW spectrometer is described in detail by Park et al [35]. Here we provide an overview of the spectrometer with some modifications, and describe its adaptation to the flash pyrolysis source. The Tektronix AWG7082C arbitrary wave generator, operating at 8 Gsamples/s rate, forms chirped pulses that are mixed with a 10.7 GHz Miteq PLDRO fixed-frequency phase-locked oscillator. The resultant difference fixed-frequency is put through a bandpass filter, multiplied by 8 in an active multiplier chain with +13 dBm (20 mW) output power, and broadcast from a pyramidal horn antenna. A direct reading precision attenuator (60 dB maximum attenuation) is introduced between the multiplier chain and the horn antenna for intensity calibration purposes.
10
As shown in Fig. 1, a Teflon lens (50 cm focal length at 500 GHz, 15 cm diameter, custom constructed by Thorlabs) loosely focuses the millimeter-wave (mm-wave) beam to a 3 – 5 cm diameter spot at the center of the chamber, 8 cm downstream from the tip of the SiC tube, where it intercepts the molecular beam generated by the pyrolysis nozzle in its post-expansion collision-free zone. The molecular beam is not skimmed in order to maintain a total number of molecules in the mm-wave irradiated volume (~100 cm3) that is optimal for our CPmmW experiment. The number density of HNO molecules (which corresponds to the spectrum shown in Fig. 3(d)) in that interaction region is about 1012 cm-3 (Twall = 1500 K). A
second Teflon lens and horn antenna collects the FID from molecules in the interaction region. The FID is then mixed with the 77.51 GHz mm-wave output of a phase-locked Gunn oscillator. The difference frequency is amplified by a low noise amplifier (Miteq AMF-7D-00101800-24-10P, 55 dB gain) and recorded by the Tektronix DPO70804C fast digital oscilloscope (8 GHz, 25 GSamples/s). In this experimental setup the Gunn oscillator is locked to the 8th harmonic of 9.6875 GHz, which is obtained by mixing the output of the
second channel of the AWG, running continuously at a fixed frequency of 1.025 GHz, and the 10.7 GHz phase-locked oscillator that is simultaneously utilized by the upconversion arm of the spectrometer [33]. Using an AWG output allows choice of a downconversion mm-wave frequency that is conveniently situated with respect to the transitions of the molecular products. Accurately maintaining the relative phases of the FIDs generated by successive chirped pulses is necessary for averaging. We have determined that the phase-locked oscillators are the primary source of phase instability. To reduce their phase drift, the oscillators are water cooled to 15 ± 0.1 ºC and isolated from lab air convection.
11
Multi-chirp technique
A major advance in the capabilities of the CPmmW spectrometer exploits the FastFrame™ technology, available in the newer models of Tektronix oscilloscopes, to collect multiple FIDs from a single gas pulse, thereby reducing acquisition time [31]. Pate and coworkers have emphasized [31] the advantages of using the FastFrame™ technology for recording each FID in the sequence without the necessity of averaging them into the “Summary Frame”. The evolution of species populations due to transient processes can be followed by a CP spectrometer in such an acquisition mode.
In addition to multiple repetitions of a simple chirp, the FastFrame™ or an analogous technology may be utilized to produce a sequence of chirps (multi-chirp), with different center-frequencies and bandwidths, during a single molecular beam pulse. This is particularly useful in relatively sparse spectra of product species that have weak signals at known transition frequencies. In addition, a broadband spectrum can be helpful in the initial determination of the reaction product compositions. The multi-chirp approach then may be used to simultaneously obtain higher signal-to-noise ratio (S/N) spectra of several chosen species with meaningful relative intensities that can be converted into their relative concentrations. Since the acquired signal intensity is inversely proportional to the square root of the bandwidth, a bandwidth reduction from 7 GHz to 20 MHz results in an 18-fold signal intensity increase. This is the important point; several narrowband chirps of different spectral content can be used sequentially within one composite chirped pulse sequence to probe multiple reaction product transitions.
The capabilities of the multi-chirp strategy are illustrated here by a study of the pyrolysis of ethyl nitrite, CH3CH2ONO [16, 53-56], in which the H2CO, CH3CHO and HNO
12
that are likely to lead to the observed products (Fig. 2). The precursor CH3CH2ONO has a
relatively weak O–NO bond (about 42 kcal/mol) that readily breaks inside the hot reactor to yield ethoxy, CH3CH2O, and NO radicals.[16, 54, 57] The ethoxy radicals undergo rapid
decomposition to form either (H2CO + CH3) or (CH3CHO + H) products.[16, 58, 59] The
HNO product can be formed by either unimolecular decomposition of the precursor, the CH3CH2ONO → CH3CHO + HNO reaction, or via H abstraction reactions by NO.
Figure 2. Suggested primary reactions in pyrolysis of ethyl nitrite. CH3CH2ONO can undergo single bond fission and decompose to CH3CH2O and NO radicals [16, 54, 57], after which the ethoxy radical rapidly follows one of the dissociation channels [16, 58, 59]: to form the H2CO and H, or CH3CHO and H products. Alternatively, the precursor CH3CH2ONO may undergo unimolecular decomposition to CH3CHO and HNO. Possible secondary reactions are not considered here, but may influence the measured concentrations.
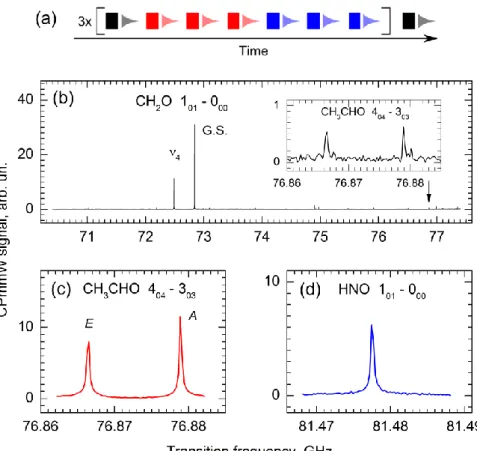
Figure 3 (a) displays a sequence of 22 chirps that is comprised of two kinds of narrowband chirps, each of them targeting a particular product, CH3CHO and HNO, and a
broadband (BB) chirp, which provides an overview of all possible products, including H2CO.
The chirps are separated by 10 μs time intervals and the entire 220 μs sequence overlaps in time with the ~ 500 μs long gas pulse that contains the pyrolysis products. To ensure a uniform sampling of the earlier and the later portions of the gas pulse, the AWG is setup to alternate the kinds of chirps: the pattern 1 × BB + 3 × CH3CHO + 3 × HNO is repeated three
13
Figure 3. CPmmW spectroscopy of CH3CHO, H2CO, and HNO products of CH3CH3ONO pyrolysis using the multi-chirp approach. (a) Example of a multi-chirp sequence. In this sequence, a broadband 7 GHz chirp covering 70.4–77.4 GHz (black) is used in combination with 20 MHz chirps centered on relevant known transitions for CH3CHO [60, 61] (red) and HNO [61, 62] (blue) to study pyrolysis of ethyl nitrite. (b-d) Spectra obtained from use of the chirp sequence in (a). Rotational JKaKc assignments of the transitions are provided. (b)
The broadband chirp, covering 70.4–77.4 GHz, provides an overview of the possible products and contains transitions of formaldehyde in the vibrational ground state (G.S.) and in the ν4 excited state. The insert magnifies the spectral region that contains two acetaldehyde transitions. (c) The narrowband chirp covering the 76.862–76.882 GHz region with the two acetaldehyde transitions that belong to the E and A symmetry ground states of the internal rotor excitation [60, 61]. (d) The narrowband chirp covering the 81.468 – 81.488 GHz region with the HNO transition [61, 62].
Recording and averaging the FIDs in the multi-chirp scheme requires some additional data processing. In this work, a sequence of 4 μs long FIDs that follow each of the 22 chirps is recorded into the fast memory of the Tektronix oscilloscope operating in the FastFrame™ mode. The 50 ms interval between the gas pulses (@ 20 Hz) provides time to transfer that FID sequence from the fast memory to the main memory of the oscilloscope, where it is stored to be averaged, each FID separately, with the sequence of FIDs that result from the next gas pulse. In the example shown in Fig. 3 we have averaged over 10,000 gas pulses,
14
which takes about 10 minutes. Averaging of up to 200,000 gas pulses (3 hours) is practical and has been used to detect weaker signals. After the experiment is completed, the file containing the sequence of 22 averaged FIDs is transferred to a personal computer where the FIDs from each kind of chirp are additionally averaged with each other. The resulting three time-domain FIDs are Fourier-transformed to obtain the frequency-domain spectra shown in Fig. 3(b-d).
In some instances it may be useful to omit the last averaging step and convert each FID in the sequence to a frequency domain spectrum [31]. As mentioned before, this approach can be used to monitor transient processes. We have converted each of the 22 FIDs to spectra and examined the time evolution of the spectral line intensities. The vibrational temperature of H2CO, gauged by its ν4 state effective temperature (see below), decreases
slightly toward the end of the 220 μs portion of the gas pulse. One of a few possible explanations for that is that the SiC tube is cooled by the fast passage of the gas pulse. In this work we are not focusing on modeling the gas flow in the reactor and take advantage of averaging FIDs of the same kind from all parts of the multi-chirp sequence. It is important to note that, for best S/N, averaging in the time-domain followed by Fourier-transformation is superior to Fourier-transformation of the individual FIDs with subsequent averaging in the frequency-domain.
The bandwidth of chirps of a particular kind and their repetition frequency in the sequence can be chosen to attain comparable S/N for all pyrolysis products; thus re-allocation of the spectrometer’s sensitivity between transitions with different intensities is implemented. This multi-chirp scheme further improves the ability of the chirped-pulse technique to simultaneously detect multiple species and to quantify the branching between reaction products. Finally, the chirps may contain frequencies situated both above and below the frequency of the mm-wave local oscillator (77.51 GHz in this experiment) that is used for
15
down-conversion. The HNO line in the 81.468 – 81.488 GHz region and the broadband spectrum of the 70.4 – 77.4 GHz region span more than 11 GHz, yet are obtained using an 8 GHz bandwidth oscilloscope. Aside from the ~200 MHz dead region near the down-conversion frequency, this method effectively doubles the oscilloscope-limited bandwidth available for FID detection.
A noteworthy feature of these spectra is that some species are detected solely from the broadband chirps, namely the formaldehyde product and the remaining ethyl nitrite parent species. Acetaldehyde transitions can also be detected, albeit with S/N of only 4:1 (Fig. 3(b), insert). If the entire chirp sequence consisted of broadband chirps, this acetaldehyde S/N would increase to 19:1. However, excitation of these acetaldehyde transitions by the narrowband chirps of the sequence illustrated by Fig. 3(a) results in the acetaldehyde spectrum (Fig. 3(c)) that has a S/N approaching 100:1. Similarly, the narrowband HNO chirps achieve the high S/N ratio of a known transition (Fig. 3(d)). While the transitions in this example are all sufficiently intense to be detected using broadband chirps, the power of the multi-chirp technique is demonstrated for future detection of transitions of products from minor reaction channels or with weak transition moments.
Rotational temperature
Determination of rotational temperatures is crucial for determining the relative species concentrations in a CPmmW experiment [48]. We use the ratio of intensities of the JKaKc = 404
– 303 transitions to the sum of the 423 – 322 and 422 – 321 transition intensities in acetaldehyde
molecules as a thermometer. The line intensities were corrected for the frequency-dependent profile of the chirp obtained with 40 dB attenuation of the ×8 active frequency multiplier, and matched by a PGOPHER [56] simulation. Acetaldehyde, which is a reaction product of ethyl
16
nitrite pyrolysis, was measured using a chirp sequence that contains the broadband chirps exclusively. Despite the high temperatures in the pyrolysis nozzle, we measure very low rotational temperatures (Trot) of acetaldehyde close to those typically found in supersonic
expansions. We find that Trot = 4 ± 1 K at Twall = 1000 – 1800 K. There is no detectable
difference in Trot when acetaldehyde of 0.1% mole fraction entrained in argon is expanded
from the heated pyrolysis nozzle. At room temperature, Twall = 300 K, acetaldehyde has Trot =
3.5 K. We conclude that molecular rotations of acetaldehyde expanded from this heated Chen nozzle are effectively thermalized to the translational temperature of the carrier gas. This conclusion is consistent with the consensus in the literature [63] that rotational degrees of freedom are cooled efficiently in the supersonic expansion. Indeed, the typical translational temperature of the carrier gas of several Kelvins is close to the energy spacing between the rotational levels of most molecules and efficient relaxation of highly excited rotational levels is possible. We assume that all pyrolysis products thermalize to similar values of Trot. It is
possible, however, that some reactions will result in products with anomalously high rotational excitation. Excess rotational energy may remain in those products, compared to other molecules, even after cooling in the supersonic expansion. The rotational temperature issues are all soluble, once the frequency region covered by the spectrometer is extended, and more than one rotational transition in each product is detected. For example, in the 140 – 150 GHz region formaldehyde molecules have both their J = 2 – 1, K = 0 transition and two J = 2 – 1, K = 1 transitions. Assuming that the J- and K- rotational temperatures are equal, direct measurement of the rotational temperature of formaldehyde and other small, two-heavy-atom, molecules is possible in the 110 – 170 GHz region. Larger molecules, such as acetaldehyde, have their K = 0, 1, 2, 3 transitions in either the present or the extended frequency range configuration. In principle, it is possible to measure several (J + 1) – J transitions to deduce the rotational temperature. However, great care should be taken in calibrating and comparing
17
the line intensities that are spread sufficiently far to require swapping the microwave or the mm-wave components in the spectrometer to measure those lines. An important factor to be considered when choosing the spectral range for the spectrometer is the Boltzmann maximum of the ∆𝑛0 at a given ambient temperature. [31]
Vibrational temperature
Vibrations are known to be generally more resistant to thermalization in the supersonic expansion than rotational excitations [64-67]. CPmmW spectroscopy makes it possible to detect rotational transitions, with meaningful relative intensities, that belong to molecules in different vibrational levels [48]. Thus, the vibrational population distribution (VPD) can be inferred. In the present work we compare the VPDs of OCS, H2CO, and
CH3CHO molecules that exit the pyrolysis nozzle. They illustrate the unique use of rotational
spectroscopy as a measure of vibrational populations.
OCS
By expanding the mixture of 3% OCS in argon from the heated reactor we have observed the J = 6 – 5 rotational transitions [68] that belong to the following vibrational states of OCS: (1, 0, 0), (1, 11e, 0), (1, 11f, 0), G.S., (0, 11e, 0), (0, 11f, 0), (0, 20, 0), and two
pairs of rotationally unresolved vibrational states (0, 22e, 0), (0, 22f, 0), and (1, 33e, 0), (1, 33f, 0). The vibrational quantum numbers are designated (v1, v2ℓ, v3), with v1 representing the C=S
stretch (866 cm-1), v2 the bend (520 cm-1), v3 the C=O stretch (2072 cm-1), and ℓ the
vibrational angular momentum [36, 69]. Here we adopt a multi-temperature model [70] in which the vibrational temperature of an individual level ν is defined as
18 𝑇𝜈 = 𝐸𝜈 ln(
𝑔(𝜈)𝑆GS 𝑔(GS)𝑆ν)
⁄ (1)
where Sν and SGS are the measured rotational line intensity of the state ν and the ground state,
respectively, g(ν) and g(GS) are the degeneracies, and Eν is its vibrational energy (in Kelvin).
The sensitivity and the dynamic range of the spectrometer permits detection of the vibrationally excited OCS not only after the molecules are flash-heated in the reactor, but also in an experiment in which the SiC tube is kept at room temperature. In the latter measurement the vibrationally excited levels are less populated and the corresponding rotational line intensities, Sν, are smaller, if measured against the ground state line intensity,
SGS. In the following discussion we shall use vibrational temperatures divided by the
temperature of the reactor wall, Twall, as such a representation will help to relate the observed
VPDs to the mechanisms of heating molecular vibrational degrees of freedom up to the Twall
and cooling them down to the expanding beam temperatures. In OCS, we found the VPD to be mostly Boltzmann, i.e. with the measured Tν for all vibrational levels to be approximately
equal to a common vibrational temperature, Tvib, of the molecule.
The vibrational temperature Tvib of the OCS molecules expanded from the room
temperature reactor has the ratio Tvib / Twall ≈ 0.84 in good agreement with the previous
molecular beam studies by DeLeon and Muenter [66]. Twall = 300 K is a special case in which
molecular vibrations are a priori thermalized at Twall temperature, and the small deviation of
Tvib / Twall from unity should be explained by the (slow) cooling of vibrations in the
supersonic expansion. However, upon passage through the heated Chen reactor at Twall =
1500 K, the ratio decreased to Tvib / Twall ≈ 0.32. The decrease in relative vibrational
temperature can be rationalized by invoking either an unexpectedly efficient V – T/R cooling of molecular vibrations upon expansion from a Twall = 1000 – 1500 K reactor, by allowing for
19
incomplete thermalization of the OCS molecules in the heated reactor during the ~100 μs residence time, or by a more complex scenario.
Vibrational energy transfer in OCS molecules has been studied extensively in the past [67, 71-74]. The equation
𝑑𝑇𝑣𝑖𝑏
𝑑𝑡 = − 1
𝜏(𝑇𝑣𝑖𝑏− 𝑇𝑡𝑟) (2)
where τ, the time constant of the collisionally-induced V–T energy transfer, governs the vibrational temperature equilibration rate, and is applicable to the two cases in which the ambient translational temperature Ttr is above or below the Tvib [67]. We adopt the latter
measured value of 1/(τp)= 490 Torr-1 s-1 [67] to obtain τ = 5 μs for T–V energy transfer between OCS molecules and argon atoms inside the heated reactor, where we estimate the average pressure to be p = 0.5 bar. The τ was measured in a fluorescence experiment in which excited vibrational levels of OCS were relaxed by collisions with Ar atoms in a room temperature cell [67]. Because the energy gap between the vibrations of OCS and the kinetic energy of argon atoms at 300 K or at 1500 K is similar, we believe that the τ value is valid for our pyrolysis conditions. It is clear from integrating Eq. (2) [67] and using the τ = 5 μs value, that vibrational thermalization of molecules in the hot reactor is fast relative to the ~100 μs time-scale [14, 15] of residence time. For example, flash-heating room temperature OCS molecules mixed with Ar in a Twall = Ttr = 1500 K reactor, requires 1 μs to reach Tvib = 480 K,
and 13 μs to reach Tvib = 1400 K.
These estimates lead us to believe that the reduced Tvib / Twall ≈ 0.32 (Tvib = 480 K at
Twall = 1500 K) observed for OCS molecules can be explained either by accelerated V–T
cooling in this pyrolysis experiment at elevated temperatures, or, what seems more plausible, by a more complex temperature distribution in the reactor. In the concluding section of this Perspective we present some evidence for the latter possibility and consider a
multi-20
component flow through the reactor. In that picture, it is only the layer of gas adjacent to the wall that is thermalized at the Twall temperature, while molecules flowing closer to the middle
of the tube are heated to lower (vibrational) temperatures.
H2CO
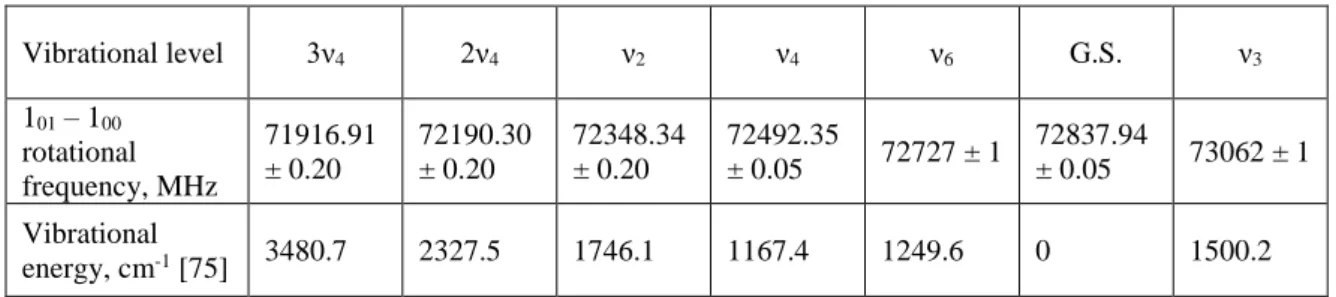
In formaldehyde, that is produced by pyrolysis of ethyl nitrite, the strong satellite line in the spectrum in Fig. 3 belongs to H2CO molecules with one quantum of the ν4 out-of-plane
bending excitation [75]. Vibrational level 3ν4 2ν4 ν2 ν4 ν6 G.S. ν3 101 – 100 rotational frequency, MHz 71916.91 ± 0.20 72190.30 ± 0.20 72348.34 ± 0.20 72492.35 ± 0.05 72727 ± 1 72837.94 ± 0.05 73062 ± 1 Vibrational energy, cm-1 [75] 3480.7 2327.5 1746.1 1167.4 1249.6 0 1500.2
Table 1. Rotational 101 – 100 transition frequencies of H2CO molecules in various vibrational levels measured in this work. A more precise value for the ground state transition of 72837.948 ± 0.01 MHz is available [76]. Transitions in levels ν2, ν4, ν3 and ν6 were previously measured by mm-wave experiments [77] (note the difference in mode notation), and the transition frequency in the 2ν4 level is in agreement with the FTIR study [78]. The 3ν4 level assignment was made based on its measured effective vibrational temperature (see Fig. 4 and text below). States ν1 (2782.2 cm-1) and ν5 (2843.0 cm-1) were not observed in this work.
Although this strong transition may be encoding information about the transition state through which the parent molecule has passed upon dissociation, we find that the VPD in this experiment has been strongly affected by collisional relaxation during the expansion. In fact, the ν4 level population observed in formaldehyde, which results from a pyrolysis reaction
(Fig. 3), is similar to the ν4 level population in formaldehyde co-expanded through the heated
pyrolysis reactor with argon or helium. Here we use the VPD of the latter measurement to characterize the vibrational relaxation dynamics of H2CO molecules.
21
We assign several lines in the rotational spectrum of formaldehyde (not shown here) to vibrationally excited states of formaldehyde (Table 1). The effective vibrational temperatures (Fig. 4) of the five excited vibrational states are deduced from the observed line intensities in a way similar to that for OCS, but with a correction for the nuclear spin degeneracy in H2CO. Due to the nuclear spin statistics of the two hydrogen atoms in the
molecule, the antisymmetric vibrational levels (v4 = odd) with even-Ka belong to the I = 1
total nuclear spin species, ortho-H2CO, and the symmetric (v4 = even) levels with even-Ka
belong to the I = 0 species, para-H2CO. All H2CO molecules sampled by the JKaKc = 101 – 000
transition are in the Ka = 0 state, and are either ortho- or para- species depending on the
symmetry of their vibrational state. The nuclear spin degeneracies are g(ν4)=3, g(2ν4)=1,
g(3ν4)=3, and g(ν6)=3, g(ν2)=1, g(ν3)=1. Therefore, for example, we divide the intensity of
the JKaKc = 101 – 000 transition in the ν4 state by 3 when deriving the effective vibrational
temperature.
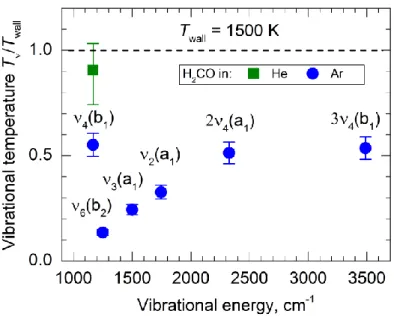
We measured the Tν / Twall ratio for the ν4 level of H2CO at different reactor
temperatures. The population of the ν4 level was in near equilibrium with the reactor at room
temperature: Tν / Twall = 0.85. The relative effective vibrational temperature Tν / Twall was
measured to be 0.47, 0.57 and 0.63 at Twall = 1150 K, 1500 K and 1750 K, respectively, in
22
Figure 4. The Tν / Twall ratio measured for formaldehyde in vibrational states ν4, 2ν4, 3ν4, ν2, ν3, and ν6. The symmetries of the corresponding vibrational wavefunctions are given in the parentheses. Formaldehyde molecules were mixed with the carrier gas (argon or helium) and expanded through the tubular reactor heated to
Twall = 1500 K. The horizontal axis is the vibrational excitation energy of each state [75]. The vibrational population distribution is non-Boltzmann with the mode ν4 showing the largest relative population.
Unlike OCS, for which all its states would fall on a straight horizontal line in a plot similar to Fig. 4, H2CO exhibits different vibrational temperatures for different vibrational
levels. The data in Fig. 4, which correspond to the ν4 state (out-of-plane bend) and its 2ν4
overtone have effective vibrational temperatures of Tν = 750 – 900 K, displaying the largest
relative population compared to levels ν6 (in-plane bend), ν3 (sym. CH2 bend) and ν2 (C–O
stretch). The rotational transition at 71916.91 MHz (Table 1) is assigned to the 3ν4 overtone
(and not to 2ν2) because its Tν matches the effective temperature of other states with quanta in
mode ν4.
We invoke Coriolis-type interactions between the vibrational levels of formaldehyde [75, 79, 80] to account for the observed non-Boltzmann VPD in formaldehyde. The Coriolis
23
interaction matrix element that couples the vibrational states ν4 and ν6 through the a-axis
rotation [80]
< 𝑣4 = 1, 𝑣6 = 0, 𝐽, 𝐾𝑎| 𝐻𝐶𝑜𝑟 |𝑣4 = 0, 𝑣6 = 1, 𝐽, 𝐾𝑎 > = 𝑖𝜉46𝑎 𝐾𝑎 (3)
is proportional to the projection of the total angular momentum J on the a-axis, Ka, and the
Coriolis coefficient 𝜉46𝑎 . When the nozzle is heated and high values of J, Ka are populated,
facile mixing and thermalization of vibrational states occurs [79]. Upon collisional cooling in the supersonic expansion, the vibrational state populations in ν4 and ν6 levels redistribute,
mediated by the strong Coriolis interaction between these two levels, following the ambient temperature of the molecular beam. Eventually the Coriolis interaction between the pair of vibrational states shuts down at low J, Ka and locks in the VPD. It is this final population
distribution that we observe in the collisionless region of the beam.
The measured ratio of line intensities for ν4 and ν6 levels is 1200 and the energy gap
between these levels is 82 cm-1. An effective temperature of this two-level system (TLS) can be calculated, using Eq. (1), to be 82/ln(1200) = 12 cm-1 = 17 K (both levels are g(ν)=3 degenerate). Assuming that this is a TLS that is isolated from other vibrational levels (which is probably a good assumption since the ν6 ν4 Coriolis interaction is the strongest of all),
but has good thermalization with Ar atoms in the beam, the T = 17 K must be indicative of the ambient temperature at which the ν6, ν4 vibrational level population froze. Since the
a-axis rotational constant of formaldehyde is 9.4 cm-1, the Coriolis ν6 ν4 energy transfer at T
= 17 K is facilitated by a rotational excitation as small as Ka = 1. Other levels are connected
by Coriolis coefficients that are significantly smaller than 𝜉46𝑎 , or 𝜉2×4,4+6𝑎 , 𝜉4+6,2×6𝑎 , etc. [80] and the population flow between them terminates at higher temperatures. Thus most vibrational population is accumulated in the ν4, 2ν4 and 3ν4 levels of formaldehyde, which
24
The symmetry of the formaldehyde molecule may contribute to the immunity of mode ν4 to collisional V–T/R relaxation. Exchanging the two hydrogen atoms by a C2 operation
will leave the total wavefunction of the H2CO molecule unchanged if v4 is even and will
change its sign if v4 is odd, given that Ka is even. Since interconversion between the para-
and ortho- species is slow on the time-scale of the experiment, relaxation with Δv4 = 1 must
be accompanied by a ΔKa = 1, 3, … transition. This concerted (Δv4 = 1, ΔKa = 1, 3, …)
collisionally-induced transition is likely to have small cross section.
CH3CHO
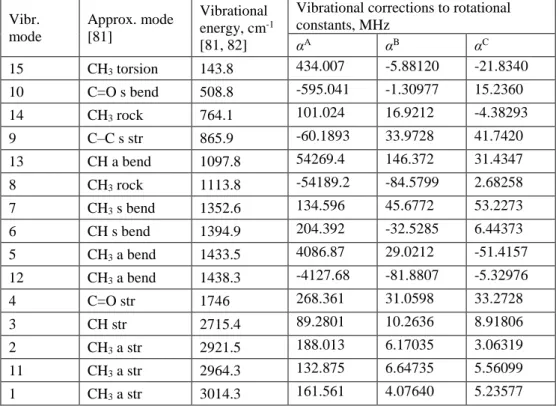
In order to evaluate the VPD in CH3CHO molecules, the frequencies of the rotational
transitions of acetaldehyde are calculated.
Vibr. mode Approx. mode [81] Vibrational energy, cm-1 [81, 82]
Vibrational corrections to rotational constants, MHz αA αB αC 15 CH3 torsion 143.8 434.007 -5.88120 -21.8340 10 C=O s bend 508.8 -595.041 -1.30977 15.2360 14 CH3 rock 764.1 101.024 16.9212 -4.38293 9 C–C s str 865.9 -60.1893 33.9728 41.7420 13 CH a bend 1097.8 54269.4 146.372 31.4347 8 CH3 rock 1113.8 -54189.2 -84.5799 2.68258 7 CH3 s bend 1352.6 134.596 45.6772 53.2273 6 CH s bend 1394.9 204.392 -32.5285 6.44373 5 CH3 a bend 1433.5 4086.87 29.0212 -51.4157 12 CH3 a bend 1438.3 -4127.68 -81.8807 -5.32976 4 C=O str 1746 268.361 31.0598 33.2728 3 CH str 2715.4 89.2801 10.2636 8.91806 2 CH3 a str 2921.5 188.013 6.17035 3.06319 11 CH3 a str 2964.3 132.875 6.64735 5.56099 1 CH3 a str 3014.3 161.561 4.07640 5.23577
25
Vibration-rotation constants αA, αB, and αC (Table 2) that describe the changes in rotational constants upon vibrational excitation [83] were calculated in the coupled-cluster approximation known as CCSD(T) [84], using the ANO1 contraction [85] of the atomic natural orbital basis sets of Taylor and Almlöf [86]. These constants require computation of the harmonic and cubic force fields, the details of which are fully described in Ref. [87]. The ANO1 basis set together with the CCSD(T) treatment of electron correlation is known to give a very good estimate of fundamental vibrational frequencies (an accuracy of ca. 10 cm-1); the present results suggest that it is also quite accurate for estimation of rotation-vibration interactions, at least in cases where Coriolis resonance effects are not significant.
Acetaldehyde molecules were found to be vibrationally cold. No rotational transitions in vibrationally excited levels of acetaldehyde were found in the ± 2 GHz spectral range around the 404 – 303 transition of the vibrational ground state molecules. We attribute the
existence of such highly efficient vibrational cooling in acetaldehyde to the internal CH3
rotor, with its 143 cm-1 rotor frequency [81, 82], which may facilitate energy transfer between
excited vibrational levels and the translational motion of the cold carrier gas [88].
Product branching
Measurement of the relative concentrations of different pyrolysis reaction products is possible using the CPmmW technique. The input parameters are: 1) the integrated intensities of the observed and assigned transitions, 2) their electric (transition) dipole moments, 3) the rotational temperature(s) of the corresponding species and 4) the parameters that describe the excitation chirped pulse(s). In the weak field limit, fast passage excitation [44] can be implemented and the observed signal, S, is described by the following equation [28, 35, 41]
26 𝑆 ∝∆𝑛0𝐸0𝜇
2
√𝛼 (4)
where Δn0 is the initial population difference of the two rotational levels between which
coherence is created by the mm-wave field with amplitude E0. The electric (transition) dipole
moment, µ, and the chirp-rate, defined, for a linear frequency sweep over the frequency range Δ𝜈 in time 𝜏 as 𝛼 =Δ𝜈
𝜏, are the other two relevant parameters. The condition for weak field
excitation [35],
ΩR
√𝛼 ≪ 1, (5)
where Ω =𝜇𝐸0
ℎ is the Rabi frequency, implies weak coupling of the molecular transitions to
the mm-wave field. An additional, to Eq. (5), requirement for fast passage is that the chirp sweeps through its frequency range more rapidly than decoherence effects can cause the oscillating molecular dipoles to evolve out of phase with each other. In this experiment the leading source of dephasing is the Doppler effect due to divergence of the molecular beam. This Doppler dephasing becomes significant on a 3 – 5 µs timescale, and the chirp durations are programmed to be 1 µs.
Whether the condition in Eq. (5) for weak field excitation is fulfilled can be verified by evaluating the electric field amplitude, E0, in the interaction region, and thus the Rabi
frequency. Although the power of the mm-wave source is known and can be converted to the E-field amplitude, a more precise determination of the E-field strength is achieved by directly observing the response of the molecular or atomic sample to the mm-wave excitation by using the CPmmW spectrometer [35, 51]. In this work we excite the 817 – 808 rotational
transition in SO2 molecules, expanded from the (cold) pyrolysis nozzle, with single
frequency, 4 µs long pulses. The Rabi frequency of ΩR(SO2) =𝜇𝐸0
ℎ = 0.45 MHz and the E0
27
the excitation pulse (nutations).[51] The measured E-field amplitude of E0 = 8.8 V/m is the
same for chirped excitation, and the validity of condition of Eq. (5) can be verified. For the CH3CHO 404 – 303 transitions (µa = 2.42 D [60]) polarized by a Δν = 20 MHz, 𝜏 = 1 𝜇s chirp
the Rabi frequency is ΩR(CH3CHO) =𝜇𝐸0
ℎ = 0.67 MHz and
ΩR(CH3CHO)
√𝛼 ≈ 0.15. Agreement
between the CH3CHO line intensities obtained with the broad and the narrow chirps, as
discussed above, is an additional confirmation that the narrowband Δν = 20 MHz chirped excitation does not drive the rotational transitions outside the linear region of the Rabi cycle and that Eq. (4) can be used to measure species concentrations and reaction branching ratios. These estimates are also consistent, when ΩR
√𝛼 is rescaled, with the saturation measurements of
OCS transitions by Zaleski et al [29] that they have employed to establish the chirp bandwidths at which Eq. (4) is valid. Finally, it may be instructive to rewrite Eq. (4) in the form 𝑆 ∝ΩR
√𝛼∆𝑛0𝜇. The physical meaning of the ΩR
√𝛼 term is the degree of polarization
acquired by each molecular oscillator, and the ∆𝑛0𝜇 term corresponds to the macroscopic polarization, which is proportional to the FID, of a sample of completely polarized oscillators [35, 41, 51].
In order to obtain the relative concentrations, the line intensities are normalized to account for the bandwidth of the chirps and for the frequency-dependence of the output power of the active multiplier chain. The dipole moments are usually known or can be calculated with sufficient precision. We employ the PGOPHER [56] program to simulate the rotational spectrum of several species at a specified rotational temperature. As discussed above, we use acetaldehyde as a thermometer molecule and assume rotational thermalization of all parent and fragment molecules to the common Trot = 4 K. The relative species
concentrations are varied in the PGOPHER program to match the relative line intensities of the simulation and the calibrated experimental spectrum.
28
To relate the concentrations of these products to the initial concentration of the precursor, a 0.1% mixture of acetaldehyde in argon was expanded from the nozzle at Twall =
1500 K. This signal corresponds to what would be a 100% conversion from ethyl nitrite to acetaldehyde, and can serve as a reference. For CH3CH2ONO pyrolysis at Twall = 1500 K we
obtain the CH3CHO : H2CO : HNO product branching to be 21 : 2.8 : 1.1, where 100
corresponds to the concentration of CH3CH2ONO prior to pyrolysis. Thus, the overall
conversion to these three products at Twall = 1500 K is about 25%.
The temperature and pressure distributions in the pyrolysis reactor are not well characterized at the moment. Several experimental facts point to the possibility that there are concentric layers of flow in the reactor that do not mix completely with each other and have different temperatures. The most convincing evidence for that is that decomposition of methyl nitrite, CH3ONO, carried out at the same experimental conditions as ethyl nitrite
pyrolysis, is incomplete. In another experiment conducted at the same (Twall = 1500 K)
conditions, products that require cleavage of a 85 kcal/mol CH3–CHO bond in acetaldehyde
[89] are observed. Simple estimates based on the Arrhenius coefficients for these reactions show that for the 100 μs residence time in the reactor, the former observation requires the reactor temperature to be below 800 K, and the latter reaction turns on at or above 1500 K. The multi-layer structure of the flow in the reactor would be consistent with the behavior of the Tv / Twall in OCS molecules. At Twall = 1500 K there may be a center flow region where the
OCS/Ar mixture is not heated to the Twall during the flash through the SiC tube. The
vibrational temperature averaged over all OCS molecules in the flow thus would be noticeably lower than the Twall, Tv / Twall < 1, which is observed in the experiment. However,
when expanding through a room temperature reactor, the flow is at 300 K everywhere in the tube and Tv / Twall ≈ 1 in accordance with ours and previous [66] observations. These
29
accordance with our estimates for OCS in Ar (see the “Vibrational temperature” section). In formaldehyde (Fig. 4), the higher temperature of the ν4 level in He carrier gas can be
explained by more uniform heating of H2CO molecules in the reactor because of faster
diffusion of He compared to Ar.[90] Recent computational fluid dynamics simulation [14, 15] of a continuous flow tubular reactor indicates that the flow near the axis of the SiC tube is colder than that near the wall of the tube. Thus the incomplete, 25%, conversion of ethyl nitrite precursor into the three products may be explained by its incomplete thermal dissociation in the cooler core of the flow through the reactor. Another species that is identified in the spectrum in Fig. 3(b) is ethanol. However, ethanol is also found in the spectrum with the room temperature reactor and is likely to be a by-product of ethyl nitrite synthesis [54].
The uncertainty in the species concentrations measurement results from several sources: i) possible deviation of the rotational temperature of a product from that of the thermometer molecule (see “Rotational temperature” section), ii) the frequency-dependent intensity fluctuations observed in the transmitted chirps, likely to be caused by standing waves, iii) frequency-dependent non-linearity of the microwave and the mm-wave components’ response in the 0 – 40 dB range of mm-wave attenuation set by the direct reading attenuator, iv) uncertainty in measuring the Trot introduced by ii) and iii), and v)
molecules in vibrationally excited states for which rotational transitions are not assigned and thus are not included in the line intensity calculation. We estimate that ii) – v) account for an uncertainty of ± 30% in the relative concentration measurements. The limitation i) is perhaps the most fundamental one in this experiment. Although there is a reason to believe that cooling in the beam equilibrates rotational degrees of freedom of most of the molecules very effectively, the validity of this assumption requires further investigation.
30
Conclusions
We have demonstrated the feasibility and some advantages of chirped-pulse rotational spectroscopy to quantify reaction product branching and quantum state population distributions in product molecules. As an example, we have observed the flash pyrolysis of ethyl nitrite and measured its decomposition yields of H2CO, CH3CHO, and HNO. Studies in
the 60 – 100 GHz millimeter-wave spectral region are capable of sampling the populations of most polar two-heavy-atom molecules as well as larger molecules. A multi-chirp modification of the CPmmW experiment is demonstrated to be a useful approach to CP studies. Chirp segments with different independently chosen spectral content form a sequence that covers a single gas pulse. The number of chirps of each kind in the sequence and their bandwidth can be varied to achieve the desired S/N in each spectral region/species targeted. In this way the sensitivity of the spectrometer can be effectively re-distributed between the reaction products with different abundances and electric dipole moments.
From the CPmmW spectra we find that rotations of acetaldehyde molecules are effectively cooled to Trot = 4 ± 1 K by the supersonic expansion even at the elevated
temperatures of the pyrolysis reactor. State-specific vibrational temperatures in OCS, H2CO,
and CH3CHO molecules were measured by analyzing the intensities of rotational transitions
of molecules in their vibrationally excited states. Vibrational level populations in OCS molecules are approximately Boltzmann distributed. Formaldehyde demonstrates a very different, highly mode-specific vibrational population distribution, which is consistent with the fast vibrational energy redistribution facilitated by Coriolis interaction. Finally, acetaldehyde molecules are found to be vibrationally cold, likely due to the efficient relaxation enabled by the low-frequency internal rotor mode.
31
The CPmmW-deduced branching of pyrolysis reaction products can be compared with kinetics computer simulations to gain insight into the chemistry that occurs inside the reactor. Perhaps the most significant challenge in using the flash pyrolysis nozzle for dynamics and kinetics studies is the incomplete knowledge of the temperature and pressure distribution inside the reactor. In the present work we have attempted to elucidate some qualitative features of the flow in the reactor using the observed vibrational temperature distributions and simple kinetic estimates. Both experimental and theoretical the efforts to better characterize the reactor are under way in the groups of G. B. Ellison and J. W. Daily [91]. Photolysis-initiated unimolecular decomposition and more complex reactions would be another area of chemical reactivity addressed by the CP method. For unimolecular studies, a slit jet expansion provides a convenient environment, which provides sufficient rotational cooling of reaction products yet no secondary chemistry [48]. The pulsed uniform Laval flow, with well-characterized temperature and pressure [49], coupled with a CP spectrometer may prove to be the method of choice for studying complex chemical reactions that are important in atmosphere and in space. Finally, extension of the CPmmW spectrometer to cover the 100 – 200 GHz frequency region [31] in order to directly measure rotational temperature of smaller molecules is now both technologically possible and scientifically desirable.
We thank Dr. Justin Neill and Prof. Brooks Pate for their assistance in construction of the CPmmW spectrometer. KP thanks the ACS Petroleum Research Fund (grant #50650-ND6) for support, RWF, RGS, GBP and KP are grateful to the Department of Energy (grant #DEFG0287ER13671) for personnel support and equipment. G.B.E. and J.F.S. are supported by the US National Science Foundation, under Grant CHE-1112466. AGS acknowledges the Army Research Office award number 58245-CH-11.
32
References
1. M.C.L. Gerry, W. Lewisbevan, and N.P.C. Westwood, The Microwave-Spectrum of an Unstable Molecule - Chloroketene ClHCCO. Journal of Chemical Physics, 1983.
79(10): p. 4655-4663.
2. P. Chen, S.D. Colson, W.A. Chupka, and J.A. Berson, Flash Pyrolytic Production of Rotationally Cold Free-Radicals in a Supersonic Jet - Resonant Multiphoton Spectrum of the 3p2A2'' <-- X2A2'' Origin Band of CH3. Journal of Physical Chemistry, 1986. 90(11): p. 2319-2321.
3. J.R. Dunlop, J. Karolczak, and D.J. Clouthier, Pyrolysis Jet Spectroscopy. Chemical Physics Letters, 1988. 151(4-5): p. 362-368.
4. J.I. Choe, S.R. Tanner, and M.D. Harmony, Laser-Excitation Spectrum and Structure of CCl2 in a Free-Jet Expansion from a Heated Nozzle. Journal of Molecular Spectroscopy, 1989. 138(2): p. 319-331.
5. H.S. Gutowsky, J. Chen, P.J. Hajduk, J.D. Keen, and T. Emilsson, The Silicon Carbon Double-Bond - Theory Takes a Round. Journal of the American Chemical Society, 1991. 113(13): p. 4747–4751.
6. D.W. Kohn, H. Clauberg, and P. Chen, Flash Pyrolysis Nozzle for Generation of Radicals in a Supersonic Jet Expansion. Review of Scientific Instruments, 1992.
63(8): p. 4003-4005.
7. M.D. Harmony, K.A. Beren, D.M. Angst, and K.L. Ratzlaff, Compact Hot-Nozzle Fourier-Transform Microwave Spectrometer. Review of Scientific Instruments, 1995.
66(11): p. 5196-5202.
8. M.R. Cameron and S.H. Kable, A new design for a simple and effective pyrolysis nozzle in a supersonic free jet. Review of Scientific Instruments, 1996. 67(1): p. 283-287.
9. J. Kupper, J.M. Merritt, and R.E. Miller, Free radicals in superfluid liquid helium nanodroplets: A pyrolysis source for the production of propargyl radical. Journal of Chemical Physics, 2002. 117(2): p. 647-652.
10. X. Zhang, A.V. Friderichsen, S. Nandi, G.B. Ellison, D.E. David, J.T. McKinnon, T.G. Lindeman, D.C. Dayton, and M.R. Nimlos, Intense, hyperthermal source of organic radicals for matrix-isolation spectroscopy. Review of Scientific Instruments, 2003. 74(6): p. 3077-3086.
33
11. Z.A. Liu, R.J. Livingstone, and P.B. Davies, Pulse pyrolysis infrared laser jet spectroscopy of free radicals. Chemical Physics Letters, 1998. 291(5-6): p. 480-486. 12. A. Vasiliou, M.R. Nimlos, J.W. Daily, and G.B. Ellison, Thermal Decomposition of
Furan Generates Propargyl Radicals. Journal of Physical Chemistry A, 2009.
113(30): p. 8540-8547.
13. A.K. Vasiliou, K.M. Piech, B. Reed, X. Zhang, M.R. Nimlos, M. Ahmed, A. Golan, O. Kostko, D.L. Osborn, D.E. David, K.N. Urness, J.W. Daily, J.F. Stanton, and G.B. Ellison, Thermal decomposition of CH3CHO studied by matrix infrared spectroscopy and photoionization mass spectroscopy. Journal of Chemical Physics, 2012. 137(16): p. 164308.
14. A.K. Vasiliou, J.H. Kim, T.K. Ormond, K.M. Piech, K.N. Urness, A.M. Scheer, D.J. Robichaud, C. Mukarakate, M.R. Nimlos, J.W. Daily, Q. Guan, H.H. Carstensen, and G.B. Ellison, Biomass pyrolysis: Thermal decomposition mechanisms of furfural and benzaldehyde. Journal of Chemical Physics, 2013. 139(10): p. 104310.
15. K.N. Urness, Q. Guan, A. Golan, J.W. Daily, M.R. Nimlos, J.F. Stanton, M. Ahmed, and G.B. Ellison, Pyrolysis of furan in a microreactor. Journal of Chemical Physics, 2013. 139(12): p. 124305.
16. H.W. Rohrs, C.T. Wickhamjones, G.B. Ellison, D. Berry, and B.M. Argrow, Fourier-Transform Infrared-Absorption Spectroscopy of Jet-Cooled Radicals. Review of Scientific Instruments, 1995. 66(3): p. 2430-2441.
17. N. Savage, The ideal biofuel. Nature, 2011. 474(7352): p. S9-S11.
18. M.K. Bahng, C. Mukarakate, D.J. Robichaud, and M.R. Nimlos, Current technologies for analysis of biomass thermochemical processing: A review. Analytica Chimica Acta, 2009. 651(2): p. 117-138.
19. M. Inman, News Feature: Cooking up Fuel. Nature Climate Change, 2012. 2(4): p. 218-220.
20. T.A. Cool, K. Nakajima, T.A. Mostefaoui, F. Qi, A. McIlroy, P.R. Westmoreland, M.E. Law, L. Poisson, D.S. Peterka, and M. Ahmed, Selective detection of isomers with photoionization mass spectrometry for studies of hydrocarbon flame chemistry. Journal of Chemical Physics, 2003. 119(16): p. 8356-8365.
21. A.J. Trevitt, M.B. Prendergast, F. Goulay, J.D. Savee, D.L. Osborn, C.A. Taatjes, and S.R. Leone, Product Branching Fractions of the CH plus Propene Reaction from Synchrotron Photoionization Mass Spectrometry. Journal of Physical Chemistry A, 2013. 117(30): p. 6450-6457.
22. J.F. Lockyear, O. Welz, J.D. Savee, F. Goulay, A.J. Trevitt, C.A. Taatjes, D.L. Osborn, and S.R. Leone, Isomer Specific Product Detection in the Reaction of CH with Acrolein. Journal of Physical Chemistry A, 2013. 117(43): p. 11013-11026.
![Figure 2. Suggested primary reactions in pyrolysis of ethyl nitrite. CH 3 CH 2 ONO can undergo single bond fission and decompose to CH 3 CH 2 O and NO radicals [16, 54, 57], after which the ethoxy radical rapidly follows one of the disso](https://thumb-eu.123doks.com/thumbv2/123doknet/14296688.493406/13.892.164.677.421.598/figure-suggested-primary-reactions-pyrolysis-nitrite-decompose-radicals.webp)