Full Terms & Conditions of access and use can be found at
https://www.tandfonline.com/action/journalInformation?journalCode=rege20
Eurasian Geography and Economics
ISSN: 1538-7216 (Print) 1938-2863 (Online) Journal homepage: https://www.tandfonline.com/loi/rege20
The effects of anti-corruption videos on attitudes
toward corruption in a Ukrainian online survey
Elena Denisova-Schmidt, Martin Huber & Yaroslav Prytula
To cite this article: Elena Denisova-Schmidt, Martin Huber & Yaroslav Prytula (2019) The effects of anti-corruption videos on attitudes toward corruption in a Ukrainian online survey, Eurasian Geography and Economics, 60:3, 304-332, DOI: 10.1080/15387216.2019.1667844
To link to this article: https://doi.org/10.1080/15387216.2019.1667844
Published online: 30 Sep 2019.
Submit your article to this journal
Article views: 127
View related articles
View Crossmark data
The effects of anti-corruption videos on attitudes toward
corruption in a Ukrainian online survey
Elena Denisova-Schmidt a*, Martin Huber band Yaroslav Prytula c
aSchool of Humanities and Social Sciences, University of St.Gallen (HSG), Switzerland;bDepartment
of Economics, University of Fribourg, Fribourg, Switzerland;cDepartment of Applied Economics and
Business, Ukrainian Catholic University, Lviv, Ukraine
ABSTRACT
This paper presents the outcomes of an anti-corruption educational intervention among Ukrainian students based on an online experiment. More than 3,000 survey partici-pants were randomly assigned to one of three different videos on corruption and its consequences (treatment groups) or a video on higher education (control group). The data suggest a high level of academic dishonesty and misconduct among young people, but also a negative atti-tude toward corruption in general, highlighting the ambiva-lence of corruption in the country. Wefind that one video, which presented a thrilling story abut a victim of corruption related to common bribery in an accessible way, was e ffec-tive in promoting awareness of the negaffec-tive consequences of corruption. In contrast, the other two treatment videos, which more closely followed the style of TV news or doc-umentaries on corruption, did not generally promote nega-tive attitudes toward corruption. Presenting corruption issues in a catchy way therefore appears to matter for the effectiveness of such interventions.
ARTICLE HISTORY Received 7 January 2019 Accepted 11 September 2019 KEYWORDS Anti-corruption campaigns; experiments; corruption; academic integrity; university; students; Ukraine
Introduction
Many universities around the world face a lack of academic integrity on the part of a range of involved stakeholders: administrators, faculty, staff, and students, as well as other related actors and agencies (see the recent discus-sions in Chapman and Lindner 2016; Bretag 2016; Denisova-Schmidt 2017). Students and their explicit and implicit involvement in such activities are especially crucial in this chain. The way young people experience and perceive corruption – its techniques, frequency, and acceptance – likely affects their professional lives. The potential damage to the national and global economy CONTACTElena Denisova-Schmidt elena.denisova-schmidt@unisg.ch University of St.Gallen (HSG), Gatterstr. 3, 9010 St. Gallen, Switzerland
*Elena Denisova-Schmidt is also affiliated with the Center for International Higher Education, Boston College, United States.
This article has been republished with minor changes. These changes do not impact the academic content of the article.
2019, VOL. 60, NO. 3, 304–332
https://doi.org/10.1080/15387216.2019.1667844
can hardly be underestimated (cf. Cohn, Fehr, and Maréchal 2014). Effective preventive and control measures are therefore crucial for tackling corruption. One such remedy might be an educational campaign using online videos highlighting the negative consequences of corruption, the design, and effects of which are experimentally examined in this paper.
More concisely, we investigated how anti-corruption videos accessed via social media influenced the attitudes toward corruption of students in Ukraine who participated in an online survey. The potential negative effects of social media on their users have received a lot of attention in light of the Facebook-Cambridge Analytica data scandal. Yet social media might also yield positive effects positive in terms of anti-corruption civic activities (cf. Marinov and Schimmelfennig2015).
Why Ukraine? Ukraine is a rather unique case: it is one of the most corrupt countries in the world, with one of the worst ratings among post-Soviet republics (cf. Transparency International Index). Indeed, a range of (in contrast to our paper non-experimental) studies stresses the high level of corruption in all areas in the country, including oligarchic state capture (cf. Åslund 2009,
2014a, 2014b, 2015; Balmaceda2013; Wilson 2005, 2014; Melnykovska 2015; Pleines2016) as well as some other problematic issues in business and politics (Leipnik and Kyrychenko 2013; Rojansky 2014; Denisova-Schmidt and Prytula
2017), academic dishonesty, including cheating, bribery and other unethical issues among students, faculty members administration, and other stake-holders (Osipian 2008, 2010, 2017; Round, Williams and Rodgers 2008; Zaloznaya2012; Round and Rodgers 2009; Shaw, Katsaiti, and Pecoraro 2015; Klein2017; Polese et al. 2018), and other areas of petty and grand corruption (Neutze and Karatnycky2007, Åslund2014a, Kuzio2015; Roberts and Orttung
2015; Prytula et al. 2019) and challenges in the implementation of anti-corruption measures and reforms (Grødeland 2010; Nasuti 2016). The results of a 2017 mass-population survey1 (n = 6000) suggest that Ukrainians do not believe that the following practices spoil the good development of a society: bringing presents “to obtain access to health services” (63.7%) or “to be accepted at a good school” (74%) and “paying fees to have documents sorted out quickly” (73.7%). Students practice corrupt behavior in their daily routines at universities, too (see the recent discussions on academic dishonesty in Polese et al. 2018; Denisova-Schmidt 2019). At the same time, however, Ukraine is one of the leading countries protesting against corruption (cf. Denisova-Schmidt 2018; Elena and Prytula2017). Young people and students were the driving forces in all of the recent revolutions in Ukraine (the Revolution on Granite in 1990, the Orange Revolution in 2004, and the Revolution of Dignity in 2014).
In this paper, we follow the definition of corruption provided by Transparency International (TI): “the abuse of entrusted power for private gain”. When referring to higher education, we use a broader approach and
include as corruption“the lack of academic integrity” (Denisova-Schmidt2019). In developing the design of this study, we have benefitted from the latest discussions in Sabic-El-Rayess and Mansur (2016); Chapman and Lindner (2016), Bretag (2016). It should be noted that corruption as a term might be misleading: It ***encompasses many activities (TI, for example, counts more than 40 practices) such as bribes, fraud, collusion, conflict of interest, nepotism, favoritism, and gifts, which are not always illegal per se and which might be difficult to capture and identify as such. Supporting a young colleague in his or her academic career, for example, is highly likely to be perceived by insiders as solidarity or a collegial gesture, while outsiders may label it as, one form of favoritism corruption. Based on previous research on the region, we di fferenti-ate between the attitudes and the real experiences of corruption. These attitudes are crucial in understanding corrupt behavior and can influence the latter significantly. Miller, Grødeland, and Koshechkina (2001), for instance, compared four post-communist countries (Ukraine, Bulgaria, the Czech Republic, and Slovakia) and found that petty corruption is still widespread and broadly accepted by the citizens as a successful strategy for dealing with officials, even if they also condemn it. Tavits (2010) used empirical data from Estonia to argue that both public officials and citizens are more prone to corruption if they do not consider corruption to be wrong or if they perceive corruption to be widespread.Čábelková and Hanousek (2004) also argue that perceived corruption, as well as corruption scandals publicly discussed in media, actually encourage willingness to bribe in Ukraine. Similar outcomes can also be seen in the study by Zaloznaya, Reisinger, and Claypool (2018), who found that civic society anti-corruption activities in Russia and Ukraine in fact “promote” corruption in a long-term perspective.
Our paper is broadly related to educational campaigns, which can be effective in many different contexts. They might, for instance, forestall danger-ous situations, increase safety and foster professional and personnel success (cf. Schwappach et al. 2013; McGuigan, McNally, and Wyness 2016). More specifically, we aim to contribute to the literature on lab, field or natural experiments examining causal effects on corruption-related issues; see, for example, the discussions in Armantier and Boly (2011, 2013), Barr and Serra (2010), Findley, Nielson, and Sharman (2014), Holmes (2015), Serra and Wantchekon (2012). We are particularly interested in the contradictory effects that educational interventions might produce, promoting the behavior that they are actually trying to prevent and/or condemn, for instance by raising awareness about its existence. This may be the case with anti-drug media campaigns (Hornik et al. 2008) or reality shows on teen pregnancy (Wright, Randall, and Arroyo 2012). More closely related to corruption, an experiment conducted by John, Loewenstein, and Rick (2014) among students in the US suggests that awareness of widespread dishonest behavior increases cheating while monetary incentives have less of an impact. Similar results were found in
an information experiment by Corbacho et al. (2016) in Costa Rica. Participants who believed that everyone else was corrupt and/or who had had personal experience with corruption in the past were more likely to engage in corrupt behaviors themselves. In addition, Denisova-Schmidt, Huber, and Prytula (2015) and Denisova-Schmidt, Huber, and Leontyeva (2016a) found similarly perverse effects of anti-corruption educational campaigns for specific sub-groups: students at selected Ukrainian public universities who had not pre-viously been involved in monetary corruption or deceiving faculty members learned about the extent of this phenomenon from the anti-corruption mate-rials used in the experiment and became more tolerant toward corruption. See also the study by Elena et al. (2017), who found that, for students at public universities in the Russian Far East, anti-corruption interventions (brochures or cartoons) might increase tolerance toward academic dishonesty among spe-cific subgroups (non-plagiarizing students) while promoting negative views on corruption in other groups (excellent students and students with well-educated fathers).
The experiment presented in this paper (a.) considers the effects of three different videos on aspects and consequences of corruption (treatment groups) compared to a video on higher education (control group) and (b.) is conducted in the context of social media among more than 3,000 online survey participants, rather than at university campuses. In contrast to our previous study (Denisova-Schmidt et. al., 2017), which tested the effects of cartoons showing rats as the main characters2, this study used videos with real people as the main characters. However, as a word of caution, we point out that the survey data underlying our experiment are not representative for the whole of Ukraine, as for instance females and specific regions are substantially oversampled. This borne in mind, ourfindings suggest that videos spread via social media might be an appropriate tool to promote awareness about the negative consequences of corruption among students, but the way the cor-ruption issue is presented and communicated matters for the effectiveness. Specifically, we find that one video, which presented the consequences of corruption in a thrilling and accessible way based on telling a personal story related to common issues of bribing, promoted negative attitudes toward corruption in several dimensions. Online survey participants exposed to this video more often judged corruption to be a crime and evil, and to have a negative impact on one’s health, security, the healthcare system and the economy of Ukraine. These findings also persisted when applying machine learning methods to (a.) account for multiple hypothesis testing issues (i.e. spurious effects), and (b.) control for minor covariate imbalances across treat-ment groups due to attrition or imperfect randomization. The remaining two treatment videos presented corruption issues more formally in a way that resembles TV news reporting or documentaries, one of which provided statis-tics and information on countermeasures against corruption, while the other
discussed the legitimacy of academic cheating under certain circumstances. Neither video appeared to negatively affect attitudes toward corruption. If anything, they seemed to foster sympathy for the existence of corruption, although the comparably few statistically significant effects might be spurious due to multiple hypothesis testing.
The remainder of this study is organized as follows: Section 2 describes the research design and the data; Section 3 presents the empirical analysis and results. In addition to the experimental treatment effects, this section provides an analysis of sample attrition as well as a discussion of machine learning-based methods to investigate multiple hypothesis testing issues, tackle imbal-ances of observed covariates across treatment groups and analyze effect heterogeneity across covariates. Section 4 concludes.
Research design and data
The research design and data collection were implemented on our behalf by the sociological company FAMA, located in Lviv, Ukraine. A Facebook account, @atlantynespisuyut (Engl.: Atlantes do not cheat), was created and regularly updated from October 2016 until May 2018. Questions regarding academic integrity as well as some current issues in Ukrainian higher education were discussed in the Facebook group. In parallel, we assigned the PR agency Tvoe Misto, also based in Lviv, to prepare three videos according to our guidelines showing several typical cases of corruption as well as a “control” video that discusses modern means of education but does not touch on corruption at all. One video was obtained from the Kyiv-based production studio 315film for noncommercial usage. Using Facebook, direct mailings to various student groups and announcements on the FAMA homepage, as well as some addi-tional channels, respondents were recruited to participate in our survey.
Respondents were supposed to answer the first part of the online survey, consisting of questions about their studies (major, academic year, academic achievements), demographics and socioeconomic characteristics as well as on their personal experience with and/or witnessing of questionable behavior related to bribing or unsound methods in the education system. Then the students were to watch a video randomly assigned to them and afterward continued with the second part of the survey, which also contained questions related to corruption (as in Denisova-Schmidt, Huber, and Leontyeva 2016b), such as whether they viewed corruption in a rather negative (“evil” and “crime”), pragmatic (“necessity”, “a way of solving problems”), positive (“a way of getting income” and “compensation for low wages”), neutral (“tempor-ary situation” and “part of life”) or typically “Ukrainian” (“tradition” and ‘national peculiarity) way. Similar to Denisova-Schmidt et al., 2017, the respon-dents were also asked how they perceived the impact of corruption on their personal quality of life, education, health and safety, and on the Ukrainian
economy. At the end of the survey, participants could optionally take part in a lottery to win a small monetary prize, which will be analyzed in a companion paper. The survey experiment was run between May and October 2017.
In experiments, there is frequently a trade-off between statistical power and external validity. While one would ideally consider a sample that is represen-tative of the population when randomizing the treatment, the aim to maximize the sample size through an online survey might entail non-representativeness. This is also the case for our sample, which does not match the distributions of factors like location or gender in the Ukraine as a whole. On the other hand, the internal validity of the causal effects follows from the random assignment of treatments. Students from more than 550 higher educational institutions3in 128 cities participated in the survey, although substantial attrition occurred during question answering (the reasons for which are discussed below). Almost all regions of the country were represented, with most students com-ing from (in descendcom-ing order) Lviv, Kyiv, Ivano-Frankivsk, Kharkiv, Ternopil, and Dnipro. 99.7% of all respondents who indicated the location of their university were Ukrainian students. In some cases, the survey was completed by students who, at the time of answering, were studying abroad, particularly in Poland, Germany or the United States of America. The majority of the respondents were women (83.3%). Most respondents (89.1%) chose the Ukrainian language to complete the online application form (the question-naires were offered in two languages – Ukrainian and Russian)4.
Over the data collection period, more than 15,000 users visited the website, out of which 9,152 started answering the survey questions. However, only 3,034 respondents reached the end of the survey. The high attrition rate is likely due to the following reasons:
(1) Curiosity, but no willingness to participate in the survey: out of the 15,000 visitors of the site, almost 6000 of them did not interact with the questionnaire at all. One thousand seven hundred and sixty-one indicated a language they were comfortable with, but immediately left the questionnaire tab.
(2) Sensitive questions: many respondents dropped out at the questions on personal experience with and/or witnessing questionable behavior. These include “Have you, your friends or relatives ever encountered violations (bribes, gifts, help in answering) when taking the ZNO (the External Independent Exam)?” with 339 drop-outs and “How often have you heard about situations where your friends or relatives solved their problems with a bribe?” with 272 drop-outs.
(3) The length of the questionnaires: during the pilot phase, we observed the duration required forfilling out the questionnaire to be in the range of 7 to 27 minutes. A large number of students appear to have left the survey prematurely due to fatigue.
(4) Technical problems: thanks to comments from Facebook users, we were informed about several issues with video playback in October 2017. Those problems were rapidly solved, but we had 3,017 survey participants who did not return after watching a video. It is not known how many users returned to the questionnaire after encountering technical problems, and how many dropped out because of them. While the latter likely increased attrition rates, this is applicable to all videos; therefore, the experimental design based on randomization into various videos was not jeopardized by this issue. This is corroborated by similar dropout rates while watching the video across treatments that range from 24% to 26.7%, which are not statistically significantly different from each other.
In what follows, we briefly discuss the content of the four exclusively and randomly assigned videos. Three of them are treatments in the sense that they aim at creating awareness about the consequences of corruption, while the fourth, which is presented to the control group, is on modern means of education.
Video 1: “He paid” (duration: 1 minute and 4 seconds)5.
The video is presented as a story told by a child who is shown only at the end of the movie. The boy begins by saying how his mother and father met each other eight years ago: a young man was in a rush early in the morning; he was driving a car and breaking the rules in order not to be late for work. A transport police officer stopped him, but the young man paid a bribe and was not punished. At this occasion, he met a young lady who was also paying a bribe to the same police officer. Later, they both became a couple. The policeman had a son, apparently a very lazy boy, who becomes – thanks to a bribe− a student at a very prestigious medical university and graduates from it. By this time, the couple is expecting a baby and the student is working as a gynecologist. By accident, they all meet in a maternity ward, where the doctor assists the young woman with the delivery. Obviously, the doctor made some professional mistakes and the child suffered a birth trauma. Finally, the storyteller is shown sitting in a wheelchair: he has cerebral palsy and cannot move or talk to his parents. If he was able to talk, he would say to them that, by paying a bribe, they are paying with the future of their children. The video is very emotional; it appeals to the prevalence of endemic corrup-tion in Ukrainian society by showing a worst-case scenario for corrupcorrup-tion in higher education: that unqualified people might get positions where they are responsible for the lives of others. But the message is much broader: both parents have“contributed” to the disability of their child, too, even if indirectly.
Video 2: “About corruption” (duration: 1 minute and 14 seconds)6.
A young lady, a journalist, is making some statements on the recent anti-corruption developments in the country after the Euromaidan 2014 protest move-ment. She refers to the data provided by the Ukrainian subchapter of Transparency
International, an NGO working on corruption worldwide, and cites data from other sociological institutions and the American Chamber of Commerce. The video is much closer to a typical analysis made by TV news channels, with the pragmatic representation of information, some observations and actual statistics. The main message is that, while corruption exists, many countermeasures and remedies have been taken in the country and progress is visible7.
Video 3: “Essays on Ecology” (duration: 1 minute and 38 seconds)8.
The focus of this video is on a young lady, a full-time student in her fourth year majoring in economics. She says that she is now preparing an academic paper for a class on ecology, a discipline that is not part of her core studies. She is going to download a paper for this class from the Internet and submit it as her own. Her justification goes beyond the usual “unnecessary classes” defense: she thinks that nobody will actually read this assignment. Moreover, she already works in herfield. She says, however, that in her initial academic years, she attended all the lectures and completed all the homework assignments, but at one point she realized that there were other tools to do homework, especially for what she calls “bulimia learning”. The video focuses on the legitimacy of academic cheating under certain circumstances.
Video 4: “Modern Education” (duration: 1 minute) (control video)9.
The video shows young people – students – working on computers in multimedia rooms and sitting in university auditoriums listening to an appar-ently fascinating presentation. A young lady describes how innovative the current higher education system is, how much it has to offer and how impor-tant it is for the lives of young people.
Our final evaluation sample is comprised of 3,196 respondents (see also the discussion in Section 3), for some of whom item non-responses occur for a subset of variables. While all of the oblasts of Ukraine are represented, the majority of the respondents were located the Lviv region (26.5%), Kyiv region (20.1%), Dnipro region (6%), Kharkiv region (5.6%) and Ivano-Frankivsk region (5.2%). Most lived in urban areas (77.4%) while 22.2% indicated that they reside in villages and small settlements. Humanities (31.5%), social sciences (26.1%) and technical subjects (24.7%) were the dominant fields of studies, in contrast to natural (7.6%) and medical (9.0%) sciences. 73.3% of respondents studied in a publicly financed program, while 26.4% paid private tuition fees. Eighteen percent of respondents were in thefirst year, 18.8% in the second, 23.2% in the third and 21.3% in the fourth year of their bachelor’s program. 17.6% were enrolled in a master’s pro-gram. 94.7% of respondents were born between 1994 and 2000, i.e. they were 17 to 24 years old at the time of the survey. Interestingly, and somewhat surprisingly, 82% of the respondents were female. While it is common to have a higher percentage of female response rates in surveys (Moore and Tarnai2002; Singer, Van Hoewyk, and Maher2000; Smith2008), the gender difference in participation in our study is likely driven to some extent by the higher share of female students in Ukrainian universities overall and imbalances in enrollment across various
fields. Kogut (2014) points out that 52.3% of all students at Ukrainian universities in the 2013–14 academic year were women, making up 79% in humanities, 77% in social sciences, 74% in medicine, 62% in natural sciences, but only 22% in technical studies.
39.3% of respondents indicated that they live in a student dorm, while 17.5% rent accommodations and the rest live with their parents or in an owned home. 39.5% worked part-time for an average of 6.2 hours per day. Only 3.8% had studied abroad. Interestingly, 21.3% claimed their most com-mon grades to be “excellent”, 44.2% between “good” and “excellent”, 14.6% “good”, 16.7% between “satisfactory” and “good” and only 2.9% to be “satis-factory”. 31.2% of the respondents mentioned “getting a good education” as their main motivation for obtaining a university degree, while 51.1% men-tioned “getting a good job”. Other reasons included “to get a university diploma” (10%), “to please parents” (2.3%) and “because everyone does so” (1.6%). An almost equal number of respondents reported a daily preparatory time of more than 3 hours (31%), 2–3 hours (26.9%), or 1–2 hours (26.8%). 12.2% indicated less than 1 hour per day. Table 1 provides detailed demo-graphic, social and educational characteristics of the respondents.
53.5% indicated that they had never encountered bribery at a university (with only 9.3% claiming that they had not even heard that bribes were accepted at universities), while 19% have encountered it rarely, 13.4% some-times, 7.6% often and 3.6% reported to see it constantly. Concerning non-monetary fraudulent practices, only 16.4% stated that they never use cheat sheets during exams, 51.4% never submit ready-made course papers down-loaded from the Internet as their own and 79.8% never purchase course papers from others. At the same time, only 14.8% indicated that they never copy and paste parts of course papers from the Internet and 13.6% never cheat during tests or exams. Roughly half (49.8%) claimed to have never tried to lie to a teacher when explaining learning-related issues, while 76.3% have never asked a faculty member for preferential treatment. Thesefindings are compar-able to the results obtained by the authors in a face-to-face survey of 600 students from Lviv in 2015 (Denisova-Schmidt, Huber, and Prytula 2015 and
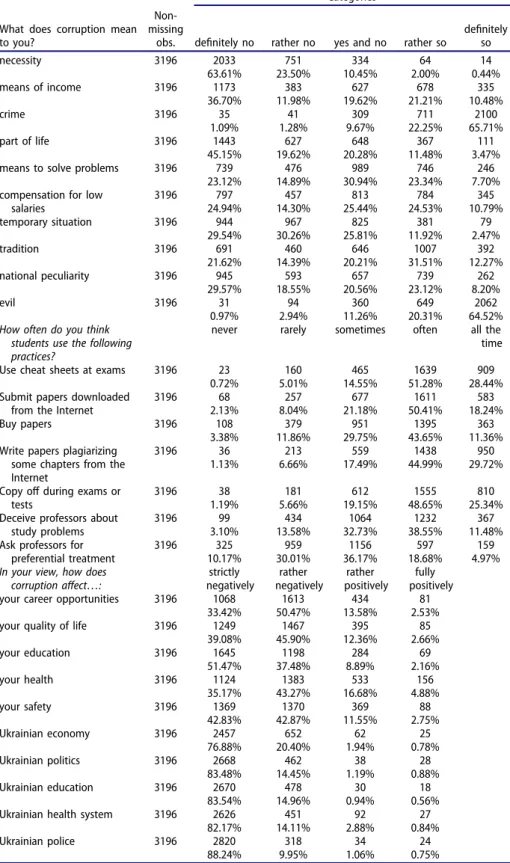
2016a). Table 2 presents the respondents’ experiences with corruption and fraudulent behavior in secondary school, during the university entrance pro-cess and in university, while Table 3 provides descriptive statistics for the outcome variables.10
Our data suggest that students consider corruption to be a predominantly negative phenomenon: 84.83% judged corruption to be something rather“evil” (answering either “rather so” or “definitely so”; see Table 3) and 87.96% to be a“crime”. A large share also saw corruption to be typically “Ukrainian” (a “tradition”, 43.78%, and a‘national peculiarity, 31.32%), considered it “a way of getting income” (31.69%) or a “compensation for low wages” (35.32%), a “temporary situation” (14.39%) and a“part of life” (14.95%). Taking a pragmatic stand, 2.44% found it to
Table 1.Descriptive statistics. Non-missing observations Number of cases % of obser-vations Gender 3148 male 526 16.71% female 2622 83.29% Language 3196 Ukrainian 2848 89.11% Russian 348 10.89%
Form of education 3186 state stipend 2342 73.51%
own costs 844 26.49%
Field of study 3186 humanities 1007 31.61%
social sciences 833 26.15% technical studies 791 24.83% natural sciences 243 7.63% medical science 287 9.01% sports sciences 25 0.78% Study year 3186 first 576 18.08% second 600 18.83% third 741 23.26% forth 680 21.34% fifth 384 12.05% sixth 180 5.65% internship 9 0.28% postgraduate 16 0.50%
Study mode 3186 full-time student 3044 95.54%
part-time student
138 4.33%
external student 4 0.13%
Year of birth 3143 before 1996 683 21.73%
1996 527 16.77%
1997 542 17.24%
1998 589 18.74%
after 1998 802 25.52%
Place of origin 3149 city, more than
1 mln pop 571 18.13% city, 0.5 to 1 mln pop 425 13.50% city, 0.25 to 0.5 mln pop 468 14.86% city, 0.05 to 0.25 mln pop 449 14.26% city, 0.02 to 0.05 mln pop 278 8.83% city, 0.002 to 0.02 mln pop 257 8.16% small city 218 6.92% village 483 15.34%
What are the most frequent marks you get at the university? 3187 satisfactory 93 2.92% between satisfactory and good 534 16.75% good 466 14.62% between good and excellent 1414 44.37% excellent 680 21.34%
How many hours per day do you spend for self-study/homework/preparation to classes?
3186 none 90 2.82%
less than 1 hour 389 12.21%
1-2 hours 856 26.87%
2-3 hours 860 27.00%
more than 3 hours
991 31.10% Income status of the family 3021 enough for food
only
215 7.12%
enough for food and closing
347 11.49% (Continued)
be a“necessity” and 31.04% “a way of solving problems”. Academic dishonesty is widespread among young people. The most common cheating techniques were crib cheats: 95.08% reported using them“sometimes”, “often” or “all the time”; see
Table 3. 93.15% engaged in other types of cheating during exams and tests, and 92.21% wrote term papers by copying and pasting from the Internet without acknowledging the sources. 84.76% reported that they“outsource” their homework to other individuals and organizations, 89.83% have downloaded papers and submit them as their own. 83.32% have given misleading excuses for poor aca-demic performance to faculty members, 59.82% have asked for preferential treat-ment. At the same time, the majority of respondents were concerned that corruption had a rather negative impact on their own career perspectives: 83.89% found it to be“strictly negative” or “rather negative”. A large share also thought corruption negatively affects their own quality of life (84.98%), their own education (88.95%), their own health (78.44%) and their own security (85.70%), as well as more broadly the economy (97.27%), politics (97.93%), education (98.50%), medicine (96.28%) and the police (98.19%) in Ukraine.
Empirical analysis and results
As has already been mentioned, our initial sample was prone to large attrition rates. Out of the 9,152 participants who started the online survey, 2,751 dropped out of the study prior to treatment assignment for the potential
Table 1.(Continued). Non-missing observations Number of cases % of obser-vations not enough for
durable goods 1229 38.29% enough for durable goods 1069 35.38% enough for everything 616 20.39%
Where do you live? 3016 dormitory 1192 39.52%
with parents/ relatives 1177 39.02% rent aflat 531 17.61% ownflat/without parents 116 3.85%
Did you take the External Independent Evaluation before entering?
3196 yes 2750 86.05%
no 446 13.95%
Do you combine your study with job? 3007 do not work 1809 60.16% work and study 1198 39.84%
Study abroad 2998 yes 115 3.84%
no 2883 96.16%
Reasons to get higher education 3187 good education 998 31.31%
good job 1632 51.21%
diploma 321 10.07%
parents 72 2.26%
everyone does it 50 1.57%
reasons given above. Therefore, the treatment was randomly assigned to the remaining 6,401 individuals. However, attrition or item non-response was also substantial after treatment randomization, when measuring the outcome vari-ables: for only 3,196, or roughly half of the observations who were assigned a treatment, all outcomes are observed, while for 3,205 observations at least one outcome is missing. Such post-assignment attrition jeopardizes the con-sistency of the experimental evaluation of treatment effects if it is jointly
Table 2.Respondents’ experience with corruption.
Questions Non-missing observations Categories Yes, I per-sonally Yes, my friends/ (relatives) No, nobody Have you, your friends or relatives
ever encountered violations (situations in admissions commissions, in granting privileges and allocation of quotas, etc.) when entering the university?
3172 265 709 2198
8.35% 22.35% 69.29%
never rarely sometimes. often constantly If you or your parents ever gave
presents to teachers at school (candies, books, computer equipment, etc.), or, for example, paid for voluntary-compulsory tutoring classes with school teachers, how often did it happen?
3252 991 880 832 406 143
30.47% 27.06% 25.58% 12.48% 4.40%
Have you ever heard that bribes are taken or given in the higher education institution?
3172 296 395 799 981 701
9.33% 12.45% 25.19% 30.93% 22.10% Have you ever heard of the
situations when your friends or relatives solved their problems by pulling strings?
3172 438 675 1115 723 221
13.81% 21.28% 35.15% 22.79% 6.97%
How often have you heard about cases when your friends or relatives solve their problems by bribe?
3172 380 755 1010 812 215
11.98% 23.80% 31.84% 25.60% 6.78%
How often do you use the following practices:
Use cheat sheets at exams 3100 525 951 916 525 183
16.94% 30.68% 29.55% 16.94% 5.90% Submit papers downloaded from
the Internet
3100 1642 798 427 186 47
52.97% 25.74% 13.77% 6.00% 1.52%
Buy papers 3100 2550 293 160 72 25
82.26% 9.45% 5.16% 2.32% 0.81% Write papers plagiarizing some
chapters from the Internet
3100 474 785 819 729 293
15.29% 25.32% 26.42% 23.52% 9.45% Copy off during exams or tests 3100 435 1037 907 544 177
14.03% 33.45% 29.26% 17.55% 5.71% Deceive professors about study
problems
3100 1592 872 428 155 53
51.35% 28.13% 13.81% 5.00% 1.71% Ask professors for preferential
treatment
3100 2437 427 180 45 11
75.71% 13.77% 5.81% 1.45% 0.35% Have you ever personally
encountered bribery at a university?
3100 1709 606 428 243 114
Table 3.Respondents’ attitudes/opinions toward corruption after the treatment. Categories
What does corruption mean to you?
Non-missing
obs. definitely no rather no yes and no rather so
definitely so necessity 3196 2033 751 334 64 14 63.61% 23.50% 10.45% 2.00% 0.44% means of income 3196 1173 383 627 678 335 36.70% 11.98% 19.62% 21.21% 10.48% crime 3196 35 41 309 711 2100 1.09% 1.28% 9.67% 22.25% 65.71% part of life 3196 1443 627 648 367 111 45.15% 19.62% 20.28% 11.48% 3.47%
means to solve problems 3196 739 476 989 746 246
23.12% 14.89% 30.94% 23.34% 7.70% compensation for low
salaries 3196 797 457 813 784 345 24.94% 14.30% 25.44% 24.53% 10.79% temporary situation 3196 944 967 825 381 79 29.54% 30.26% 25.81% 11.92% 2.47% tradition 3196 691 460 646 1007 392 21.62% 14.39% 20.21% 31.51% 12.27% national peculiarity 3196 945 593 657 739 262 29.57% 18.55% 20.56% 23.12% 8.20% evil 3196 31 94 360 649 2062 0.97% 2.94% 11.26% 20.31% 64.52% How often do you think
students use the following practices?
never rarely sometimes often all the time
Use cheat sheets at exams 3196 23 160 465 1639 909
0.72% 5.01% 14.55% 51.28% 28.44% Submit papers downloaded
from the Internet
3196 68 257 677 1611 583
2.13% 8.04% 21.18% 50.41% 18.24%
Buy papers 3196 108 379 951 1395 363
3.38% 11.86% 29.75% 43.65% 11.36% Write papers plagiarizing
some chapters from the Internet
3196 36 213 559 1438 950
1.13% 6.66% 17.49% 44.99% 29.72% Copy off during exams or
tests
3196 38 181 612 1555 810
1.19% 5.66% 19.15% 48.65% 25.34% Deceive professors about
study problems
3196 99 434 1064 1232 367
3.10% 13.58% 32.73% 38.55% 11.48% Ask professors for
preferential treatment
3196 325 959 1156 597 159
10.17% 30.01% 36.17% 18.68% 4.97% In your view, how does
corruption affect…: strictly negatively rather negatively rather positively fully positively
your career opportunities 3196 1068 1613 434 81
33.42% 50.47% 13.58% 2.53%
your quality of life 3196 1249 1467 395 85
39.08% 45.90% 12.36% 2.66% your education 3196 1645 1198 284 69 51.47% 37.48% 8.89% 2.16% your health 3196 1124 1383 533 156 35.17% 43.27% 16.68% 4.88% your safety 3196 1369 1370 369 88 42.83% 42.87% 11.55% 2.75% Ukrainian economy 3196 2457 652 62 25 76.88% 20.40% 1.94% 0.78% Ukrainian politics 3196 2668 462 38 28 83.48% 14.45% 1.19% 0.88% Ukrainian education 3196 2670 478 30 18 83.54% 14.96% 0.94% 0.56%
Ukrainian health system 3196 2626 451 92 27
82.17% 14.11% 2.88% 0.84%
Ukrainian police 3196 2820 318 34 24
influenced by the treatment and background characteristics that also affect the outcomes. This issue is known as Heckman-type sample selection (see for instance Heckman 1979) in economics or collider bias in statistics.
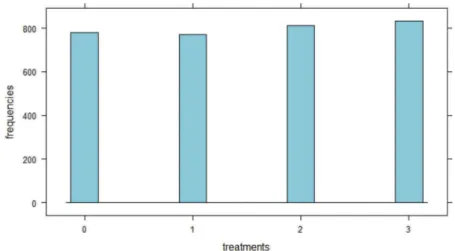
To investigate whether attrition is selective with regard to the treatment,
Figure 1displays the frequencies of treatments among observations for whom all outcomes are observed. The treatment distribution appears to roughly follow a uniform distribution as expected under random assignment with constant treatment probabilities. In fact, the p-value of a chi2 test on di ffer-ences in the frequencies is 0.393, such that the uniform distribution cannot be rejected at any conventional level of significance in the sample without miss-ing outcomes. As a second check for the selectivity of attrition, we create a binary indicator, which is 1 if at least one outcome is missing and 0 if all outcomes are observed and regress it on the treatment dummies. Table 4
presents the results. We do notfind a statistically significant effect of the first video (“He paid”) on attrition when compared to the control group, such that attrition appears to be random with regard to thefirst treatment. Videos 2 and 3, however, statistically significantly (at the 5% level) reduce attrition by roughly 4% points, which may cause selectivity bias if attrition induces back-ground characteristics to be imbalanced across treatments.
Figure 1.Treatment frequencies among observations with observed outcomes. Note: 0 is control, 1 is treatment“he paid”, 2 “about corruption”. 3 “essays on ecology”.
Table 4.Treatment effects on attrition and nonresponse.
est se pval
constant (average attrition for control group with education treatment) 0.52 0.01 0.00
treatment he paid −0.01 0.02 0.72
treatment about corruption −0.04 0.02 0.04
treatment ecology −0.04 0.02 0.02
Note: OLS regression with binary attrition indicator as dependent variable.“est”, “se” and “pval” report the coefficients, heteroscedasticity robust standard errors, and p-values, respectively.
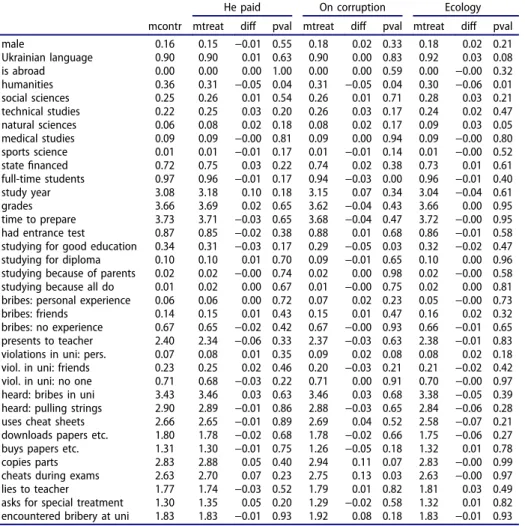
Table 5therefore presents balance tests that compare the means of observed covariates across different treatments in the absence of attrition. It thus allows the investigation of selectivity with regard to observed covariates by checking whether the treatments are (still) balanced when considering only cases with non-missing values in the outcomes and covariates. If this is the case and the covariates either include or behave (in terms of attrition) like the background characteristics affecting the outcome, then the effects of the treatments are consistently estimated for sample without attrition– i.e. they are internally valid (see the discussion in Huber 2012). We use two-sample t-tests for pairwise comparisons of the covariate means of each treatment with the control group andfind that only few variables are statistically significantly different at the 5% level: Studying humanities is significant for all treatments, studying natural science is significant for the third video (ecology), while studying as full-time
Table 5.Covariate balance across treatments.
He paid On corruption Ecology mcontr mtreat diff pval mtreat diff pval mtreat diff pval
male 0.16 0.15 −0.01 0.55 0.18 0.02 0.33 0.18 0.02 0.21 Ukrainian language 0.90 0.90 0.01 0.63 0.90 0.00 0.83 0.92 0.03 0.08 is abroad 0.00 0.00 0.00 1.00 0.00 0.00 0.59 0.00 −0.00 0.32 humanities 0.36 0.31 −0.05 0.04 0.31 −0.05 0.04 0.30 −0.06 0.01 social sciences 0.25 0.26 0.01 0.54 0.26 0.01 0.71 0.28 0.03 0.21 technical studies 0.22 0.25 0.03 0.20 0.26 0.03 0.17 0.24 0.02 0.47 natural sciences 0.06 0.08 0.02 0.18 0.08 0.02 0.17 0.09 0.03 0.05 medical studies 0.09 0.09 −0.00 0.81 0.09 0.00 0.94 0.09 −0.00 0.80 sports science 0.01 0.01 −0.01 0.17 0.01 −0.01 0.14 0.01 −0.00 0.52 statefinanced 0.72 0.75 0.03 0.22 0.74 0.02 0.38 0.73 0.01 0.61 full-time students 0.97 0.96 −0.01 0.17 0.94 −0.03 0.00 0.96 −0.01 0.40 study year 3.08 3.18 0.10 0.18 3.15 0.07 0.34 3.04 −0.04 0.61 grades 3.66 3.69 0.02 0.65 3.62 −0.04 0.43 3.66 0.00 0.95 time to prepare 3.73 3.71 −0.03 0.65 3.68 −0.04 0.47 3.72 −0.00 0.95 had entrance test 0.87 0.85 −0.02 0.38 0.88 0.01 0.68 0.86 −0.01 0.58 studying for good education 0.34 0.31 −0.03 0.17 0.29 −0.05 0.03 0.32 −0.02 0.47 studying for diploma 0.10 0.10 0.01 0.70 0.09 −0.01 0.65 0.10 0.00 0.96 studying because of parents 0.02 0.02 −0.00 0.74 0.02 0.00 0.98 0.02 −0.00 0.58 studying because all do 0.01 0.02 0.00 0.67 0.01 −0.00 0.75 0.02 0.00 0.81 bribes: personal experience 0.06 0.06 0.00 0.72 0.07 0.02 0.23 0.05 −0.00 0.73 bribes: friends 0.14 0.15 0.01 0.43 0.15 0.01 0.47 0.16 0.02 0.32 bribes: no experience 0.67 0.65 −0.02 0.42 0.67 −0.00 0.93 0.66 −0.01 0.65 presents to teacher 2.40 2.34 −0.06 0.33 2.37 −0.03 0.63 2.38 −0.01 0.83 violations in uni: pers. 0.07 0.08 0.01 0.35 0.09 0.02 0.08 0.08 0.02 0.18 viol. in uni: friends 0.23 0.25 0.02 0.46 0.20 −0.03 0.21 0.21 −0.02 0.42 viol. in uni: no one 0.71 0.68 −0.03 0.22 0.71 0.00 0.91 0.70 −0.00 0.97 heard: bribes in uni 3.43 3.46 0.03 0.63 3.46 0.03 0.68 3.38 −0.05 0.39 heard: pulling strings 2.90 2.89 −0.01 0.86 2.88 −0.03 0.65 2.84 −0.06 0.28 uses cheat sheets 2.66 2.65 −0.01 0.89 2.69 0.04 0.52 2.58 −0.07 0.21 downloads papers etc. 1.80 1.78 −0.02 0.68 1.78 −0.02 0.66 1.75 −0.06 0.27 buys papers etc. 1.31 1.30 −0.01 0.75 1.26 −0.05 0.18 1.32 0.01 0.78 copies parts 2.83 2.88 0.05 0.40 2.94 0.11 0.07 2.83 −0.00 0.99 cheats during exams 2.63 2.70 0.07 0.23 2.75 0.13 0.03 2.63 −0.00 0.97 lies to teacher 1.77 1.74 −0.03 0.52 1.79 0.01 0.82 1.81 0.03 0.49 asks for special treatment 1.30 1.35 0.05 0.20 1.29 −0.02 0.58 1.32 0.01 0.82 encountered bribery at uni 1.83 1.83 −0.01 0.93 1.92 0.08 0.18 1.83 −0.01 0.93 Note:“mcontr”: mean of control group (education treatment); “mtreat”: mean of respective treatment; “diff”:
mean difference; “pval”: p-value of mean difference based on a two-sample t-test allowing for heteroscedas-ticity. Regional dummies are omitted.
students, studying for a good education, and cheating during exams are sig-nificant for the second video (about corruption). Given the large amount of covariate-treatment combinations tested, the few statistically significant differ-ences do not point to important covariate imbalances after attrition.
Ourfindings about nonselective attrition are also corroborated when using a machine learning-based test to investigate the joint balance of all covariates together, separately for each treatment-control comparison. To this end, we apply an approach suggested by Ludwig, Mullainathan, and Spiess (2017). It is based on the intuition that the problem of obtaining too many significant differences when testing multiple hypotheses (e.g. differences in multiple covariates across treatments), or false positives, is similar to the concern of overfitting in machine learning, or including too many regressors when pre-dicting a variable. In our case, the question is whether the treatment can be predicted by the covariates, which would point to imbalances.
We thus follow Ludwig, Mullainathan, and Spiess (2017), who propose applying the machine learning logic to the context of multiple testing, and split our data into training and testing data. In the training data, we run a lasso logit regression of the respective treatment (vs. control) on the covariates using the “rlogit” command with its default values in the “hdm” package by Chernozhukov, Hansen, and Spindler (2015) for the statistical software“R”. We then use the obtained coefficients for predicting the treatment in the test data and compare the prediction to the actual treatment to compute the mean-squared error. We usefivefold cross-validation, such that the roles of training and test data are swapped, and take the average of the five mean-squared errors obtained (in order to reduce its variance). In a next step, we randomly relabel (or permute) the treatment variables and re-estimate the MSE using the same procedure; see Ludwig, Mullainathan, and Spiess (2017). Repeating the permutation 999 times, we compute the p-value for the joint significance of the covariates as the share of permutation-based MSEs that are lower than the MSE with the correct coding of the treatment. The permutation test’s intuition is that if the covariates are balanced across treatments, relabeling the latter will not seriously affect (i.e. increase) the MSE. If, on the other hand, covariates are predictive for the treatment, then the correct coding of the treatment should entail a smaller MSE than the permuted versions.
The first line inTable 6 provides the results of the machine learning-based test for assessing the joint balance of all covariates separately for each
Table 6.P-values of machine learning-based tests.
Paid Corruption Ecology Paid/corruption vs. ecology/education(control)
covariates 0.53 0.37 0.10 0.97
outcomes 0.00 0.52 0.92 0.00
Note:“covariates”: provides the p-values of machine learning-based tests (following Ludwig, Mullainathan, and Spiess2017) of joint covariate associations with the respective treatment;“outcomes”: provides the p-values of machine learning-based tests of joint outcome associations with the respective treatment.
treatment-control comparison. For thefirst and third video, the null hypothesis is not rejected at any conventional level of significance (with p-values of 53% and 37%, respectively), while for the second video, the differences in covariates are marginally significant at the 10%, but not at the 5% level. Finally, a joint test over all treatments, which is obtained by arranging the four treatments into two groups (first and second video vs. third video and control group), yields again a p-value far beyond any conventional level of significance. Our overall conclusion thus is that despite substantial outcome attrition, covariates are decently balanced across treatment states such that causal inference is likely internally valid for the observations among which the treatments were randomized.
We subsequently analyze the effects of the various treatments on the out-comes of interest. Due to the large amount of outcome variables considered, we are confronted with similar multiple hypothesis testing issues as previously discussed for checking covariate balance. To jointly test whether some treat-ment (compared to the control group) has an effect on any of the outcomes considered, we again apply the machine learning-based test of Ludwig, Mullainathan, and Spiess (2017) outlined above. However, the causal order of the treatment and outcomes is reversed in the lasso regression: it is the treatment that is regressed on all outcome variables, rather than the other way around. The intuition is that if the treatment affects some of the outcomes considered, then some of the lasso coefficients are non-negligibly different from zero and the MSE with the original labeling of the treatment is again likely lower than under-permuted treatment labels. The second line ofTable 6
presents the testing results for pairwise comparisons of each treatment with the control group. We find that the first video (“He paid”) statistically signifi-cantly affects the outcome variables with a p-value that is essentially zero. In contrast, the p-values for the second and third video are beyond any conven-tional level of significance such that the null that these videos do not affect the outcomes cannot be rejected. Finally, when running a joint test for all treat-ments by grouping them into two categories (first and second video vs. third video and control group), we obtain again a p-value close to zero. This indicates that the treatments jointly affect the joint distribution of the out-comes, but this effect appears to be entirely driven by the first video.
Table 7provides the experimental treatment effect estimates separately for each of the outcomes based on two-sample t-tests of mean differences between the respective treatment and control groups. When interpreting the results, we, however, bear in mind that our survey sample is not representative for the Ukraine as a whole, because some demographic groups like females are heavily overrepresented, see Section 2. Wefind that the first video (“He paid”) statistically significantly modifies several attitudes toward corruption: the trea-ted more often believe that corruption is a“crime” and “evil” (significant at the 5% and 1% levels, respectively), has a negative impact on one’s health,
security, the health-care system (all significant at the 1% level), and the economy of Ukraine (significant at the 10% level). Furthermore, those exposed to thefirst video report less often that corruption is a “means to earn money” (significant at the 1% level) and believe more often that corruption is a “compensation for low salaries” (significant at the 10% level). Hence, this video has the largest impact among any intervention and induces a more negative view of corruption overall.
The second video (“About corruption”) shows some individual effects espe-cially on attitudes toward corruption, although we acknowledge that they could be spurious due to multiple testing (as the joint test on all outcomes presented above was not statistically significant). Individuals exposed to the video more often reported that corruption is “a necessity” and “a way of solving problems” (significant at the 1% level), “a compensation for low salaries” (significant at the 5% level), “a part of life” and “a temporary phenom-enon” (significant at the 10% level) and also that it has a generally positive influence on education in Ukraine (significant at the 10% level). The treatment also decreases the view that corruption is a“national peculiarity” (significant at the 5% level). Taken at face value, the results for the second video bear similarities with those obtained in Denisova-Schmidt, Huber, and Prytula (2015, 2016a) and Corbacho et al. (2016), where an exposure to information on the spread of corruption had a promoting effect (i.e. “corruption corrupts”). For the third video,“Essays on Ecology”, we find only a handful of significant effects, namely negative impacts on the view that corruption is “a crime” and “evil” (significant at the 5% level) and positive impacts on the judgment that
Table 7.Treatment effects (mean differences).
He paid On corruption Ecology mcontr est se pval est se pval est se pval corruption is a necessity 1.49 −0.03 0.04 0.51 0.14 0.04 0.00 0.07 0.04 0.07 . . . is a means to earn money 2.59 −0.21 0.07 0.00 0.04 0.07 0.56 0.11 0.07 0.13 . . . is a crime 4.50 0.09 0.04 0.03 −0.04 0.04 0.33 −0.09 0.04 0.03 . . . is a part of life 2.04 0.05 0.06 0.40 0.11 0.06 0.06 0.04 0.06 0.49 . . . way of solving problems 2.72 −0.05 0.06 0.43 0.16 0.06 0.01 0.09 0.06 0.15 . . . compensation for low salaries 2.75 0.12 0.07 0.07 0.15 0.07 0.02 0.03 0.07 0.63 . . . temporary phenomenon 2.26 −0.03 0.05 0.63 0.09 0.05 0.08 0.03 0.05 0.53 . . . tradition 2.99 −0.02 0.07 0.75 −0.05 0.07 0.45 0.01 0.07 0.94 . . . national peculiarity 2.65 0.01 0.07 0.86 −0.13 0.07 0.05 −0.03 0.07 0.61 . . . evil 4.43 0.16 0.04 0.00 −0.00 0.04 0.94 −0.11 0.05 0.02 . . . influences my career 1.82 0.05 0.04 0.20 0.03 0.04 0.39 0.06 0.04 0.12 . . . my quality of life 1.77 0.01 0.04 0.83 0.03 0.04 0.43 0.05 0.04 0.21 . . . my education 1.61 −0.03 0.04 0.41 0.02 0.04 0.56 0.05 0.04 0.17 . . . my health 1.92 −0.15 0.04 0.00 0.02 0.04 0.68 0.10 0.04 0.01 . . . my security 1.78 −0.13 0.04 0.00 −0.04 0.04 0.32 0.02 0.04 0.54 . . . influences Ukrainian economy 1.28 −0.04 0.03 0.08 −0.01 0.03 0.73 0.01 0.03 0.57 . . . Ukrainian politics 1.18 −0.01 0.02 0.67 0.02 0.02 0.40 0.04 0.02 0.11 . . . Ukrainian education 1.17 0.01 0.02 0.56 0.04 0.02 0.09 0.02 0.02 0.46 health care system in Ukraine 1.24 −0.08 0.03 0.00 0.02 0.03 0.43 −0.01 0.03 0.61 . . . Ukrainian law-enforcement system 1.13 −0.00 0.02 1.00 0.01 0.02 0.59 0.03 0.02 0.23 Note:“mcontr”: mean of control group (education treatment); “est”: estimated effect (mean difference); “se”:
corruption is “a necessity” (significant at the 10% level) and on the health conditions of respondents. However, these comparably few effects are likely spurious and due to the large number of hypotheses tested, which is sup-ported by the fact that the joint significance test presented in Table 6yields a p-value close to one.
Our results thus suggest that the way the negative consequences of corrup-tion are presented matters for the impact of the intervencorrup-tion. While the rather formal discussion of corruption in the second and third videos did not show sizable effects, the personal story told in the first video appeared to have created an impact on attitudes toward corruption. This is in line with “the identifiable victim effect” (Schelling 1968), implying that a single victim with a name, a picture and a story behind her or his tragedy can have an important impact. This suggests that individuals are frequently affected by strong emo-tions and feelings in their judgments and decisions rather than by analytical considerations (Jenni and Loewenstein1997; Tehila and Ilana Ritov2005; Slovic
2007; Small Deborah, Loewenstein, and Slovic 2007; Genevsky et al. 2013; Seyoung and Feeley 2016). An example in this context is the EU Tobacco Products Directive (2014), requiring tobacco producers to put shock pictures of personalized victims of smoking on their products in addition to health warning information. Indeed, the German Agency for Health Education (Bundeszentrale für gesundheitliche Aufklärung (BZgA)) reports a significant increase in the number of calls to their dedicated hotline on health risks associated with tobacco consumption – from 1,000 per month before the new directive to 5,700 after the introduction of the directive (Korte 2017). Furthermore, the aerospace industry has used authentic pictures of airplane crashes to promote responsible behavior among employees by showing them the consequences of not taking safety issues seriously. Finally, in the context of the Syrian war, Slovic et al. (2017) argue that the picture of Aylan Kurdi (Shenu), a Syrian child found lying dead on a Turkish beach in early September 2015 Aylan Kurdi, created more attention about the conflict than statistical reports of hundreds of thousands of deaths.
As a robustness check, Table A1 of the appendix presents the effect esti-mates when controlling for differences in covariates across treatment and control groups in a data-driven way. To this end, we apply the machine learning approach implemented in the “lassoATE” command (with default values) in the“hdm” package by Chernozhukov, Hansen, and Spindler (2015) for the statistical software “R”. This procedure selects all the covariates either importantly affecting the treatment or the respective dependent variable by (double) lasso regression and uses them as control variables when estimating average treatment effects. Due to the a-priori decent covariate balance in our evaluation sample (seeTables 5and 6), the results obtained by this approach are almost identical to the mean differences presented inTable 7.
Finally, we investigate whether effects are heterogeneous across specific background characteristics for two negatively loaded outcomes, namely “corrup-tion is a crime” and “corruption is evil”. The background characteristics of interest include gender, study program, program statefinanced, study year, grades, time to prepare, entrance test and reasons for studying, as well as questions concern-ing experience with bribery and cheatconcern-ing asked prior to treatment assignment. We again use a machine learning approach to analyze effect heterogeneity: We split our evaluation data into a training sample corresponding to 75% of the observations and a test sample (25%). In the training data, we train a random forest for evaluating conditional (rather than average) treatment effects given the observed background characteristics using the “causal_forest” command (with default values) of the“grf” package by Tibshirani et al. (2018). For each observa-tion in the test data, we predict the condiobserva-tional treatment effects and use the latter as outcomes in a lasso regression on the background characteristics based on the “rlasso” command in the “hdm” package. This allows finding the best predictors of the conditional treatment effects and thus the drivers of effect heterogeneity (if any) across individuals. Table A2 of the appendix reports the (so-called post-lasso) OLS coefficients when regressing the conditional treatment effects on the lasso-selected background characteristics in the test data, sepa-rately for each video-control comparison. We note that only coefficients with an absolute value larger than or equal to 0.01 (or 1% point) are reported. According to this analysis, wefind that, in general, personal cheating and bribing behavior, the field of studies and the study year are the relatively most important pre-dictors of heterogeneity for the various treatments. However, in absolute terms, the magnitude of effect heterogeneity is often limited.
Conclusion and current debates
“The key question currently driving innovations in corruption studies is why anti-corruption reforms do not work” (Ledeneva, Bratu, and Köker2017, 1). To explain this challenge, scholars and practitioners often cite the difficulty in defining and measuring corrupt practices as well as in designing and imple-menting anti-corruption interventions (see the recent discussions in Ledeneva
2009, 2018; Marquette and Pfeiffer2015; Ledeneva, Bratu, and Köker2017) as the main reasons.
Defining and measuring corrupt practices
Our data point to substantial academic corruption among students in Ukraine: about 90% of respondents were involved, to differing extents, in various types of cheating, plagiarism and other forms of academic misconduct. At the same time, a majority judged corruption to negatively affect the economy, politics, education, health and the police in Ukraine. Furthermore, many perceived
corruption to be an impediment to their own career opportunities, quality of life, education, health, and safety. For many respondents, corruption seems to be an ambivalent phenomenon: most students considered corruption to be a“crime” and “evil”, but also “a tradition”, “a way of solving problems” and “a compensation for low salaries”. This is crucial because it might lead to the failure of anti-corruption measures and/or make all remedies less substantial.
Designing and implementing anti-corruption interventions
Social media seem to be the most adequate tool for addressing the rising generation in terms of audience size and effects. Inspired by our previous experiments (Denisova-Schmidt, Huber, and Prytula 2015; Denisova-Schmidt, Huber, and Leontyeva2016a), we decided to continue our research to answer the question: are anti-corruption educational campaigns indeed ineffective or even counterproductive, or can they importantly affect attitudes in a socially desirable way? In order to do so, we redesigned our approach. Previously, we relied solely upon printed materials, including a folder with information about the negative effects of corruption based on materials designed by Transparency International (TI) for the treatment group and a folder with irrelevant information for the control group. The current generation of uni-versity students has grown up under different circumstances, however, with digital media playing an increasingly important role in their everyday lives. Would the results be different if we had integrated more digital materials, such as short videos? Would a larger sample have made a significant difference? Hence, we expanded our treatment materials by integrating three short videos and expanding our sample through social media to 15,000 respondents (hav-ing included“only” 600 in our first experiment).
Indeed, we found that one out of the three videos on corruption promoted a more negative attitude toward corruption when compared to the control group. The video showed (a.) how a student who obtained a medical degree through bribes and other fraudulent means became an unqualified physician whose mis-take led to the disability of a newborn child and (b.) how a person paying a bribe to a police officer might thus indirectly contribute to a system that endangers the health of one’s own children. Respondents exposed to this video more often judged corruption to be a crime and evil and to have a negative impact on one’s health, security, the health-care system, and the Ukrainian economy. The other two videos conveyed a less emotional message but reported information on corruption in a way that resembles TV news reporting or documentaries. Specifically, the second video presented statistics and information about counter-measures against corruption, while the third one discussed the legitimacy of academic cheating under certain circumstances. If anything, these two videos (and in particular the second one) appeared to promote rather than reduce awareness about the existence of corruption, although the comparably few
statistically significant effects might be spurious due to multiple hypothesis test-ing. Our results thus suggest that presenting corruption issues in a catchy way, e.g. by means of a thrilling story that includes commonly known issues like bribing police officers, can be more effective for creating awareness about its negative consequences among students than a rational discussion of facts and figures. However, as a word of caution when interpreting our results, we acknowledge that the survey data underlying our experiment are not representative for the whole of Ukraine, as e.g. females and specific regions are substantially oversampled.
Future trends
The way students experience and perceive corruption – its techniques, fre-quency, and acceptance – will likely go on to affect their professional and personal lives. Therefore, the potential damage of“pro-corrupt” socialization to the economy and to social cohesion can hardly be underestimated (cf. Josephson Institute of Ethics 2009; Cohn, Fehr, and Maréchal 2014). Previous research on corruption and fraudulent behavior related to higher education suggests that it is possible to influence attitudes toward corruption even in endemically corrupt environments if the remedies are focused on specific practices rather than onfighting corruption in general and if the tools applied are suitable for the targeted audience (see for instance Denisova-Schmidt, Huber, and Prytula 2015, 2016a; Denisova-Schmidt 2017; Shekshnia, Ledeneva and Denisova-Schmidt 2017). As the results in this paper suggest, one promising intervention for this age group might be educational cam-paigns accessed via social media that aim at creating a strong personal identification and “identifiable victim effects” (Schelling 1968) that allow the negative consequences of corruption to be related to a concrete victim. Moreover, this type of anticorruption intervention is not only easy to imple-ment but also affordable, one of the main concerns of many experts claiming that too much is spent on anti-corruption measures in the public sector rather than on providing financial support for those working within (Stepurko et al.
2015a,2015b).
Notes
1. Mass-population surveys in Ukraine regularly conducted within the context of the “Region, Nation and Beyond. An Interdisciplinary and Transcultural Reconceptualization of Ukraine” project on behalf of the University of St. Gallen (HSG), Switzerland (see the project description and survey methodology here: http://www.uaregio.org/en/about/ stage-1/).
2. “Ten Faces of Corruption”, a cartoon series developed by Transparency International
Russia as part of the educational project“The Alphabet of a Corruption Fighter”.
3. According to Ukrainian government statistics (http://www.ukrstat.gov.ua/), there were 657 higher education institutions in Ukraine at the time of the survey.
4. Given the fact that Ukrainian is the official language of instruction in all higher education institutions in Ukraine, and that a significant portion of respondents are from Western Ukraine, where only 1% of the young population speaks Russian at home (cf. Radio Svobody2019), the percentage of respondents who chose Ukrainian for the survey seems reasonable.
5. The rights holder (315film) granted us permission for the noncommercial use of the video.
6. https://drive.google.com/open?id=0B6jejFxVSMf0TE1jdURfVldyVTg.
7. At the time of shooting video 2 (mid-to-late 2016), there were already visible signs of progress in fighting corruption in Ukraine that included (i) the introduction of a transparent government electronic procurement system, ProZorro, which saved billions of hryvnas from the budget, (ii) the reformation and introduction of corporate governance in main state enterprises, including Naftogaz, the biggest state enter-prise, which made it profitable (iii) the introduction of electronic declarations for state servants, (iv) the introduction of anti-corruption agencies, (v)“new patrol police”, etc. As pointed out in the policy report prepared by Andrii Marusov (2016), the Head of the Board of Transparency International Ukraine, “During 2014–2016 Ukraine has greatly progressed in itsfight against corruption: a new institutional framework was established and anticorruption instruments were launched.”
8. https://drive.google.com/open?id=0B6jejFxVSMf0UWNWYmNtUFB6RkU.
9. https://drive.google.com/open?id=0B6jejFxVSMf0YVdhdmpQa2ptZUE.
10. We find that experiences with corruption and fraudulent behavior in secondary school and during the university entrance process importantly predict the own cheating practices in university in the control group (video 4): Conditional on various student characteristics (gender, language, region, field of studies, public/private funding, fulltime or not, grades, time spent for preparation, participation in the external independent evaluation, and the reasons for studying), such experiences statistically significantly predict (at the 5% level) 87,5% of own practices, according to joint F-tests for all experience variables. Such experiences to a lesser extent also predict attitudes to corruption, see the outcome variables inTable 7. In this case, 30% of the F-tests are significant at the 5% level.
Acknowledgments
This study was conducted with financial support provided by the Center for Governance and Culture in Europe at the University of St.Gallen (HSG), Switzerland. The sponsor influenced neither the research design nor the interpretation of the results.
Disclosure statement
No potential conflict of interest was reported by the authors.
Funding
This work was supported by Center for Governance and Culture in Europe at the University of St.Gallen (GCE-HSG), Switzerland.
ORCID
Elena Denisova-Schmidt http://orcid.org/0000-0001-8234-4437
Martin Huber http://orcid.org/0000-0002-8590-9402
Yaroslav Prytula http://orcid.org/0000-0003-1791-5832
References
Armantier, O., and A. Boly.2011.“A Controlled Field Experiment on Corruption.” European Economic Review 55 (8): 1072–1082. doi:10.1016/j.euroecorev.2011.04.007.
Armantier, O., and A. Boly.2013.“Comparing Corruption in the Laboratory and in the Field in Burkina Faso and in Canada.” The Economic Journal 123 (573): 1168–1187. doi:10.1111/ ecoj.12019.
Åslund, A. 2009. How Ukraine Became a Market Economy and Democracy. Washington: Peterson Institute for International Economics.
Åslund, A. 2014a. “The Maidan and Beyond: Oligarchs, Corruption, and European Integration.” Journal of Democracy 25 (3): 64−73. doi:10.1353/jod.2014.0055.
Åslund, A.2014b. “Why Ukraine Is so Poor, and What Could Be Done to Make It Richer.” Eurasian Geography and Economics 3: 236−246.
Åslund, A.2015. Ukraine: What Went Wrong and How to Fix It. Washington: Peterson Institute for International Economics.
Balmaceda, M. M. 2013. Politics of Energy Dependency: Ukraine, Belarus, and Lithuania between Domestic Oligarchs and Russian Pressure. Toronto: University of Toronto Press. Barr, A., and D. Serra.2010.“Corruption and Culture: An Experimental Analysis.” Journal of
Public Economics 94 (11–12): 862–869. doi:10.1016/j.jpubeco.2010.07.006. Bretag, T., ed.2016. Handbook of Academic Integrity. Singapore: Springer Singapore. Čábelková, I., and J. Hanousek. 2004. “The Power of Negative Thinking: Corruption,
Perception and Willingness to Bribe in Ukraine.” Applied Economics 36: 383–397. doi:10.1080/00036840410001674303.
Chapman, D. W., and S. Lindner.2016.“Degrees of Integrity: The Threat of Corruption in Higher Education.” Studies in Higher Education 41 (2): 247–268. doi:10.1080/03075079.2014.927854. Chernozhukov, V., C. Hansen, and M. Spindler.2015. Hdm: High-dimensional Metrics. Cornell
University: Package for the statistical software R.https://arxiv.org/abs/1603.01700
Cohn, A., E. Fehr, and M. A. Maréchal.2014.“Business Culture and Dishonesty in the Banking Industry.” Nature 516: 86–89. doi:10.1038/nature13977.
Corbacho, A., D. W. Gingerich, V. Oliveros, and M. Ruiz-Vega. 2016. “Corruption as a Self-Fulfilling Prophecy: Evidence from a Survey Experiment in Costa Rica.” American Journal of Political Science 60 (4): 1077–1092. doi:10.1111/ajps.12244.
Denisova-Schmidt, E.2017. The Challenges of Academic Integrity in Higher Education: Current Trends and Outlook. CIHE Perspectives. Vol. 5. Boston: Boston College.
Denisova-Schmidt, E.2018.“Corruption, the Lack of Academic Integrity and Other Ethical Issues in Higher Education: What Can Be Done within the Bologna Process?” In European Higher Education Area: The Impact of past and Future Policies, edited by A. Curaj, L. Deca, and R. Pricopie, 61−75. Chem: Springer.
Denisova-Schmidt, E.2019.“Corruption in Higher Education.” In Encyclopedia of International Higher Education Systems and Institutions, edited by P. Teixeira, Nuno, and J.-C. Shin. Amsterdam: Springer Netherlands.
Denisova-Schmidt, E., M. Huber, and E. Leontyeva.2016a.“Do Anti-Corruption Educational Campaigns Reach Students? Some Evidence from Two Cities in Russia and Ukraine.”