HAL Id: hal-00667401
https://hal.archives-ouvertes.fr/hal-00667401
Submitted on 7 Feb 2012HAL is a multi-disciplinary open access archive for the deposit and dissemination of sci-entific research documents, whether they are pub-lished or not. The documents may come from teaching and research institutions in France or abroad, or from public or private research centers.
L’archive ouverte pluridisciplinaire HAL, est destinée au dépôt et à la diffusion de documents scientifiques de niveau recherche, publiés ou non, émanant des établissements d’enseignement et de recherche français ou étrangers, des laboratoires publics ou privés.
SIMULATION OF FOREST FIRE SPREAD
Bahaa Nader, Jean Baptiste Filippi, Paul-Antoine Bisgambiglia
To cite this version:
Bahaa Nader, Jean Baptiste Filippi, Paul-Antoine Bisgambiglia. AN EXPERIMENTAL FRAME FOR THE SIMULATION OF FOREST FIRE SPREAD. Proceedings of the 2011 Winter Simulation Conference, Dec 2011, United States. pp.1010-1022. �hal-00667401�
B. NADER, J. B. FILIPPI, P. A. BISGAMBIGLIA, eds.
AN EXPERIMENTAL FRAME FOR THE SIMULATION OF FOREST FIRE SPREAD
Bahaa NADER University of Corsica
UMR CNRS 6134
Campus Grimaldi, Corte 20250, France
Jean Baptiste FILIPPI University of Corsica
UMR CNRS 6134
Campus Grimaldi, Corte 20250, France
Paul Antoine BISGAMBIGLIA University of Corsica
UMR CNRS 6134
Campus Grimaldi, Corte 20250, France
ABSTRACT
Wildfire is a constant risk around the Globe, due of its danger on the both human and natural resources. As a global awareness, wildfire is a topic of scientific research in all domains. One of these important domains, is the modeling and simulation of wildfire. An important aspect of any simulation model is to define a way to store, compare and exchange observation and model results. Without a clear and standardized data structure and format, models and observation lacks useability, inter-comparability, and data rich observation that does not use a well documented format may become unusable because it cannot be read.
In this article we propose such a well defined data format that is able to present observation and model outputs in the same fashion. This specification enables the creation of a basic experimental frame that is tailored to investigate forest fire simulation models, while not being linked to a specific simulation code. An open source Python API that implements this standard is also proposed. It provides a convenient way to transform a few program specific data format into the proposed format, and is able to export any simulated or observed fire into KML for easy result visualization and exchange.
This API has also been used to reformat a database of more than 600 fires, enabling a potential large scale simulation reanalysis for any simulation code that can be adapted to the proposed experimental frame.
1 INTRODUCTION
In the last quarter century, the phenomenon of wildfire has attracted researchers in all scientific domains as it appears to be a major actor of disturbance in the circumboreal forest.
As any research subject, Wildfire requires observation data to investigate phenomenon and build models. Nevertheless, and unlike other geophysical areas, there is not a standard way to collect and store data. Also, wildfire is an environmental system that often acts over large spatial scales, long time frames and heterogeneous units of study. The difficulty is not only formulating this system but also conceiving higher-level problems as interaction between modeling paradigms, models interoperability and model reusability. Finally, storing simulations’ results is essential to compare simulated fire with an observation or another simulation, but this can only be done in a reusable way if it is performed within a well defined.
General theory of modelling and simulation, introduced by Zeigler (?), is the base of our modeling and simulation environment. This approach of modeling provides a well defined architecture to specify models of a wide variety of modeling paradigms (?). The DEVS formalism is a set-theoretic formalism
(?), and supports specification of discrete event systems in a hierarchical, modular form (?). It includes a formal representation capable of mathematical manipulation just as differential equations perform this role in continuous systems. The concept of Experimental frame is also developed in the general theory, and standard data interchange structure and format are one of the requirement to actually build an experimental frame.
The goal of this paper is to fill the need for a framework adapted to manipulate wildfire observation and simulation data. Currently, this framework is applied to the DEVS based ForeFire code, which simulates forest fire growth (?, ?).
Data definition for the phenomenon of wildfire, as well as currently used formats is available in section two; a presentation of the Experimental frame for the proposed framework, in section three. Section four illustrates a detailed presentation for the proposed framework. Section five presents applications of this proposed framework in our simulation environment of forest fire.
2 REPRESENTATION OF THE WILDFIRE PHENOMENON
The phenomenon of wildfire is a natural part of most ecosystems (?). It is uncontrolled combustion of the vegetation fuels that occurs in the countryside or a wilderness area (?). The type of vegetation burned differ from one fire to another, so there are different names for this phenomenon, such as forest fires, hill fire, grass fire, brush fire. Each wildfire has its unique proprieties that describe the fire behavior. Those proprieties are the speed of spread of a fire from the original source, the total burned surface, the ability of jump gaps (roads and fire breaks) and the intensity of fire. Also, there are others factors influencing fire activity, such as weather, climate and the combustible material present (?).
2.1 TYPES OF WILDFIRE DATA PRESENTATION
Historically, wildfire incidents have been documented as reports mostly to analyze firefighting successes and failures with no computerized formats available. There are two types of presentation available in those reports; A graphical and textual one.
The graphical presentation is in map form. As an example, wildfire could presented on a map like a set of symbols or keys. An ignition point of a wildfire can be a ’X’, first contour can be as a set of ’Square’ and final contour as a set of ’Circle’; the map legend shows for each key what is the corresponding data. Actual icons and symbols are usually normalized at the country level.
The textual presentation is in the form of text report. Firefighters write these reports to describe the wildfire that they fight against. A report consists of field observations for wildfire’s parameters, such as fire spread, fire intensity, shape of fire, location of final fire line with a time of observation.
Most of the available information for observed fires exist in such form. If this way of presenting the data is very flexible, it is not at all convenient for automatic processing, especially in the context of an experimental frame for simulation software.
2.2 DATA FORMATS OF USE IN WILDFIRE SIMULATION SOFTWARE
Nowadays, there is a fundamental need to simulate the wildfire in efficient way (?). For this domain of research, spatial data of fire provided to simulator is important. This data are essential for compare and ameliorate simulated models, and specific data formats have been developed to fit each of these simulation software.
2.2.1 FARSITE
FARSITE(?) is a simulator of 2-dimensional fire growth model (?) that automatically computes wildfire growth and behavior for long time periods under heterogeneous conditions of terrain, fuels, and weather, developed by Mark A. Finney (?). It combines spatial information on topography and fuels along with weather and wind files (?) that means farsite requires spatial coincident landscape raster information to run (?).
Two formats are mandatory for run simulation in FARSITE:
• The Landscape (.LCP): file contains raster data obtained d from a GIS for terrain and fuels. All this raster data must be in ASCII grid format, from either ARC/INFO (or ArcView) or GRASS (?). ASCII raster files must be used to generate a Landscape (.LCP) file before running a simulation. • Initial Fuel Moistures (.FMS): a ASCII text file, required to begin the process of calculating site
specific fuel moistures at each time step of the simulation.
For each specific run, weather and custom models must be defined. Run-specific files: • Custom Fuel Model (.FMD) files.
• Conversion (.CNV) files.
• Weather (.WTR) files present weather. • Wind (.WND) files: for wind distribution.
Farsite output files, consist of Raster Output Maps (arrival time, fire intensity, etc.) and fire contour polygon files (?).
2.2.2 LANDFIRE
LANDFIRE (?) known as Landscape Fire and Resource Management Planning Tools, which combines vegetation, fire, and fuel characteristics mapping program.
LANDFIRE produces outputs in the form of geospatial products (spatial layers) that describe potential and existing vegetation type, surface, canopy fuel characteristics, fire behavior, fire regime classes, biophysical, environmental site potential and simulated historical fire regimes conditions (?). These outputs (fuel and risk maps) are compatible with ArcGrids and ArcMap grids, also they are consistent, standardized across the United States (?) but are not suited to store fire incidents.
2.2.3 FlamMap
FlamMap (?) is a tool to simulate and analyze fire behavior, developed by Finney (?, ?). It computes potential fire behavior characteristics (spread rate, flame length, fireline intensity, etc.), all mentioned input formats for FARSITE are required for FlamMap. The calculations are performed independently for each cell on the gridded landscape (?).
2.2.4 ASPHODEL
ASPHODEL is software of tactical situation (SITAC - Situation TACtiques in French) under developing, in laboratory of the University of Savoy, France (?). The SITAC is the French graphical representation of a wildfire incident including the fighting actions. The aim of this project is to manage human and material resources deployed to forest fire fighting. It is capable to draw a SITAC on different base maps.
2.2.5 ForeFire
ForeFire has been developed in our laboratory of University of Corsica, Corsica, France (?). It is based on the environment of DEVS formalism and simulates forest fire propagation model. Also, ForeFire required fuels distribution, weather, wind and elevation of terrain (?).
These requirements are in the form of input files that are defined in a XML file (?). This file contains simulation parameters, such as the ignition date of forest fire, simulation duration, the point of ignition, the segment of the forest fire shape and the resolution. As mentioned before, it defines input files. These files are:
• Fuel Model: it is an XML file, describes the fuel distribution of the terrain. • Shape: it is (.shp) file file, describes the fuel distribution of the terrain.
• Elevation: it is (.asc) file, presents the elevation of the forest fire location. • Wind files, are (.asc), present the wind distribution.
Again, most of these formats have been developed to fit specific software, with no real effort to provide a standard format to store and manipulate a wildfire incident. Next section presents the proposed experimental frame for wildfire simulation, where a standard data format is required to actually implement the framework.
3 EXPERIMENTAL FRAME FOR THE PROPOSED FRAMEWORK
An Experimental Frame (EF) is a specification of the conditions under which a system is observed or experimented; it is also the operational formulation of the objectives required in a modeling and simulation project (?).
Simulation throw DEVS environment facilitates the development of Experimental Frame, which leads to specify a set of various scenarios. Also, it leads to generate results that can help in comparing the performance of different models. Any EF consists of a generator, an acceptor, and a transducer. the generator generates input segments to the system in a known, desired fashion. The acceptor monitors an experiment to verify the desired conditions are met. The transducer observes and analyzes the system outputs. The Generator and transducer elements can only be implemented if it exist a data format that could be interpreted by the simulation software.
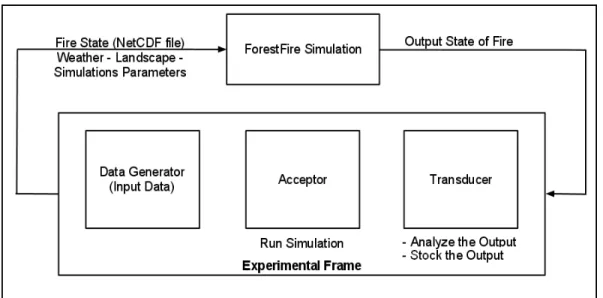
The EF for the proposed framework, (figure (1)), consists of the generator, the acceptor, and the transducer. The generator stimulates the Forest Fire Simulation with a known data segments [a Fire State from a NetCDF file (.nc), Landscape, Weather and Simulation Parameters]. The acceptor manages the ForestFire simulation, respecting the Simulation Parameters. Finally, the transducer analyzes the output and stocks the State of Fire in NetCDF (.nc) file, which could be used as an input for the generator.
Figure 1: the Experimental Frame for the proposed framework
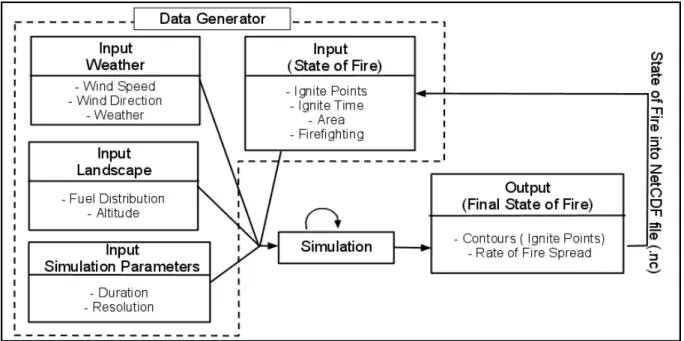
The Experimental Frame requires a well defined Input/Output diagram. Figure (2) shows the I/O diagram for the EF for the proposed framework. Input consists of four blocks:
• Fire State from a NetCDF file (.nc): it describes the initial state of fire such as its ignition points, ignition time, area and firefighting action.
• Landscape defines a distribution of fuels (combustible materials) and the altitude. • Weather defines range of wind speed and direction and also the weather in this location.
Figure 2: Inputs/Outputs diagram of the Experimental Frame
• Simulation Parameters define the numerical parameters of simulation like duration and resolution of simulation.
These four blocks considered as the data segments of the data generator. Output consists of one block:
• Final Fire State: describes the final state of fire such as its contours, end time, rate of fire spread. This final state is stored by the transducer in a NetCDF (.nc) file.
As shown figure (1), the output file (.nc) can be used as input to the data generator. In this case, contours will be the ignition segment (points) of the fire and end time will be the ignition time.
Finally, simulation block represents the periodic aspect, respecting the Simulation Parameters are managed by the acceptor.
4 FOREST FIRE EVENT DATA FORMAT
The development of a data framework has three phases: first the construction of a glossary, second the definition of a file format corresponding to the data on this glossary and third the choice and the configuration of a proper container. This section presents those three phases in details.
4.1 CONSTRUCTION OF A GLOSSARY AND DEFINING THE FORMAT
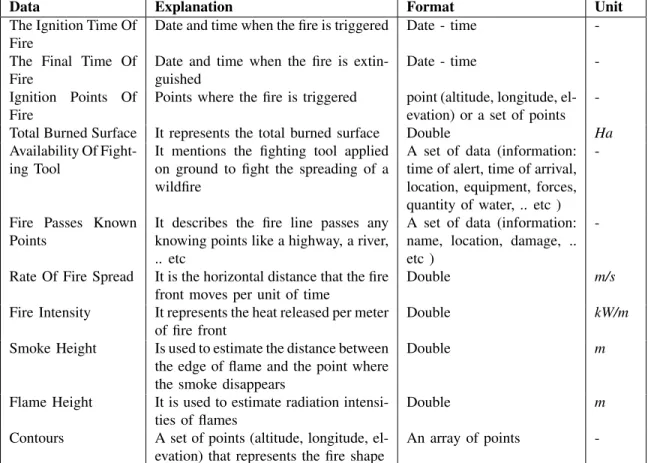
A glossary is a list of terms for a specific domain of knowledge with the definitions or the explanation for those terms. In our case, we list all data, based on observation of forest fire in nature, in other words, we make a domain analysis by consulting information sheets of real cases of wildfire. We studied two real cases: Suartone, Corsica, France occurred in 28/07/2003 at 3:00PM and Favone, Corsica, France in 08/07/2009 at 3:02PM. Table 1 cited all collected data, its format and units.
Although In Table 1 appears enough to describe fire behavior, but it is not enough to initiate simulation of this fire, because there are others required factors. These factors are the physical proprieties of the place, where the forest fire spreads. Fuel distribution, altitude, weather and wind are needed to simulate a fire, also they are considered as inputs of the data generator (figure 2).
Data Explanation Format Unit The Ignition Time Of
Fire
Date and time when the fire is triggered Date - time
-The Final Time Of Fire
Date and time when the fire is extin-guished
Date - time
-Ignition Points Of Fire
Points where the fire is triggered point (altitude, longitude, el-evation) or a set of points
-Total Burned Surface It represents the total burned surface Double Ha Availability Of
Fight-ing Tool
It mentions the fighting tool applied on ground to fight the spreading of a wildfire
A set of data (information: time of alert, time of arrival, location, equipment, forces, quantity of water, .. etc )
-Fire Passes Known Points
It describes the fire line passes any knowing points like a highway, a river, .. etc
A set of data (information: name, location, damage, .. etc )
-Rate Of Fire Spread It is the horizontal distance that the fire front moves per unit of time
Double m/s
Fire Intensity It represents the heat released per meter of fire front
Double kW/m
Smoke Height Is used to estimate the distance between the edge of flame and the point where the smoke disappears
Double m
Flame Height It is used to estimate radiation intensi-ties of flames
Double m
Contours A set of points (altitude, longitude, el-evation) that represents the fire shape
An array of points
-Table 1: Glossary of fire incident data collected from information sheets of terrain, and the identification of the format.
As consequence, wind speed and wind direction can be added to the fire incidents data in the glossary (table 1), because they can be noted with a corresponding observation time. The two terms added to the glossary: Wind Speed is the horizontal motion of the wind in atmosphere and has a major effect on fire’s speed of propagation, its format is double and its unit is m/sec;Wind Direction, in meteorological reports, is usually given as the direction from which wind is blowing. It defines the direction of fire’s propagation, format: double and unit: degree.
Next subsection discuses the container and its the configuration with the glossary data. 4.2 DATA CONTAINER
Last phase of framework development can be represented on two steps: the choice of a container that answers our needs and then the configuration of this container. The purpose of this last step is to reinforce a smooth transformation from forest fire simulation to files and vice-versa. We began this phase by the identification of the essential needs. We need a scientific container which provides a standard format as output and machine-independent. We choose NetCDF - Version 4 and HDF - as a container which responds on our needs and realizes our goal. NetCDF Network Common Data Format extended from CDF -Common Data Format- a library and toolkit that has been developed by NASA. The NetCDF software was developed at the Unidata Program Center in Boulder, Colorado (?). NetCDF consists of a set of libraries and machine-independent data formats that provide the creation, access, and sharing of the array-oriented scientific data.
4.3 NetCDF FRAMEWORK PRESENTATION
A NetCDF container consists of a set of parameters, which are the dimensions and the variables (?). We configure our NetCDF container with the collected data provided from the glossary. This next section is dedicated for the presentation of our desired framework.
4.3.1 DIMENSIONS AND VARIABLES
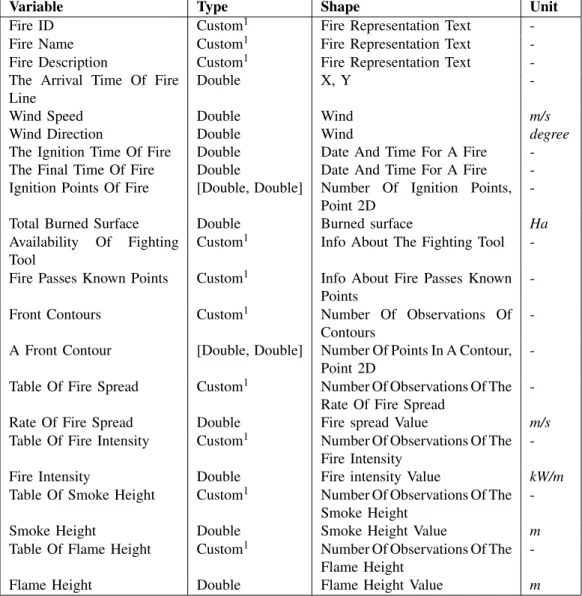
A dimension is used to present either a real physical dimension or to index other quantities. Time, latitude, longitude, or height represent the physical type, in climate simulations. A station or a model-run-number is considered as the other type. Each dimension is defined by a name and a length that is an arbitrary positive integer. A table of dimensions (table 2) is defined for the desired framework. Naming respects the NetCDF Climate and Forecast (CF) Metadata Convention if it is possible; if not, a proposed name is given.
In order to store a bulk of data in a NetCDF dataset, variables are needed. They are arrays of values of the same type. A variable has a name, a data type, and a shape described by its list of dimensions. It has attributes, the unit attribute is used to store a unit of a parameter. A set of variables are defined in this designed framework (table 3). Also, naming respects the NetCDF Climate and Forecast (CF) Metadata Convention (?), as dimensions naming.
1Custom means a Compound Data type. Known data types are Float, Double, String, ..etc. Compound Data Type defines a
collection of data types; by example Availability of fighting tool is a variable with a Compound Data type which consists of : • Time of Alert [data type : String (text)],
• Time of Arrival [data type : String (text)],
• Description of Equipments [data type : String (text)], • Description of Forces [data type : String (text)], • Fire shape fought [data type : String (text)], • Time of End Fighting [data type : String (text)], • Quantities of Water used [data type : String (text)].
Dimension Length Explanation
Fire Representation Text 1 It is for any fire information in text form, will be saved in NetCDF file like ID, Name and Description
Time 1 It is devoted for the time dimension (physical dimension) X UNLIMITED It presents the spatial dimension in X axis (physical dimension) Y UNLIMITED It presents the spatial dimension in Y axis (physical dimension) Point 2D 2 it defines the longitude and the latitude at a given point (index dimension) Number Of Ignition Points UNLIMITED It handles number of ignition points of a fire front (index dimension) Wind 1 It presents the wind dimension used for wind speed and wind direction Date And Time Of Fire 1 It is devoted to the date and time value of ignition/end time of fire Info About The Fighting
Tool
UNLIMITED It defines the dimension of all information in case of Availability Of Fighting Tool
Info About Fire Passes Known Points
UNLIMITED It defines the dimension of all information if the wild fire passes known points as a highway, .. etc.
Number Of Points In A Con-tour
UNLIMITED It is a index dimension to present the number of points in a contour
Number Of Observations Of Contours
UNLIMITED It shows the number of observations for the fire contours. Each TObs -for time of observation-is corresponding for a contour. Example: at Tobs1 = 12h00, there is contour1 and at Tobs2 = 12h25, there is contour2 in this case this dimension is 2, it means that there are 2 contours with 2 times of observation
Burned Surface 1 It is a index dimension to present the total burned surface Fire Spread Value 1 It defines the dimension of the value of the rate of spread Number Of Observations Of
The Rate Of Fire Spread
UNLIMITED It is a index dimension to present number of observations for the rate of a fire spread
Fire Intensity Value 1 It defines the dimension of the value of the fire intensity Number Of Observations Of
The Fire Intensity
UNLIMITED It is a index dimension to present number of observations of the fire intensity
Smoke Height Value 1 It defines the dimension of the value of the fire height Number Of Observations Of
The Smoke Height
UNLIMITED It is a index dimension to present number of observations for the height of smoke in the air
Flame Height Value 1 It defines the dimension of the value of the fire smoke height Number Of Observations Of
The Flame Height
UNLIMITED It is a index dimension to present number of observations for the height of flame of such a fire
Variable Type Shape Unit Fire ID Custom1 Fire Representation Text -Fire Name Custom1 Fire Representation Text -Fire Description Custom1 Fire Representation Text -The Arrival Time Of Fire
Line
Double X, Y
-Wind Speed Double Wind m/s
Wind Direction Double Wind degree
The Ignition Time Of Fire Double Date And Time For A Fire -The Final Time Of Fire Double Date And Time For A Fire -Ignition Points Of Fire [Double, Double] Number Of Ignition Points,
Point 2D
-Total Burned Surface Double Burned surface Ha Availability Of Fighting
Tool
Custom1 Info About The Fighting Tool
-Fire Passes Known Points Custom1 Info About Fire Passes Known Points
-Front Contours Custom1 Number Of Observations Of Contours
-A Front Contour [Double, Double] Number Of Points In A Contour, Point 2D
-Table Of Fire Spread Custom1 Number Of Observations Of The Rate Of Fire Spread
-Rate Of Fire Spread Double Fire spread Value m/s Table Of Fire Intensity Custom1 Number Of Observations Of The
Fire Intensity
-Fire Intensity Double Fire intensity Value kW/m Table Of Smoke Height Custom1 Number Of Observations Of The
Smoke Height
-Smoke Height Double Smoke Height Value m Table Of Flame Height Custom1 Number Of Observations Of The
Flame Height
-Flame Height Double Flame Height Value m
5 APPLICATION
This section is devoted to the python application that implements the data framework. The ontology layer is abstracted in a Python class ”ForestFire.py”, and tools to create and manipulate instances are available in Python Scripts. Any simulation, simulation segment or observation can be represented by an instance of the ForestFire class. These instance can be stored and loaded as netcdf files, or created from scratch using the python interface in order to write transcoder to other file formats. As such it represents the ”generator” element of the experimental frame. Any instance can also be used to generate outputs, such as Google Earth KML, database record or other evaluation tool, as such it is also the ”transducer” element. The next subsection the two main tests developped to validate the interface.
5.1 REPRESENTATION OF PYTHON SCRIPT
A python script is created that contains a class ForestFire. This class consists of all attributes that are data cited in table 3. This section devoted to tests that we made to validate our framework in the application phase. Tests have been divided into two types: Test1 is defined as instantiating objects from ForestFire’s class from scratch and Test2 is defined as using the Online Database called Promethee (?) of Forest fires that occured over the French territory.
5.2 TEST1: CREATE FORESTFIRE INSTANCE FROM SCRATCH
Test1 presents the creation of an object (from ForestFire Class) from scratch, for those, an analyst must read a report and write the appropriate python script. Five forest fires have been analysed for this test. We note them by place of event: Saint Cyprien, Corsica, France(); Favone, Corsica, France(); Sainte-Lucie, Corsica, France; Suartone, Corsica, France()and Opslo, Sardegna, Italy ().
Each wildfire’s sheet contains two types of data; mandatory data that must be defined during the instantiation (name and date); and supplementary data that be set after the instantiation (all the other data). After the initialization, object is virtually stored in a NetCDF file that is serialized runtime.
This file contains only defined dimensions and variables, corresponding for available data of the wildfire’s sheet. The presentation layer verifies if the transformation from ForestFire’s object to our NetCDF Framework and vise-versa. Google Earth is used as a presentation tool to verify the result. The process is simple, stored data has been retrieved from file and a new ForestFire instance initialized with this data existed in the file. Finally, a function produces a file compatible with Google Earth from all instances that actually defined in this test (figure 3).
5.3 TEST2: USING DATA FROM PROMETHEE
In Test2, data is fetched from Promethee(?), after that, objects have been created and initialize with data automatically. As mentioned before, Promethee is an online database for forest fires in the Mediterranean region in France. Developed and launched in 1973 and covers 15 departments in southeastern of France. Search Criteria are by department, municipality code, period, contours, total burned surface, .. etc. This test is to retrieve a huge number of forest fires from Promethee. As extract of such base is only available in ASCII comma separate values, Fires are created from scratch with a custom reader for this base. ForestFire instances are then serialized in NetCDF, offering the ability to be displayed in KML or used to start simulations. Here Google Earth has been used to present these results. Figure 4) represents results of retrieved forest fires (department: North of Corsica, Haute-Corse, period: from 01/01/2003 to 31/12/2003). Number of forest fires stored in the current NetCDF base is 677 fires. Transform operation is done in 10 seconds
Figure 3: (A) shows Test1, that represents five forest fires.
(B) represents Saint Cyprien’s forest fire, which is one of fires showed in (A), with all available data (point of ignition, contours and ignition date of this fire, extended data like wind , fire Spread ,..etc ).
Figure 4: (A): 677 forest fires in North of Corsica, period: from 01/01/2003 to 31/12/2003. (B): Zooming on forest fires and showing extended data of a selected forest fire.
6 CONCLUSION
This paper has presented the phases of the developed framework , based on NetCDF. The aim of this framework is to transform simulations results of forest fire to NetCDF files (.nc). This transformation leads to compare forest fires simulations with corresponding observed fires, and to replay stored forest fires in future for others purposes. A set of Python script is available upon request to write data reader/writer to this format. Tests have been applied to verify that this framework can represent the available data. The obtained results show that the developed framework is well suited to store forest fires simulation result. We hope to enrich the database with a maximum of events, in order to provide also the test base for the scripts.
Our future work is to integrate simulation software directly in this framework in order to realise large automatic reanalysis of forest fire events, that may help to enhance forest fire models for all compliant software.
ACKNOWLEDGMENTS
This research is developed within the IDEA project ANR-09-COSI-006-01 AUTHOR BIOGRAPHIES
Bahaa NADER
Bahaa NADER was born in Cairo, Egypt in 1987. In 2009 he received the BSc in Computer and network engineering from the French University in Egypt (UFE), Cairo, Egypt. In the same year he received a Master degree in computer science from University of Corsica, Corsica (France). Currently he is preparing a PhD. in the University of Corsica. His main research concern the incertitude of forest fires simulations. Jean Baptiste FILIPPI
Jean Baptiste Filippi is a full time Researcher at the SPE CNRS laboratory of the university of Corsica. He has developped the ForeFire wildfire simulation software and is now leading a national project to provide coupled atmospheric/wildfire software.
Paul Antoine BISGAMBIGLIA
Paul Antoine Bisgambiglia is professor of computer science at University of Corsica, Corsica (France) and head of the UMRS CNRS 6134. His research interests include multi-modeling activities and the use of various techniques combination in order to develop a framework for complex natural systems. He use a modeling and simulation formalism based on a discrete event specification (DEVS) proposed by B.P. Zeigler.