Publisher’s version / Version de l'éditeur:
Vous avez des questions? Nous pouvons vous aider. Pour communiquer directement avec un auteur, consultez la première page de la revue dans laquelle son article a été publié afin de trouver ses coordonnées. Si vous n’arrivez pas à les repérer, communiquez avec nous à [email protected].
Questions? Contact the NRC Publications Archive team at
[email protected]. If you wish to email the authors directly, please see the first page of the publication for their contact information.
https://publications-cnrc.canada.ca/fra/droits
L’accès à ce site Web et l’utilisation de son contenu sont assujettis aux conditions présentées dans le site LISEZ CES CONDITIONS ATTENTIVEMENT AVANT D’UTILISER CE SITE WEB.
PNC-Tech Meeting: [Proceedings], 2004-06-10
READ THESE TERMS AND CONDITIONS CAREFULLY BEFORE USING THIS WEBSITE.
https://nrc-publications.canada.ca/eng/copyright
NRC Publications Archive Record / Notice des Archives des publications du CNRC :
https://nrc-publications.canada.ca/eng/view/object/?id=85763357-fe1b-4238-a9e0-8d7762defa01 https://publications-cnrc.canada.ca/fra/voir/objet/?id=85763357-fe1b-4238-a9e0-8d7762defa01
NRC Publications Archive
Archives des publications du CNRC
Access and use of this website and the material on it are subject to the Terms and Conditions set forth at
PVT behavior of PP nanocomposites
PVT behavior of
PP nanocomposites
L. A. Utracki
NRCC/IMI, 75 de Mortagne, Boucherville, QC, Canada
Outline
Introduction to PVT testing
Simha-Somcynsky (S-S) lattice-hole theory
Equation of state (eos)
Free volume, CED, and solubility parameters
PVT of PNC
PNC based on PA-6 and PS
PNC molecular structure from PVT-eos analysis
PVT of the PP-based PNC
Thermodynamic interactions – molecular model Free volume – a measure of clay dispersion
Free volume – correlation with PNC properties
Conclusions
3
Reasons for measuring PVT
To determine the P & T dependent V and derivatives, e.g.:
Isobaric thermal expansion coefficient: Isothermal compressibility:
P-dependent transition T (Ehrenfest):
To determine the free volume f = f(T, P) and derivatives:
Viscosity, diffusivity (barrier properties), surface tension, …
Physical aging: dimensional stability, mold shrinkage, creep, … Mechanical properties, chemical reactivity. See Appendix!
To determine the cohesive energy density (CED):
Solubility parameters and miscibilities
Internal pressure and internal interactions
Others, e.g.:
To estimate the bulk degree of exfoliation in PNC.
P lnV / T
α
= ∂ ∂ T lnV / Pκ
= − ∂ ∂ g dT / dP =∆κ ∆α
/Gnomix
®PVT instrument
5
Raw data from Gnomix
®PVT diagrams for glassy (PS) and semi-crystalline (PP) polymers (P = 0.1 to 190 MPa) PVT of PP (RUN 287) Temperature, T( K) 250 300 350 400 450 500 550 Sp e c if ic Vo lu m e -0.10 -0.05 0.00 0.05 0.10 0.15 0.20 0.25 0.30 Col 112 vs Col 114
PVT Diagram for PS Nano HS 17
Temperature, T(K) 250 300 350 400 450 500 550 Sp e c if ic Vo lu m e -0.06 -0.04 -0.02 0.00 0.02 0.04 0.06 0.08 0.10 0.12 Col 112 vs Col 114
Free volume - definitions
Free volume is that part of space that is left after
subtracting the occupied volume, defined by the atomic
dimensions.
Considering that a molecule or its segment moves in a
cage created by surrounding molecules, its free volume
is defined by the space within which its center can
freely move:
1. Total specific volume, V
2. Occupied specific volume (defined as V at T = 0 K), Vo 3. Free volume: Vf = V - Vo
4. Free volume fraction:
f = V
f/ V = 1 - (V
o/V)
5. Doolittle definition: fD = Vf/Vo = f/(1 - f)7
S-S Quasi-lattice
Vacancy (hole) fraction: h = 1 – y(V, T)
(excess « free volume ») is a measure of
structural disorder.
Occupied sites Vacant sites(
)
(
)
V,T T F F V, T; y(V, T); c / s Minimization : F / y 0 Equation of state : P F / V = ∂ ∂ = = − ∂ ∂ Free energy
For s-mer:
Scaling parameters: P* = qz ε*/sv*; V* = v*/Mo; T* = qzε*/cR → (P*V*/T*)Mo = Rc/sv*: segmental repulsion volume ε*: segmental attraction energy
3c/s: number of external modes (volume-dependent degrees of freedom) per segment:
Ideal flexible linear chain: 3c/s → 1
S-S lattice-hole theory 1
Lattice sites are occupied by chain segments (or small molecules).
To account for lattice disorder, holes are introduced, what increases the entropy of mixing.
The segment executes thermal motions in the molecular field, consisting of occupied sites (y) and free holes (h = 1 - y).
Statistical mechanics leads to
dependencies expressed in terms of reduced variables:
The macromolecule “i” has 3ci external degree of freedom for each of its si
statistical segments. In linear chains:
3c = s + 3.
2D lattice for two types of macromolecules and holes (open circles). The binary interaction parameters,
ε
ij,P = P / P * ; T = T / T * ; V = V / V *
F V ,T , y(V ,T )
9
S-S lattice-hole theory 2
The theory describes the thermodynamic properties of liquids,
starting with configurational partition function:
The reduced free volume fraction is written as a function of the
hole fraction, h = 1 – y, and the reduced cell volume, :
thus combining the
solid-like and gas-like
contributions.
The Helmholtz free energy was obtained from the Z-probability
function.
{
}
cN f o N Ns( 1 v ) / v 4 2 o Z g( N , y ) v (V , y ) exp E (V , y ) / kT From Huggins Flory : g( N , y ) y ( 1 y )from Lennard Jones : 2E yNqz * A( v * / ) B( v * / ) where : A 1.011; B 2.409; yV /( Ns ) yv
ε
ω
ω
ω
− − − = − − ∝ − − = − = = ≡ = ω(
)
3 1 / 3 1 / 6 1 / 3 f fv
≡
v / v*
=
y
ω
−
2
−+
h
ω
S-S lattice-hole theory 3
The S-S theory describes the thermodynamic properties of
liquids, explicitly providing information how the hole fraction,
h = 1 - y, changes with independent variables.
From the Helmholtz free energy, F, using:
a coupled equation of states was derived.
Q
i= 1 / (y
iV
˜
i) ;
η
i= 2
−1 /6y
iQ
i1/3˜
P
iV
˜
i/ ˜
T
i= (1 − η
i)
−1+ 2y
iQ
i2(AQ
i2− B) / ˜
T
iwith:
3c
i[(
η
i−1 / 3) / (1 − η
i)
− y
iQ
i2(3AQ
i2− 2B) / 6 ˜
T
i]
+ (1 − s
i)
− s
iln[(1
− y
i) / y
i]
= 0
where: A = 1.011 and B = 1.2045
(
)
(
)
0
T V ,TP
F /
V
F / y
∂
∂
≡ −
∂
∂
=
11
S-S lattice-hole theory 4
From the Helmholtz free energy, F, the reduced
cohesive density and reduced internal pressure, viz.:
The reduced CED is related to the solubility parameter,
δ
, viz.
δ
2=
CED = U/V;
both being thermodynamic
intensive functions
.
(
)( )
( )
(
)
( )
( ) (
)
( )
( )
2 2 i T V V V P T 2 2 i T 2 2CED
U / V
CED / P*
y / 2V
yV
B
A yV
P
U / V
T( P / T )
P
T( P / T )
T
T
/
where :
( P / T ) ;
( lnV / T ) ;
( lnV / P )
P
( 1 / 2 ) yV
B 3 A yV
y / V
( 2 y / V ) yV
B / 2
A yV
β
α κ
β
α
κ
− − − − − −
≡ −
=
=
−
≡ ∂
∂
=
∂
∂
− ≅
∂
∂
=
=
≡ ∂
∂
≡ ∂
∂
≡ ∂
∂
=
−
∂ ∂
+
−
Simplified dependencies
The S-S EoS predicts that
at ambient pressure
:
The temperature dependence
of PVAc reduced volume at
constant pressure is shown
(viz. Figure left).
Computed from EoS group
volumes, v*, are proportional to
the van der Waals volumes:
v* = 1.59 V
W+ 1
.Ref.: L. A. Utracki and R. Simha, ″Analytical
representation of solutions to lattice-hole theory”, Macromol. Chem. Phys., Molecul. Theory Simul.,
3/ 2 0 : 0.95 1.40 : 1. ln 0.1034 23.835 2. 1 ( ) / ; ( ) 0.9473 0.9663 0.957 i i P
For polymeric melts within V
V T h = K T V K T to < < = − + × = − = ≅ -0.1 0 0.1 0.2 0.3 0.4 P = 0; y = -0.1034 + 23.87x; r = 0.99997 P = 0.05; y = -0.0996 + 19.53x; r = 0.9996 P = 0.1; y = -0.1016 + 16.91x; r = 0.9991 P = 0.2, y = -0.1102 + 13.66x; r = 0.9986 P = 0.3, y = -0.1199 + 11.64x; r = 0.998 y = l n ( V/ V *)
13
Implicit in the PVT dependencies is the structural function:
h = h(V, T), comprising the
solid-like and gas-like
contributions.
For PS the experimental plot of the function is shown.
Within the full range of independent variables the hole fraction,
h = 1 - y, depends on V and T,
and the free volume fraction may
depends on it:
The hole fraction has been
directly measured by the
positron annihilation lifetime
spectroscopy (PALS).
0.7 0.8 0.9 1.0 1.1 1.2 0.00 0.05 0.10 0.15 0.20 0.25 0.30 0.35P & T dependent S-S hole fraction; full range
fr a c ti o n , h (-) Reduced density, V*/ V (-) Reduced density, V*/ V (-) 0.7 0.8 0.9 1.0 1.1 1.2 fr a c ti o n , h (-) 0.00 0.05 0.10 0.15 0.20 0.25 0.30 0.35 Reduced density, V*/ V (-) 0.7 0.8 0.9 1.0 1.1 1.2 fr a c ti o n , h (-) 0.00 0.05 0.10 0.15 0.20 0.25 0.30 0.35 0.7 0.8 0.9 1.0 1.1 1.2 0.00 0.05 0.10 0.15 0.20 0.25 0.30 0.35
P & T dependent S-S hole fraction; full range
fr a c ti o n , h (-) Reduced density, V*/ V (-) 1.6≤ ≤T 7.1 ; 0< ≤P 35
The hole vs. free volume fraction
3/ 2 o 1 2 3/ 2 o 1 2 h a a / V a T f b b h b T = + + ∴ = + +
Assuming random mixing in binary mixtures, Jain & Simha (1979) expressed the Helmholtz free energy in terms of averages, <>:
The two cross-interaction parameters are expressed as:
Fm / RT = x1 ln x1 + x2 ln x2 + (< s > /y)(1 − y)ln(1 − y) − (< s > −1)ln[(z − 1) / e] − < c > {ln[< v* > (1 − η)3 / Q] − (yQ2 / 2 ˜ T )(AQ2 − 2B)} − (3 / 2){x1c1 ln[ 2π < Mo1 > RT(NAh)−2]+ x2c2ln[2π < Mo2 > RT(NAh)−2]} < s >= x1s1 + x2s2 ; < c >= x1c1 + x2c2 ; < Mo >= (x1s1Mo1 + x2s2Mo2)/ < s > < ε* >< v* >k= X 1 2ε 11 * v11*k + X22ε22* v22*k + 2X1X2ε12* v12*k ; k = 2,4 where X1 = 1 − X2 = x1[s1(z − 2) + 2]/ < qz >
Binary mixtures 1
With definitions:(
)
* * * 12 11 22 v 3 * *1/ 3 *1/ 3Interaction energy :
;
1
Re pulsion volume: v
v
v
/ 8
ε εε = δ ε ε
δ ≅ δ ≅
= δ
+
15
MISCIBILITY OF PPE/PS BLENDS
The PVT data for 7 blend compositions well followed the S-S predictions (Fig. 1 for
50%).
The proportionality factors, δε = Sε = 1.15 and δv = Sv = 0.86 (see Figure 3).
0.7 0.9 1.1 1.3 0 0.4 0.8 PS/PPE blends S ε , o r S v φ (PPE) <S ε> = 1. 15 ± 0.06 <S v> 0. 86 ± 0.04 T = T g — 330°C P = 0 — 180 MPa
Binary mixtures 2
0. 1 0. 3 0. 5 0. 7 0. 9 0.90 0.95 1.00 1.05 1.10Data for PPE/PS = 1:1 blend
T = 140 - 340oC; P = 0.1 - 200 MPa Experiment al S-S theory C o m p re s s ib il it y: P V /T Density, 1/V (g/mL) r2 = 0 .999998; σ = 0.0013 10800 11200 11600 12000 0.86 0.9 0.94 0 0.4 0.8 T* = 12140 - 1236.7x; r = 0.98932 V* = 0.95543 - 0.082859x ; r = 0.99613 T* V* x(PPE) Fig. 1 Fig. 2 Fig. 3
PVT of PA-6/clay PNC 1
In binary mixtures the interaction parameters are molar averages.
Polymeric Nano-Composites (PNC) are mixtures of two components: flexible PA-6 and rigid “particles” of clay.
The idealized clay particle is 1000 nm in diameter and 1 nm in thickness, hence its “molecular mass” and “molecular volume” is:
M = NA ρπd2h/4 = 11,824 (kg/mol), and
Vplat = π(d/2)2h = 4.73 106 (mL/mol).
The lattice-hole theory assumes that the hard core volumes of the constituents do not differ too much – an equality is usually
assumed.
For the inherent to the theory 6-12 potential the factor 21/2 relates the positions of potential minimum and onset of repulsion (see the following slide), thus for PA-6:
v*hard = MsV*/21/2 = 17.60 (mL/mol)
also adopted for the clay “segment”.
17
Thus, the number of segments for PA-6: s1 = 801 and that of clay: s2 = 2.6873×10⁵.
For a binary mixture the values must satisfy the following
equations:
The site fractions are defined as:
-0.4 0 0.4 0.8
0.5 1.5 2.5 3.5
Lennerd-Jones Potential Energy Function
R e duc e d P ot e nt ia l E n e rgy , u /4 ε v/v o u = 4 ε[(r o/r) 12 - (r o/r) 6 ] attractive forces ~ (r o /r) 6 repulsive forces ~ (r o /r) 12 min: (21/2; -1/4) 1 1 2 1 1 /( 1 1 2 2) 0.98995 : i ( 2) i 2; 12 X X zq s zq s zq s where zq z s z = − = + = = − + =
To solve the 2 Eqs. with 3 known parameters (experimental values of v11*, ε11* and postulated by the theory: v11* = v22*) it was assumed that the Berthelot’s rule holds: * * *
12 11 22
ε
=
ε ε
PVT of PA-6/clay PNC 2
PVT of PA-6/clay PNC 3
S-S theory provides good description of the observed
PVT dependencies for PA as well as for the PNC.
0.94 0.98 1.02 1.06 480 520 560 600 experimental computed from S-S S pe c if ic v ol u m e, V (m L/ g ) T (K) P = 0.1 - 200 MPa Ube PNC 0.95 1 1.05 1.1 480 520 560 600 Ube PA-6 experimental computed from S-S S pe c if ic v ol u m e, V (m L/ g ) T (K) P = 0.1 - 200 MPa V (mL/g)
19
PVT of PA-6/clay PNC 4
To directly compare the specific volume and the hole fraction
variations with T and P for PA and PNC, the ratios V(PA)/V(PNC) and h(PA)/h(PNC) at identical T and P for each point are shown.
1 1.05 1.1 1.15 1.2 500 520 540 560 580 600 T (K) 0.1 50 110 150 190 P (MPa) 190 150 110 50 0.1 V(PA)/V(PNC) h(PA)/h(PNC)
Theoretical V-ratio for PNC with 0.64 vol% clay is: V(PA)/V(PNC) = 1.0088. The experimental ratio: V(PA)/V(PNC) = 1.008 to 1.018.
The holes ratio:
h(PA)/h(PNC) =
Thermodynamic interactions
from PVT data
Fitting S-S eos to PVT data gave the following fitting,
reducing and interaction parameters.
Assumption of the same lattice cell size for PA and clay with
the Berthelot rule leads to computation of all 6 interaction
parameters.
For
ε
there is a concentration effect!
Statistics of fitting the eos to experimental data and the computed parameters for PA-6 and PNC from Ube
Parameter PA-6 50:50 PNC
Correlation coeff. squared, r2 0.999 999 0.999 998 0.999 998
Standard deviation of data, σ 0.00112 0.00145 0.00127
Coeff. of determination, CD 0.998 602 0.998 501 0.998 550 P* (bar) 12574 ± 82 11857 ± 111 11639 ± 126 T* (K) 11134 ± 32 11364 ± 49 11307 ± 54 104 V*(mL/g) 8919.3 ± 9.6 8943.1 ± 14.3 8888.6 ± 16.2 Ms (g/mol) 27.512 29.700 30.288 ε11 (kJ/mol) ε11 * = 31.23 ± 0.09 <ε∗> = 31.49 ± 0.29 <ε∗> = 31.71 ± 0.15 v11 (mL/mol) v11 * = 24.54 ± 0.03 <v*> = 26.56 ± 0.36 <v*> = 26.92 ± 0.05
21
Adsorption on crystalline
solid
Nano-scale rheology showed that there is a
3-layer structure of PBD on mica [Luengo et al., 1997]: 1. z < 6 nm – solid-like 2. 6 < z < 100 – elastomeric 3. z > 100 nm – bulk behavior 0 0.4 0.8 0 40 80
PA-6 chain mobility vs. z: Solid layer z = 0-6 nm
Increasing mobility z = 6 - 100 nm PA-6 melt mobility z > 100 nm
Re la tiv e c h a in m o b ilit y
Binary interactions in
PA-6/PNC system
The binary interaction parameters, were calculated assuming: 1. Enrobed clay 2. Average values of 1-2 interactions 3. Slightly expanded (by 10%) cell volume of dispersed phase 30 40 50 24.5 25.5 26.5 0 0.4 0.8 1.2 1.6
Interaction parameters in PA-6/PNC system
E11 E22 V11 V22 E n e rg et ic i n ter ac tio ns , ε ii V o lum et ric int er a c tio ns , v ii Clay concentration (wt%) * * ij
and v
ij
* * 221.1
11v
v
23
Viscosity vs. 1/h
Zero-shear viscosity, η0, and η
at G“ = 50 Pa are plotted vs. 1/h.
The viscosity data are
interpolated, after extraction of the yield stress behavior from the experimental data
The hole fraction h was computed from PVT measurements.
The data follow a linear dependence:
Ref.: L. A. Utracki: "Temperature and Pressure Dependence of Liquid Viscosity”, Canadian
J. Chem. Eng., 61, 753 – 758 (1983). 2.4 2.5 2.6 2.7 6.6 7 7.4
Viscosity of PA-6 and its mixtures with PNC
logη 0 = 0.477 + 0.2996/h; R= 0.9775 logη(G"=50) = 1.836 + 0.0888/h; R= 0.9565 lo g η 1/h
log
η
∝
1/ h
PVT of PS-based PNC 1
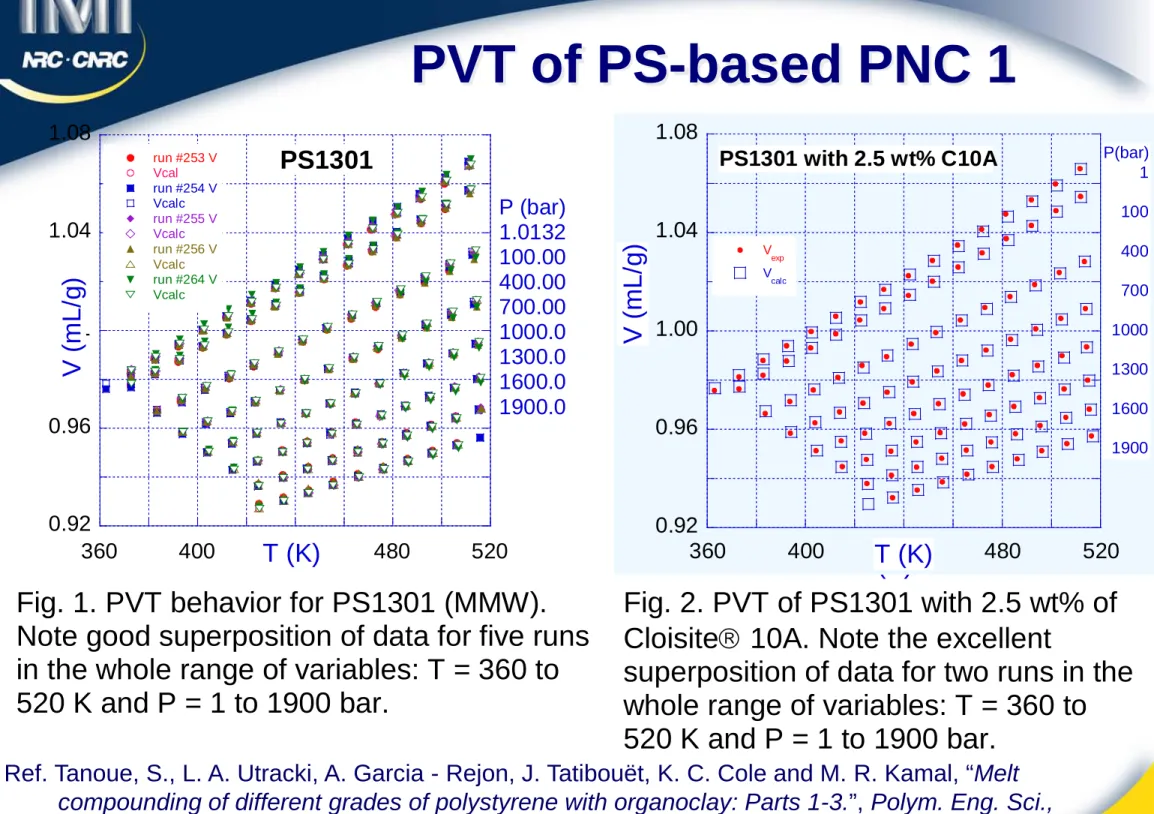
0.92 0.96 1 1.04 1.08 360 400 440 480 520 PS1301 run #253 V Vcal run #254 V Vcalc run #255 V Vcalc run #256 V Vcalc run #264 V Vcalc V ( m L /g) T (K) P (bar) 1.0132 100.00 400.00 700.00 1000.0 1300.0 1600.0 1900.0 0.92 0.96 1 1.04 1.08 360 400 440 480 520 PS1301 with 2.5 wt% C10A Run #270 Run #271 V ( m L /g) T (K)Fig. 1. PVT behavior for PS1301 (MMW). Note good superposition of data for five runs in the whole range of variables: T = 360 to 520 K and P = 1 to 1900 bar.
Fig. 2. PVT of PS1301 with 2.5 wt% of Cloisite 10A. Note the excellent
superposition of data for two runs in the whole range of variables: T = 360 to 520 K and P = 1 to 1900 bar. 0.92 0.96 1.00 1.04 1.08 360 400 440 480 520 PS1301 with 2.5 wt% C10A V exp V calc V ( m L /g) T (K) P(bar) 1 100 400 700 1000 1300 1600 1900
Ref. Tanoue, S., L. A. Utracki, A. Garcia - Rejon, J. Tatibouët, K. C. Cole and M. R. Kamal, “Melt
25
From the PVT fit the reducing parameters and then the average values of the interaction parameters were calculated:
P* = zq<ε*>/(s<v*>); T* = zq<ε*>/Rc; V* = <v*>/Ms
The minimum in the hole fraction (at ca. 2 wt% C10A) corresponds to maximum clay platelets dispersion.
There is a simple relation between the free volume and the average interaction parameter, <ε*>.
The two average interactions parameters are proportional to each other.
0.93 0.95 0.97 0.99 1.01 0 10 20
PS1301 with Cloisite 10A; P = 10 bar
T = 360 K T = 460 K T = 560 K R e la ti v e h o le fr a c ti o n , h (PN C )/ h (PS) Organoclay content, w (wt%) 1.00 32.4 32.8 33.2 43.0 43.4 43.8 44.2 44.6 0 10 20
PS1301 with Cloisite 10A
<ε ij> <v* ij> < ε ij > (k J /m o l) <v * ij > ( m L /m o l) Cloisite 10A (wt%) 0.93 0.95 0.97 0.99 1.01 32.4 32.8 33.2 h r(360) = 3.4589 - 0.075686ε* ; r 2 = 0.99992 h r(460) = 2.9245 - 0.059237ε*; r 2 = 0.99992 h r(560) = 2.6834 - 0.051815ε*; r 2 = 0.99994 h r = h (PN C )/ h (P S) <ε*> w = 0 w = 1 .4 w = 2 .8 w = 5 .7 w = 1 0 .6 w = 17. 1
PVT of PS-based PNC 2
PP ProFax SR256 from Himont was melt compounded with 0, 1, 2, 3 and 4 wt% of Cloisite 15A or C6A (MMT intercalated with
145% 2M2HT).
Three compatibilizers were used (see Table).
The ratio of organoclay to compatibilizer was 1:2.
The effects of Epolen® addition
was also examined.
Isothermal PVT data were
determined at P = 0 to 1900 bar,
increasing T by 10oC steps from
ambient to 550 K.
The runs were repeated until reproducibility in V was ≤ 0.02%.
PVT of PP-based PNC 1
Data from at least two runs were fitted to S-S eos, using Micromath Scientist non-linear least squares program.
E43 PP-g-MA Epolene-43 Mw = 9.1 3.81 %MA Eastman 3150 PP-g-MA Polybond-3150 Mw = 330 0.71 %MA; styrene Uniroyal GMA6 PP-g-GMA -- Mw≈ 305 0.42 %MA; styrene IMI
PVT tests for PP with Cloisite 15A (C15A) and a compatibilizer
# Code Composition (wt%) PVT Run # Vo
PP C15A Compatibilizer (mL/g)
A PP256 100 0 0 199 1.1424
B PP256 97 3 (C6A instead C15A) 200 1.1038
0 E0-0100 100 0 (extruded) 2 (#284, 285) 1.1107 1 E0-2100 98 2 0 2 (#286, 287) 1.1030 2 E1-2-E43R 94 2 4 (E43) 2 (#357, 358) 1.1005 3 E1-2-3150 94 2 4 (3150) 2 (#304, 305) 1.0980 4 E2-2-GMA6 94 2 4 (GMA) 2 (#292, 293) 1.1042 5 E0-3200 96 4 0 2 (#298, 299) 1.0921 6 E1-4-E43 96 4 8 (E43) 2 (#306, 309) 1.090 7 E1-4-3150 96 4 8 (3150) 5 (345, 360) 1.0906 8 E2-4-GMA6 96 4 8 (GMA) 2 (#315, 341) 1.0894 9 M1 97.5 2 ½ epoxy 2 (#316, 317) 1.1004 10 M2 93.5 2 ½ epoxy + 4 wt% 3150 4 (#333, 334) 1.0977
27
PVT of PP-based PNC 2
The specific volume at room temperature (RT) of PP and its PNC’s decreases with organoclay loading (see Fig. 1). The data follow the rule of mixture assuming density of PP as ρ = 0.90, and that of clay as
ρ = 2.44 g/mL. Compatibilizers with styrene have higher density. Owing to variation of RT and composition the data scatter about a theoretical dependence.
Good reproducibility (see Fig. 2) and fitting to S-S eos (see Fig. 3) were obtained. 0.05 0.1 0.15 0.2 0.25 0.3 450 460 470 480 490 500 510 520 530
Reproducibility of raw incremantal data
DV345 DV353 DV354 DV356 DV360 ∆ V (mL /g ) T (K) 1.10 1.15 1.20 1.25 1.30 1.35 1.40 440 480 520 M2 (2%C15 + 4%3150 + 0.4 epoxy) V333&334 Vcalc Sp ec. v ol. T (K) P (bar) 1.0132 100 400 700 1000 1300 1600 1900 Fig. 3 Fig. 1 Fig. 2 1.085 1.095 1.105 1.115 0 1 2 C15: Vo = 1.111 - 0.0077w; r = 0.999 E43: Vo = 1.111 - 0.0089w; r = 1.000 315: Vo = 1.110 - 0.0097w; r = 0.997 GMA: V o = 1.111 - 0.0099w; r = 1.000 S p e c if ic v o lu m e a t R T , V o ( mL /g) w (wt% MMT)
Fitting the data to the theoretical equations provides two
main sets of information:
The hole fraction, h = h(P, T), and
The reducing parameters: P*, V* and T*, from which the bulk-average interaction parameters, <ε*> and <v*>, could be
computed.
The temperature and pressure dependent h-function was
shown to correlate with the degree of exfoliation.
The concentration dependent interaction parameters
have been used to examine PA-based PNC structure on
the molecular level.
All compositions were analyzed
To determine the molecular model, the data without a
compatibilizer (i.e., PP + C15A) were used.
29
PVT of PP-based PNC 4
Computed values of the characteristic reducing parameters, as well as assessment of the goodness of fit are presented above.
For the sake of comparison the data published by Zoller are also shown.
To develop a model, first only the samples: A, B, 1, and 5 were used.
Computed S-S eos parameters for PP and PP-PNC
# Code Sci# C15A Mo P* (bar) 10000V* T* (K) r2 σ
IPP Zoller ppz 0 40.853 6043 ± 79 1,1827 ± 24 10535 ± 56 0.999997 0.002045 0 PP 2845 0 50.459 4973 ± 113 1,1932± 42 10804 ± 117 0.999998 0.001706 A PP256 256 0 43.115 5727 ± 68 1,1728 ± 22 10449 ± 57 0.999998 0.001647 1 E0-2100 2867 2 48.364 5169 ± 103 1,1874 ± 37 10712 ± 98 0.999998 0.001916 B PP256 pnc 3 46.720 5457 ± 55 1,1712 ± 18 10775 ± 49 0.999998 0.001845 2 E1-2-E43 3578 2 49.432 5230 ± 117 1,2060 ± 42 11251 ± 120 0.999996 0.002505 3 E1-2-3150 3045 2 51.585 4923 ± 99 1,1971 ± 37 10970 ± 101 0.999996 0.002482 4 E2-2GMA 2923 2 47.774 5247 ± 95 1,1993 ± 34 10848 ± 90 0.999997 0.002261 5 E0-3200 2989 4 50,748 5028 ± 93 1,1857 ± 34 10917 ± 92 0.999997 0.002274 6a E1-E43 3069 0 49.194 5111 ± 95 1,1926 ± 34 10820 ± 91 0.999997 0.002350 6b E1-4-E43 367 4 45.611 5625 ± 146 1,1731 ± 48 10860 ± 132 0.999996 0.002421 7 E1-4-3150 3450 4 48.490 5266 ± 93 1,1931 ± 33 10993 ± 91 0.999996 0.002554 8 E2-4GMA 3151 4 49.412 5203 ± 96 1,1807 ± 34 10952 ± 94 0.999997 0.002272 9 M1 3167 2 52.238 4924 ± 90 1,2000 ± 34 11138 ± 95 0.999997 0.002256 10 M2 3224 2 46.893 5483 ± 105 1,1784 ± 36 10933 ± 100 0.999997 0.002251
PVT of PP-based PNC 5
Basics:
The “molecular mass” of clay platelet 100 nm diameter and 1 nm thick:
M = NA ρπd2h/4 = 10,878 (kg/mol).
The “molecular volume” of clay platelet:
Vplat = M/ρ = NA π(d/2)2h = 4.73 106 (mL/mol).
The lattice is built of cells of constant volume, accommodating one hard core statistical segment of clay or one hard core statistical segment of PP with the molecular volume of:
v*hard = 28.9/21/2 = 20.4 (mL/mol).
Thus, the number of segments for PP (s1) and clay (s2) are:
s1(PP) = 4871, and
s2 = Vplat/v*hard, = 2.6873 105
The site fractions are defined as:
X1 = 1 = X2 = x1zq1/( x1zq1 + x2zq2)
31
PVT of PP-based PNC 6
The input data are:
There are two possibilities of interpretation:
Assume that organoclay platelets are dispersed in PP matrix as short stacks – no good (see Figure ⇒). Assume inorganic platelets are coated with 6 nm thick solidified PP and dispersed in PP matrix with properties changing with the distance from the clay platelet.
Depending on the assumption the
side fractions, X
i, will vary.
28.5 29.5 30.5 31.5 50 54 58 62 0 1 2 3
PP with Cloisite 15A
EAV EAV calc VAV VAVcalc <ε*> <v*> Clay content, w (wt%)
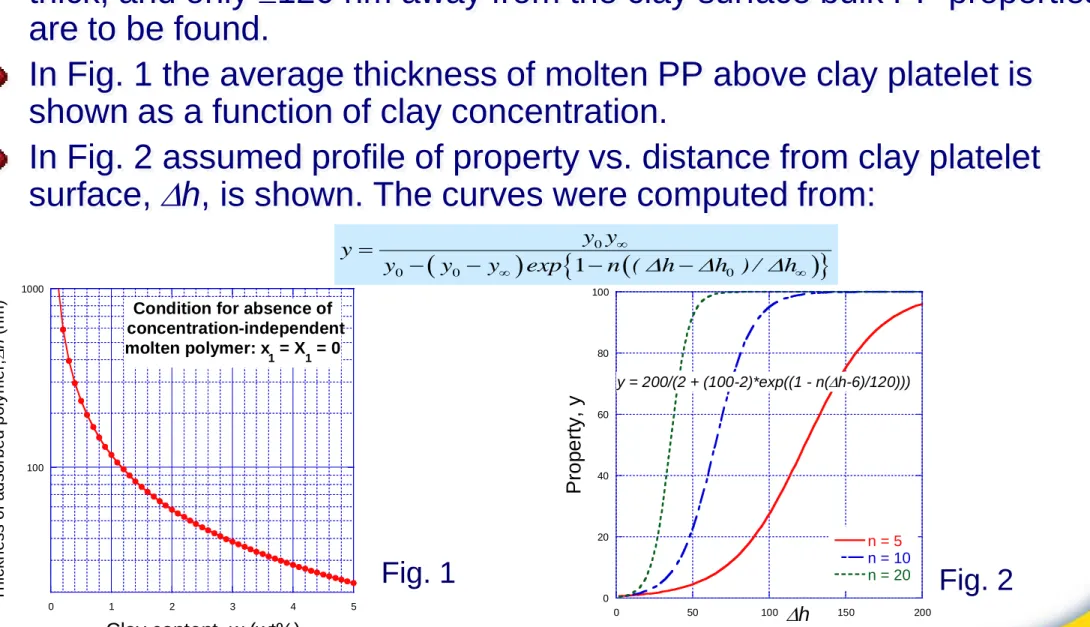
The second assumption implies that the solid components are 13 nm thick, and only ≥120 nm away from the clay surface bulk PP properties are to be found.
In Fig. 1 the average thickness of molten PP above clay platelet is shown as a function of clay concentration.
In Fig. 2 assumed profile of property vs. distance from clay platelet
surface, ∆h, is shown. The curves were computed from:
PVT of PP-based PNC 7
( ) { 0 ( )} 0 0 1 0 y y y y y y exp n (∆h ∆h ) / ∆h ∞ ∞ ∞ = − − − − 0 20 40 60 80 100 n = 5 n = 10 n = 20 Pro p e rt y, y y = 200/(2 + (100-2)*exp((1 - n(∆h-6)/120))) 100 1000Condition for absence of concentration-independent molten polymer: x 1 = X1 = 0 T hi c k ne s s of a ds o rb ed po ly m er , ∆ h (n m) Fig. 1 Fig. 2
33
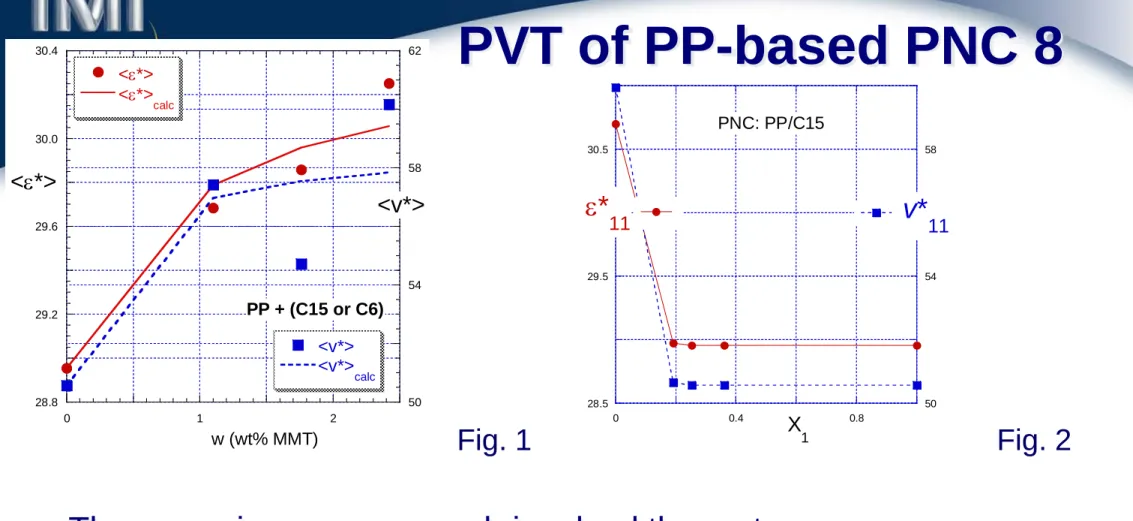
The more rigorous approach involved three steps:
Calculate ∆h as a function of clay content
Calculate and in terms of ∆h
Optimize the fit to Simha-Jain binary interactions Eqs.
The approach provides the best fit to data (see Fig. 1), and acceptable parameter values:
Figure 2 illustrates the predicted variation of matrix properties.
PVT of PP-based PNC 8
Fig. 2 Fig. 1 11 * v 11 * ε 28.8 29.2 29.6 30.0 30.4 50 54 58 62 0 1 2 PP + (C15 or C6) <ε*> <ε*> calc <v*> <v*> calc <ε*> <v*> w (wt% MMT) * * * * * * 22 30.3 1.0; 22 / 10 1.047; v22 58.6± 1.0; v / v22 10 1.158 ε = ± ε ε = = = 28.5 29.5 30.5 50 54 58 0 0.4 0.8 PNC: PP/C15 ε* 11 v*11 X 1Computed S-S eos parameters for all samples # C15A Mo P* (bar) 10000V* T* (K) <ε*> <v∗> 0 40.853 6043 ± 79 1,1827 ± 24 10535 ± 56 29.2 ± 0.2 48.3 ± 0.1 0 0 50.459 4973 ± 113 1,1932± 42 10804 ± 117 29.9 ± 0.3 60.2 ± 0.2 A 0 43.115 5727 ± 68 1,1728 ± 22 10449 ± 57 29.0 ± 0.2 50.6 ± 0.1 1 2 48.364 5169 ± 103 1,1874 ± 37 10712 ± 98 29.7 ± 0.3 57.4 ± 0.2 B 3 46.720 5457 ± 55 1,1712 ± 18 10775 ± 49 29.9 ± 0.1 54.7 ± 0.1 2 2 49.437 5230 ± 117 1,2060 ± 42 11251 ± 120 31.2 ± 0.3 59.6 ± 0.2 3 2 51.585 4923 ± 99 1,1971 ± 37 10970 ± 101 30.4 ± 0.3 61.8 ± 0.2 4 2 47.774 5247 ± 95 1,1993 ± 34 10848 ± 90 30.1 ± 0.2 57.3 ± 0.2 5 4 50.748 5028 ± 93 1,1857 ± 34 10917 ± 92 30.3 ± 0.3 60.2 ± 0.2 6a 0 49.194 5111 ± 95 1,1926 ± 34 10820 ± 91 30.0 ± 0.3 58.7 ± 0.2 6b 4 45.611 5625 ± 105 1,1731 ± 33 10860 ± 90 30.1 ± 0.3 53.5 ± 0.2 7 4 48.490 5266 ± 93 1,1931 ± 33 10993 ± 91 30.5 ± 0.3 57.9 ± 0.2 8 4 49.412 5203 ± 96 1,1807 ± 34 10952 ± 94 30.4 ± 0.3 58.3 ± 0.2 9 2 52.238 4924 ± 90 1,2000 ± 34 11138 ± 95 30.9 ± 0.3 62.7 ± 0.2
Numerical values of the
bulk-average interaction parameters, <ε*> and <v*> are shown (with error range) in the Table &
Figure.
Addition of organoclay (and epoxy) increases <ε*>, while addition of compatibilizer
increases <v*> (e.g., see 4%E).
PVT of PP-based PNC 9
Correlation between <ε*> and <v*> was observed, e.g., for PS with different MW.
The scatter in the Figure indicates structural differences in these PNC’s 48 52 56 60 64 28.5 29.5 30.5 31.5
All PNC & PP samples
<v*> = -105 + 5.4<ε*>; r = 0.764 <v*> <ε*> Zoller PP PP256 4%C+GMA 2%C+GMA 4%C+315 2%C+315 2%C+epoxy 2%C+epoxy + 315 2%C15 4%C15 2%C+E 8%E43 PP-extr 4%C+E 3%C6
35
Next, the variation of hole
fraction with composition was examined by computing the relative rations of the specific volume and the hole fraction:
Vr ≡ V(PNC)/V(PP) hr ≡ h(PNC)/h(PP).
The Figure for PP/C15A series shows that addition of
organoclay (no compatibilizer) has very little effect on sample density, but it reduces the free volume (at P = 10 MPa):
At 2 wt% C15A by ca. 4.7% At 4 wt% C15A by ca. 8.0%
PVT of PP-based PNC 10
0.9 0.94 0.98 1.02 440 480 520 560PP with 2 or 4 wt% C15A at P = 10 MPa
V r (2%) V r (4%) h r (2%) h r (4%) h r = h (P NC )/ h (PP) ; V r = V( PN C) /V( PP) T (K)
Owing to lower compressibility of PNC than that of a polymer the magnitude of hr increases with P.
The hole fraction, h = h(T), at
P = 10 MPa is shown in the
Figure for all tested samples. The data fall into 3 groups:
PP – the highest h PP + 4%C15A
PP + 2%C15A (+epoxy)
Reduction of free volume in PNC is mainly by 7 to 9%.
For 2-wt%C15 + E43 the reduction is by 12%
Addition of 2-wt% C15A + ½wt% epoxy reduces free volume by 11% (with 3150 by 8%). Incorporation of compatibilizer
PVT of PP-based PNC 11
0.11 0.13 0.15 0.17 0.19 440 480 520 560h = h(T) at P = 10 MPa for all samples
PP 2%C+E 4%C+E 2%C+315 4%C+315 2%C+GMA 4%C+GMA 2%C+epoxy 2%C+epoxy+4%315 H o le fr act ion, h (-) T (K)
37
Considering that h1/5 = h(T)
has a similar slope for all
tested samples, the value of h at P = 100 MPa and T = 500 K were computed.
The Figure shows that there is an excellent correlation (within the limit of experimental error indicated by the bars) between
h1/5 and <ε*>.
Thus, one can use either of these two parameters in a search for correlations with other PNC measures, viz. interlayer spacing, tensile properties, impact strength, etc.
PVT of PP-based PNC 12
6 6.4 6.8 7.2 29 30 31Inverse hole fraction vs. bulk interaction parameter for PP PNC 1/h 1/5 = -5.473 + 0.401<ε*>; r = 0.998
1
/h
1 /5 <ε*> h1/5 was computed for:
Interlayer spacing vs. free
volume reduction
The interlayer spacing, d
001,
was found to correlate with the
reduction of the polymer free
volume content,
∆h.
At low clay content ∆h is
proportional to clay content, w. At constant organoclay content (e.g., 2 wt%) ∆h increases with
interlayer spacing, d001.
While XRD detects the
presence of crystals, the PVT
reflects on the bulk adsorption
of polymer by the solid clay.
2 6 10 14
0 4 8 12 16
Correlation for 2 wt% organoclay
∆h = 2.5 + 0.833d 001; r = 1 ∆ h (% )= 1 00[ h( po ly) h( P N C )] /h (pol y ) d 001 (nm) PA-6 PP PS
39
The interlayer spacing, d001, for
selected samples (containing 2-wt% C15A) were measured using
WAXS-XRD at Steacie Institute in Ottawa and at IMI.
Several compositions were
measured using different specimens – the standard deviation of the data was established as ± 0.15 nm.
The Figure illustrates the correlation
between d001, and computed from
the PVT data reduction of h (at 100 MPa; 500 K).
PVT of PP-based PNC 13
2 6 10 14 0 4 8 12 16Correlation for 2 wt% organoclay
PNC without compatibilizer: ∆h = 2.50 + 0.833d 011; r = 1 PP-PNC with compatibilizer: ∆h = -21.73 + 9.38d 001; r = 0.927 ∆ h ( % )= 10 0[ 1 h( P N C )/ h( pol y )] d 001 (nm) PA-6 PP PS
Two dependencies are seen:
For a two component PNC (polymer/organoclay)
For three component: PP/organoclay/compatibilizer systems.
The compatibilizers (PP grafted with MAH or GMA) dramatically reduced h with only a small effect on d001 (immiscibility?).
The experimental values for Young modulus (Y), or for the notched Izod impact strength (NIRT) show poor correlation with the PVT parameters.
PVT of PP-based PNC 14
1 2 3
0.14 0.15 0.16
All NIRT data for PP-based PNC
all NIRT no comp E43 3150 GMA epoxy No tc h I z o d a t RT , N IRT ( k J /m 2 ) Hole fraction, h (-) 1.6 2 2.4 0.14 0.15 0.16
All data for PP-based PNC
all Y-values no comp E43 3150 GMA epoxy T en s ile m odu lus , Y ( G P a ) Hole fraction, h (-) PP; Y = 1.7
41
PP-based PNC morphology
In a recent paper iPP-based PNC were prepared with w
(wt%) of ODA-MMT & 3w of MA-g-PP (Polybond®).
Top Figures show polarized light images of spherulites statically crystallized without MMT (c), and with 10-wt% ODA-MMT (f).
Bottom Figures show polarized
light micrographs of sheared at = 0.685 (1/s) PNC with
6-wt% ODA-MMT; (b) and (d) indicate iPP of Mw = 400 and 250 kg/mol, respectively.
R. Nowacki, B. Monasse, E. Piórkowska, A. Gałęski, & J. M. Haudin, “Spherulite nucleation in isotactic PP based nanocomposites with montmorillonite under shear”, Polymer, ASAP (2004).
Conclusions
Simha-Somcynsky configurational thermodynamic theory provides good description of the PVT behavior of liquids, including molten polymers, their blends, foams, composites and PNC.
For any substance, the computed hole fraction, h, is a measure of the
free volume fraction: f = 1 - (Vo /V).
Analysis of PVT behavior of PNC indicates the presence of a
solidified layer on the clay surface, followed by molten polymer with mobility that increases with the distance from clay surface – the “hairy clay platelet” model, HCP.
The values of h well correlate with viscosity η = η(P, T, φ), and the
interlayer spacing, d001, of PNC’s.
In the PP-based PNC, at constant organoclay loading (2-wt%) d001
well correlates with 1/h (or with h).
Addition to PP of organoclay + compatibilizer (1:2 wt ratio) results in a complex set of properties, hardly related to exfoliation.
43
Acknowledgments
The PVT was measured by Mr. Ghislain
Chouinard.
The PP-based PNC samples were formulated
by Dr. T-M Ton-That and compounded by Mr.
Yves Simard.
The interlayer spacing was determine by Ms.
Florence Perrin- Sarazin.
The mechanical properties were determined by
Ms. Manon Plourde.
Future work
Prepare manuscript for publication (
before June 2006
with the PNC-Tech members permission
).
Extend the study of the relation between the free
volume fraction and the interlayer spacing to
additional systems, viz. PCN based on PA-6 from
Toyota R&D and from IMI; new set of PP-based PNC
prepared at IMI; new set of PS-based PNC prepared
using MMT pre-intercalated with end-terminated
oligo-styrene.
Examine miscibility in molten PP nanocomposites
containing macromolecular compatibilizers.
45
Useful references
1. Ton-That M.-T., Perrin-Sarazin F., Cole K. C., Bureau M. N., Denault J., “Polyolefin Nanocomposites: Formulation and
Development”, Polym. Eng. Sci., (2004).
2. Ton-That M.-T., Utracki L., Cole K., Denault J., “Polymer
Nanocomposites based on Modified-Compounds”, US Pat. Appl.,
60/416,417; to National Research Council of Canada.
3. L. A. Utracki, “Clay-Containing Polymeric Nanocomposites”, ca.
Appendix
Examples of the PVT measurements
applications
Solubility parameters & polymer/polymer
miscibility
Constant stress viscosity for low molecular
weight (solvents) and high molecular weight
(molten polymer) liquids
Foamability
Surface tension
Positron-annihilation lifetime spectroscopy
(PALS)
47
Solubility theory
Theoretically [van der Waals] the solubility parameter, δ, is inversely proportional to specific volume, V, i.e.:
For low molecular weight solvents Hildebrand, found that empirical value of the exponent n varies from about 0.89 to 1.09 (SiCl4 or n-C7H16), i.e., n = 0.99 ±
0.10.
The variation of n was considered to result from the fact that besides the van der Waals dispersive forces the polar and hydrogen bonding interactions
contribute to the internal energy.
The Hildebrand’s empirical relation translates into:
For ambient pressure S-S theory gives m = 0.97 hence
n = 0.98, in agreement with an average experimental exponent for solvents.
Refs.: L. A. Utracki and R. Simha, “Statistical thermodynamics predictions of the solubility parameter”,
Polym. Int., 53, 279-286 (2004); L. A. Utracki, “Statistical thermodynamics evaluation of solubility
parameters and polymer miscibility”, J. Polym. Sci. Polym. Physics, in press (2004).
. ;
1
nV
const
n
δ
⋅
≈
=
(
)
/ m 1 / 2 U = A V with n = m +Computation of
δ , #
1
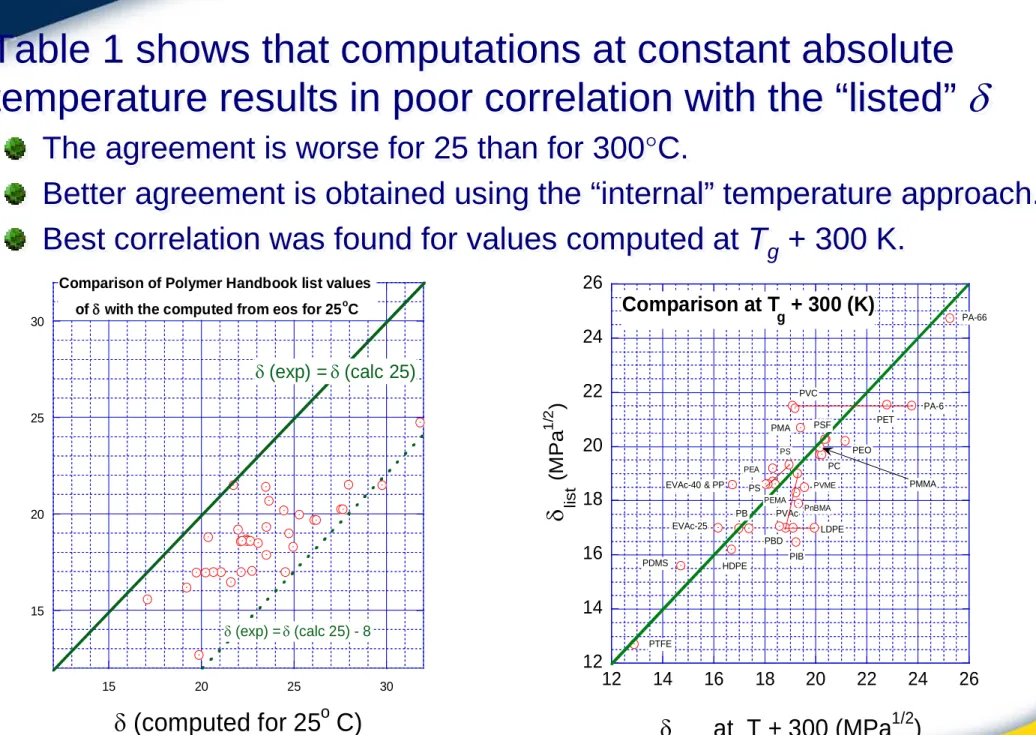
To compute the solubility parameter values from S-S eos the reducing parameters, P*, T* and V*, must be known and the value of the independent variables selected.
The reducing parameters published by Rodgers, Zoller and Walsh, and those determined by the authors were used.
The computations were carried out for ambient pressure:
P = 0.10132 MPa and several temperatures, viz. T = 25 and
300°C, as well as at Tg and Tg + 300 (K) .
Example of the results are presented in Table 1 and two Figures on the following slides.
The listed values of δ from Polymer Handbook are also shown.
In contradiction with the thermodynamic definition of the intensive
functions, the δ−values for polymers depend on solvent.
The range of listed values is wide, e.g., from 16 to 27 MPa1/2 for
PEA in “moderate bonding” solvent, or from 17 to 22 MPa1/2 for
49
Computation of
δ #2
Table 1 shows that computations at constant absolute
temperature results in poor correlation with the “listed”
δ
The agreement is worse for 25 than for 300°C.
Better agreement is obtained using the “internal” temperature approach. Best correlation was found for values computed at Tg + 300 K.
15 20 25 30
15 20 25 30
Comparison of Polymer Handbook list values of δ with the computed from eos for 25oC
δ lis t δ (computed for 25o C) δ (exp) = δ (calc 25) δ (exp) = δ (calc 25) - 8 12 14 16 18 20 22 24 26 12 14 16 18 20 22 24 26 Comparison at T g + 300 (K) δ lis t (M P a 1 /2 ) δ calc at Tg+ 300 (MPa 1/2 ) PA-66 PA-6 PET PVC PEO PMA PC PSF PIB LDPE EVAc-25 HDPE PDMS PTFE EVAc-40 & PP PnBMA PVME PS PEA PEMA PVAc PBD PMMA PS PB
Free volume argument
Left: computed
values of h at 25°C
(solid) and at T
g+
300°C
(cross-hatched) for 29
polymers.
The average
difference:
At 25°C h-values for
solvents are
comparable, viz.
h = 0.17, 0.24
for n-C
12or CO
2,
0 0.1 0.2 0.3 0.4 0.5 EVAc40 HDPE LDPE PA-6 PA-66 PB PBD PC PCHMA PDMS PEA PEMA PEO PET PIB PMA PMMA PnBMA PoMS PP PPE PPG PS PSF PSF PTFE PVAC PVC PVME h(T g+ 300) h(25) g T 300 25 Ch
h
h
0.18
∆
≡
+−
°
51
Polymer-polymer miscibility, #1
The general condition for polymer-polymer miscibility is that the Gibbs free energy of mixing is negative:
The three principal contributions are:
Heat of mixing:
H-F combinatorial entropy Non-combinatorial entropy
Hildebrand wrote:
Thus, for polymer-polymer miscibility ∆Hm = 0 and ∆Sm,nc<0 are required, the latter explicitly given by Nies et al. [1990].
m m m
G
H
T S
0
∆
=
∆
−
∆
<
m H 1 2 o H ( RTV / V ) ∆ = χ φ φ m ,nc S 1 2 o S ( RTV / V ) ∆ = χ φ φ m ,c i i i S R N ln 0 ∆ = −∑
φ → 2 m 1 2 o 1 2 H ( RTV / V )( ) ∆ =φ φ δ δ−Polymer-polymer miscibility, #2
The Figure shows δ vs. T for 20 polymers.
The ovals indicate resins known to be miscible, viz.
PVC/PVAc, PC/PMMA and
PS/PVME.
Three pairs: PET/PSF,
PBD/EVAc40 and
LDPE/EVAc25 may be miscible.
PDMS and PTFE as well as PA-66 are immiscible with most polymers – on the Figure they are the furthest apart. 10 15 20 25 30 100 150 200 250 300 PVME PVC PVAc PS1301 PPE PMMA PC EVA40 EVA25 PTFE PSF PET PDMS PBD LDPE PA-66 PA-6 S ol ub ili ty pa ra m e ter , δ o 1 2 3 4 5 6
53
The closeness of
δ
vs. T dependence for PSF/PET
and PVC/PPE may be taken as an indication of the
unreported miscibility.
There is no sign of LCST (= 140°C) in PC/PMMA.
The deficiency may be due either to:
Neglected entropic non-combinatorial effects.
Neglected balance of the dispersive, polar and
hydrogen bonding interactions, as described by
Charles Hansen.
The latter can be expressed as:
2 2 2 2
m i j i j d i j p i j h
U /(V
)
(
)
(
)
(
)
∆
≡
∆
φ φ
=
δ δ
−
+
δ δ
−
+
δ δ
−
To calculate ∆2 values of δ
d, δp, δh, and their temperature gradients were taken
from Hansen’s Handbook:
PC(#211)/PMMA(#208) and PVC(#205)/PVAc(#204)
The polymer thermal expansion coefficients were taken from Polymer Handbook.
Results shown in the Figures contradict the observations.
A comment: owing to large combinatorial entropy effects, the computed ∆δ2 = 0
0 10 20
100 200 300
Miscibility of PC/PMMA system
(δ d1 - δd2) 2 (δ p1 - δp2) 2 (δ h1 - δh2) 2 ∆2 S o lub il it y p ar am et e r di ff er e nc e s q ua red Temperature, T (K) 0 10 20 30 100 200 300
Miscibility of PVC/PVAc system
(δ d1 - δd2) 2 (δ p1 - δp2) 2 (δ h1 - δh2) 2 ∆2 S ol u bi lit y pa ra m e ter d if fe ren c e s qu ar ed Temperature, T (K)
Polymer-polymer miscibility, #4
55
The flow behavior has been empirically related to the
free volume through ρ – the density:
(1913) : / ; ( / ) 1; 1 1 (1951) : ln / ; ( / ) 1; ln B B B D D D D o Batschinski A B f f Doolittle A B f f T T η ρ ρ η ρ η ρ ρ η = + = − ∴ ∝ = + = − ∴ ∝ −
Free volume & flow 1
S-S eos explicitly provides
a measure of f: h = h(T, P).
The
η
=
η
(h) of n-paraffins were
linearized when plotted as:
log
/ ;
( , )
log
1/ ( , )
U U UA
B
Y
Y
C
h T P
h T P
η
η
=
+
=
+
∴
∝
Ref.: L. A. Utracki: "Temperature and Pressure Dependence of Liquid Viscosity”, Canadian J. Chem. Eng., 61, 753 – 758 (1983).
P & T dependent η for 15 hydrocarbons and their mixtures were superimposed on master curves when plotted vs. h.
For all systems η = η(T, P) = η(h) was found.
In athermal mixtures hmixture < (h1 + h2)/2, i.e., better packing.
The concentration effects could be eliminated by plotting:
Free volume & flow 2
const 0 1 c * c 2
ln
b
b Y
Y
1 /( b
/
)
ση
φ φ
== +
≡
+
Ref.: L. A. Utracki: "Correlation between P – V – T Behavior and the Zero – shear Viscosity of Liquid Mixtures”, in
"Thermodynamics and Rheology”, B. Hartmann (Ed.), J.
57
PMMA samples with Mw/ Mn = 2 were measured at T = 493-523 K, and
P = 0 - 173 MPa — parallel straight lines were obtained.
Similarly, for PS, the data at T = 165-210°C, and P = 0 - 140 MPa followed a single straight-line master dependence [Utracki, 1985].
Two series of PE's were analyzed, one having constant Mn (left Figure below) and the other having nearly constant polydispersity index, Mw/ Mn (right
Figure below) [Utracki, 1985].
Good superposition was obtained — for constant polydispersity resins the master curves were paralleled.
59
Solubility of CO2 in PS was computed using the S-S theory.
In the Figure, lines show the theoretical predictions
[Simha & Moulinié, 1999],
symbols are experimental
[Sato et al., 1996].
Deviation from linearity was observed for PC/CO2.
0 20 40 60 80 100 120 0 5 10 15 20 25 S ( m g/ g) p(MPa) 373 K 453 K
CO
2solubility in PS
Solubility of CO2 in PS was computed using the S-S theory.
In the Figure, lines show the theoretical predictions [Simha & Moulinié, 1999], symbols are experimental [Sato et al., 1996].
Extrusion foaming
Commercial grade
PS
was extrusion foamed using a
co-rotating, fully intermeshing twin-screw Leistritz extruder
(D = 34 mm, L/D = 42).
The physical foaming agents (PFA) were:
Carbon dioxide (
CO
2, up to 5 wt% )
1,1,1,2-tetrafluoroethane (
HFC-134a
, up to 15 wt%),
1-chloro-1,1-difluoroethane (
HCFC-142b
, up to 15 wt%).
Constant stress viscosity,
η
, at
σ
12= 40 kPa was measured
using an “on-line” melt flow monitor. P & T varied as:
P
≅ 5 to 13 MPa and T ≅ 110 to 210°C [
Gendron and Correa, 1998].
In addition the laboratory
η
ovs. P, T data for systems:
PS/CO
261
Calculations
The calculations proceeded in three stages:
Determination of the reducing parameters values : P*, V*, T*, as well as the molecular constants: c and s. For this purpose the simultaneous least squares fit of the theoretical equations to the experimental PVT data was performed.
Analysis of the computed hole fraction behavior,
h = h(P, T), and its relation to the “classical” free volume
fraction:
f(P, T) = 1 – Vo/V(P, T).
Examination of the constant stress viscosity behavior as a function of either h or f in the full range of the experimental variables: P, T, and PFA concentration.
To fit the S-S eos to the experimental PVT data the “Scientist”
0.7 0.8 0.9 1 1.1 1.2 0 5 10 15 20 25 30 35
PVT plot for HFC-134a
Data Program-2 Program-1 Program-3 S p e c if ic v o lu m e , V ( m L /g ) P (bar)
PVT of physical
foaming agents 1
Saturation specific volume vs. pressure for CO2 and HFC-134a. Experimental data - points; computed - curves.
In these computations three programs assumed, respectively:
(1) s = c = 1, (2) s = 1 but c is adjustable, (3) s and c are adjustable
S p e c if ic v o lu m e ( m L /g )
63
Reducing parameters for
PFA
Values of the 5 eos parameters for the PFA.
Three programs differed by assumptions of the c and s variability. The correlation coefficient squared, r2, is also given.
Parameter Program-1 Program-2 Program-3
CO2. VW = 0.3863 (mL/g) T*(K) 2965.3 ± 3.3 3976.9 ± 7.0 4009 ± 248 V*(mL/g) 0.5923 ± 0.0024 0.6594 ± 0.0010 0.6616 ± 0.0092 P*(bar) 9458 ± 24 6007.0 ± 9.8 5949 ± 225 s 1 1 1.000 ± 0.041 3c 3 1.582 ± 0.012 1.559 ± 0.093 r2 of fit 0.99954 0.99996 0.99999 HFC-134a VW = 0.3650 (mL/g) T*(K) 4175 ± 151 6923 ± 1722 6133 ± 469 V*(mL/g) 0.632 ± 0.021 0.6688 ± 0.0311 0.6258 ± 0.0061 P*(bar) 5385 ± 187 2494 ± 368 2724.2 ± 322 s 1 1 1.051 ± 0.074 3c 3 0.8871 ± 0.3617 1.076 ± 0.092 r2 of fit 0.99705 0.99925 0.999996 HCFC-142b VW = 0.3987 (mL/g) T*(K) 4255 ± 42 6058 ± 31 6762 ± 118 V*(mL/g) 0.6791 ± 0.0070 0.7128 ± 0.0010 0.7235 ± 0.0029 P*(bar) 5105 ± 51 2866.2 ± 9.3 2043.9 ± 199 s 1 1 1.001 ± 0.053 3c 3 1.242 ± 0.011 0.794 ± 0.042 r2 of fit 0.99911 0.999994 0.999994
PS/PFA viscosity
For extrusion foaming (w is PFA wt fraction):
It provided good superposition for all three sets of data on a single dependence (see ai parameters in the Table, below).
The only adjustable parameter is the efficiency parameter, k, that accounts for PFA incomplete solubility and losses during extrusion. The correlation coefficient squared, R2 ≥ 0.98, and the standard
deviation, σ ≤ 0.17 are quite reasonable for the industrial process.
/ 1 2 2 2 log /( ) (1 ) /( ) ( ) 1.1887 ; ( ) PS PFA o s s PFA PS a a Y Y w a h w a h a PS w k w measured η = + = + + − + = = ⋅
Parameter PS PS/CO2 PS/HCF-134a PS/HCFC-142b
-ao 103.03 100.79 80.762 98.312
a1 133.97 131.09 105.29 128.04
kc -- 0.7691 0.5842 0.8968
65 0 0.5 1 1.5 2 2.5 3 3.5 4 0.76 0.765 0.77 0.775 0.78 0.785 log η(CO 2) + 2 log η(HFC-134a) + 1 log η(HCFC-142b) log η ( kP a s) Y s
PS/PFA viscosity - extrusion
The proposed relation requires three parameters, ai, to describe
polymer melt viscosity and (for extrusion foaming) an efficiency parameter k.
Ref.: L. A. Utracki and R. Simha, ″Free Volume and Viscosity of Polymer – Compressed Gas Mixtures During Extrusion Foaming”, J. Polym. Sci., Part B: Polym. Phys., 39 (3), 342-362 (2001).
Empirically, at P = 0 there is a linear correlation between the surface tension coefficient, ν1(T), and the hole fraction, h(T). From Guggenheim’s equation and the observed linearity of νi = νi(h) Simha and Jain derived the universal relation:
Thus, the Guggenheim’s relation can be written in terms of scaled variables.
Once the PVT behavior of a given liquid is known, the
h = h(T, P) may be computed and the surface tension
can be predicted.
Accordingly, the T- and P-variations of ν = ν(h) are the same as
Surface tension 1
11/ 9 1 1 *2 * 1/ 3 */
0.73 0.01
( )
(1
/
)
/
1.88 0.13
( )
( )
0.036(
)
3.95 ;
127.9 0.0783
o io i io c io i o io ca
T
T T
a
T
a
a h T
P T
T
T
ν
ν
ν
ν
ν
ν
=
±
=
−
=
±
=
−
=
−
=
+
67
In the Figure below, predictions of Simha & Jain relation (crosses) are compared to experimental data (circles) for two polymers and a
copolymer.
S-J prediction is well confirmed not only for non-polar atactic
polypropylene (aPP), but also for polar poly(ethylene glycol) and EVAc.
Surface tension 2
T(°C)
Linearity:
ν = a – bT ; b > 0
has been observed for 2200 liquids in data compiled by
Jasper [J. Phys. Chem.
Reference Data, 1, 841
PALS 1
During the last 20 y PALS has been serving as an atomic-scale probe for the direct measure of the free volume.
Positron (Ps) is a positively charged electron emitted through decay
of 22Na. It penetrates a few hundred µm into a material.
From the annihilation spectrum (below) the curve fit determines lifetimes (τi) and intensities (Ii) of 3 or 4 positronium species.
The decaying function is computer-fitted to 3 or 4 exponentials:
{
}
( ) exp /
i oi i
N t = N −t
τ
The free volume cavity radius is related to the lifetime, τi:
1 3 sin(2 / ) 1 1 2 2 0.1656 ( ) 4 / 3 i i o i o o i i R R R R R R nm V R
π
τ
π
π
− = − + = + =69
PALS vs. hole fraction, h
Ortho-positronium
spectroscopy provides:
Lifetime,
τ
3Intensity, I3 ≅ constant
The free volume fraction
is written as:
h
ps= CI
3<v
f(τ
3)>
where the average cavity
volume: <v
f> = <v
f(τ
3)>
QUESTION:
PALS vs. hole fraction, h
Schmidt & Maurer [2000] measured PALS and PVT for PMMA in the
glassy and molten states. From PVT data h = h(T) was computed from the S-S theory.
The data follow the relation:
h
=
0.018 0.5825 V( ) ;
+
×
τ
3r
2=
0.999
In this treatment the holes are represented by an average value computed from the third (the slowest) decay function, τ3.
Thus, in PMMA glass and melt the average diameter of the free volume spheres
71
Glassy state 1
Equilibrium melt
The computed from S-S theory h agrees with the average value of the free volume measured by PALS.
It also provides good correlation with physical properties that
depend on the free volume.
Steady-state glass
Comparing hglass with h
computed from S-S theory for a liquid at the same P and T, one can define the frozen fraction as: FF = (h – hglass)/h.
![Figure below) [Utracki, 1985] .](https://thumb-eu.123doks.com/thumbv2/123doknet/14189908.477826/59.1188.630.1074.396.891/figure-below-utracki.webp)
