Publisher’s version / Version de l'éditeur:
Journal of the Audio Engineering Society, 44, 4, pp. 266-273, 1996-04-01
READ THESE TERMS AND CONDITIONS CAREFULLY BEFORE USING THIS WEBSITE. https://nrc-publications.canada.ca/eng/copyright
Vous avez des questions? Nous pouvons vous aider. Pour communiquer directement avec un auteur, consultez la
première page de la revue dans laquelle son article a été publié afin de trouver ses coordonnées. Si vous n’arrivez pas à les repérer, communiquez avec nous à [email protected].
Questions? Contact the NRC Publications Archive team at
[email protected]. If you wish to email the authors directly, please see the first page of the publication for their contact information.
NRC Publications Archive
Archives des publications du CNRC
This publication could be one of several versions: author’s original, accepted manuscript or the publisher’s version. / La version de cette publication peut être l’une des suivantes : la version prépublication de l’auteur, la version acceptée du manuscrit ou la version de l’éditeur.
Access and use of this website and the material on it are subject to the Terms and Conditions set forth at
Optimizing the decay range in room acoustics measurements using
maximum-length-sequence techniques
Bradley, J. S.
https://publications-cnrc.canada.ca/fra/droits
L’accès à ce site Web et l’utilisation de son contenu sont assujettis aux conditions présentées dans le site LISEZ CES CONDITIONS ATTENTIVEMENT AVANT D’UTILISER CE SITE WEB.
NRC Publications Record / Notice d'Archives des publications de CNRC:
https://nrc-publications.canada.ca/eng/view/object/?id=8ca1b1cb-7003-4907-b864-874811a8a8db https://publications-cnrc.canada.ca/fra/voir/objet/?id=8ca1b1cb-7003-4907-b864-874811a8a8db
http://www.nrc-cnrc.gc.ca/irc
Opt im izing t he de c a y ra nge in room a c oust ic s m e a sure m e nt s using
m a x im um -le ngt h-se que nc e t e c hnique s
N R C C - 3 8 8 4 5
B r a d l e y , J . S .
A p r i l 1 9 9 6
A version of this document is published in / Une version de ce document se trouve dans:
Journal of the Audio Engineering Society,
44, (4), pp. 266-273, April 01, 1996
The material in this document is covered by the provisions of the Copyright Act, by Canadian laws, policies, regulations and international agreements. Such provisions serve to identify the information source and, in specific instances, to prohibit reproduction of materials without written permission. For more information visit http://laws.justice.gc.ca/en/showtdm/cs/C-42
Les renseignements dans ce document sont protégés par la Loi sur le droit d'auteur, par les lois, les politiques et les règlements du Canada et des accords internationaux. Ces dispositions permettent d'identifier la source de l'information et, dans certains cas, d'interdire la copie de documents sans permission écrite. Pour obtenir de plus amples renseignements : http://lois.justice.gc.ca/fr/showtdm/cs/C-42
Optimizing the Decay Range in Room Acoustics
Measurements using Maximum-length-Sequence
Techniques*
JOHN S. BRADLEY, AES Member
National Research Council of Canada, Institute for Research in Construction, Ottawa, Ont.. Canada KIA OR6
A practical examinatioo of the factors influencing the decay range nf room acoustics
measurements using ュ。クゥュオュセャ・ョァエィMウ・アオ・ョ」・ measurement techniques is presented. A series of systematic measurements were madetoexamine the effects of outputsignal level, ambient noise level, sequence length, and number of averages on the decay range of measured
sound decays.Theeffects of small amounts of time variation and the sequence length relative to the measured reverberation times are also included. Astep-by-step approachtooptimizing
the decay range of measured room responses concludes the discussion.
o
INTRODUCTION correlates the response of a room to this signal with thesource signal, the resulting cross-correlation function is There exists currently much interest in using maximum- the impulse response between the source and receiver length-sequence (MLS) signals to measure the responses positions. When an MLS source signal is used, this of various systems. Several commercial MLS measure- cross-correlation is most efficiently performed using a ment systems are now capable of various room acoustics fast Hadamard transform [1], [3].
measurements. While this method can be quite immune The impulse response can be filtered into various fre-to interfering noise, Obtaining a large dynamic range quency bands and decay curves calculated using in measured sound decays requires one to optimize the Schroeder's reverse integration procedure [8]. From configuration of the measurement system. Some of the these decay curves one can calculate various room necessary considerations have been discussed from more acoustics parameters such as the reverberation time general or more theoretical points of view in previous (RT). (A number of modem room acoustics measures publications [1]-[5]. Chu [6] considered some aspects are defined in the appendix of [9].) These calculations of using MLS techniques for reverberation decay mea- usually require quite a large decay range, and hence surements, and more recently Lundeby et al. [7]exam- there is usually a need to.try to maximize the decay
ined some sources of uncertainties in room acoustics range of the room acoustics measurements.
measurements using MLS techniques. This paper dis- Decay range is the level difference in decibels be-cusses the practical problems of optimizing the deeay--tween the initial maximum of the decay curve and the range in room acoustics measurements using MLS tech- point where the decay approaches the noise floor. In niques. It includes a wide range of measurements to conventional interrupted noise measurements of RT, the demonstrate the influence of various factors and con- decay range is increased by increasing the signal level cludes with a step-by-step approach to optimiZing such and decreasing the ambient noise level. Because the
measurements. MLS signal is deterministic, one can average the
re-An MLS signal is a binary sequence constituting a sponses to several complete sequences of the MLS signal deterministic signal (that is, it is exactly repeatable) that to improve the rejection of uncorrelated noise. This has has a flat white spectrum over a broad frequency range. the effect of increasing the decay range of the sound In digital systems the spectrum of the MLS signal is decays. One can also use longer sequences to improve usually limited by the sampling rate. When one cross- the decay range of room response measurements [2].
tJsing an MLS signal of 1 s or longer provides much
*
Manuscript received 1995 October 23. greater source strength than an impulsive signal andAmbient noise simulation system Mic. AmpJilier duodecahedron loudspeaker MLS Measurement system 267
The MLS test signal has a flat white spectrum over a broad frequency range. However, when the loudspeaker response is included, the output signal response is usu-ally no longer flat. Because the values of the vatious room acoustics parameters can vary with the frequency response of the measurement system, it is important to equalize to correct for the loudspeaker response. One may expect to improve the decay range over a broad frequency range by ensuring that the output from the test loudspeaker has the desired flat response. This flat response could be either a white or a pink spectrum. One advantage of using a pink source spectrum is that it leads to higher signal levels at low frequencies where ambient room noise levels are typically higher.Itis also
ROOM ACOUSTICS MEASUREMENTS
2 SYSTEM EQUALIZATION
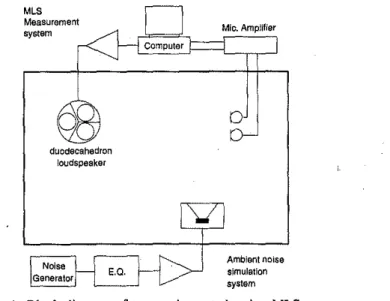
Fig. 1. Block diagram of test equipment showing MLS
mea-surement system and ambient noise simulation system.
four octave bands.
Fig. I shows a block diagram of the test setup. Only one position of the source and the receiver was used. The ambient noise was varied by adjusting the level of the synthesized ambient noise. In a few tests the RT of the room was increased by removing sound-absorbing material.
The RAMSoft-3 measurement system made it possible to vary the sequence length, the number of averages, the output signal level, and the equalization of the MLS test signal. Three seq\lence lengths were used, which are referred to as 16k, '32k, and 64k. (The actual MLS sequence length is I less than a power of 2, and so they were 16k - I, 32k - I, and 64k - I points long. For convenience in this paper they are referred to as 16k-, 32k-, and 64k-point sequences.) Shorter sequences were not used because of the 0.8-s RT of the room. With a sampling rate of 12 500 samplesls these corresponded to sequences of 1.31-, 2.62-, and 5.24-s lengths. In most cases between I and 100 averages were used. In combination with the longest sequence length, 100 aver-ages corresponded to a 524-s measurement time. Four different source signal equalizations were considered and are discussed in the following section.
The results presented in this paper were derived from a series of systematic measurements using the latest ver-sion of our own MLS room acoustics measurement soft-ware (RAMSoft-3), but the results are applicable to other MLS measurement systems. The measurements were made in a 122-m3 room with a midfrequency RT
of approximately 0.8 s. By removing sound-absorbing material from the room the midfrequency RT was in-creased to 2.1 s for a few tests.
RAMSoft-3 is a computer-based measurement sys-tem. The MLS signal is generated in software and output via a 16-bit digital-analog interface. The microphone response is digitized using a 16-bit analog-digital inter-face. The measurement system included an approxi-mately omnidirectional duodecahedron loudspeaker and two microphones-one an omnidirectional'lz-in (12.6-mm) instrumentation condenser microphone and the other a figure-of-eight-pattem studio-type microphone. While most room acoustics quantities can be measured with an omnidirectional microphone, the lateral energy fraction requires an additional figure-of-eight-pattem microphone to measure sound arriving from the side or lateral directions.
Controlled levels of ambient noise were created using an independent electroacoustic system that was equai-ized to produce a pink noise spectrum at the measure-ment microphone position. Because the test signal had an approximately pink spectrum (equal levels in each one-third-octave band) and the synthesized ambient noise also had approximately the same levels in the fre-quency bands ofinterest, similar decay ranges were mea-sured in the four octaves from 500 to 4000 Hz. All results in this paper are averages over the results in these J.AudIo Eng. Soc., Vol. 44, No.4, 1996 April
hence increases the possible signal-to-noise ratio [2]. Averaging the response to several complete sequences can further increase the possible decay range. The cross-correlation process also increases the decay range by rejecting uncorrelated noise. However, a large decay range is not always obtained, and it is essential to opti-mize the measurement parameters to ensure that an ex-tended decay range is achieved. An inadequate MLS signal to ambient noise ratio, too much loudspeaker dis-tortion, too short an MLS length, or an inadequate num-ber of averages can easily combine to limit the resulting decay range significantly. In some cases increasing the output signal level actually leads to a reduced decay range rather than to the expected increase because of increased loudspeaker distortion.
Most of these issues have been discussed in previous publications [I] - [5]. Usually these previous papers have been more theoretical in nature and have not considered the practical aspects of how these various factors com-bine in a real measurement system. The object of this paper is to provide practical information for users of MLS measurement systems so that they can more easily optimize the decay range of their measurements in
rooms.
eRADLEY
conventional to use pink source signals when analyzing with!octave and one-third-octave filters (that is, constant-percentage bandwidth filters). In practice the equaliza-tion process can also result in a reduced decay range of the measured sound decays. Thus the actual test signal equalization must be a compromise that leads to a rea-sonably flat response without significantly reducing the decay range of the measured sound decays.
Fig. 2 is an extreme example of the effects of different source spectra on the values of measured early-to-Iate sound ratio(CgO)values for four different source signal equalizations-no equalization, hardware equalizer, white equalization of the MLS sequence, anI! pink equal-ization of the MLS sequence. Hardware equalequal-ization refers to a simple equalizer supplied by the loudspeaker manufacturer. The white and pink equalizations were obtained by software modifications of the MLSsource signal. The different source spectra led to differences of up to1dB or more in the measuredCgOvalues shown in Fig. 2, and these differences tend to be largest at low frequencies where the loudspeaker response is rolling off. Unfortunately software equalization of the loud-speaker response to an approximately white or pink spec-trum also resulted in reduction of several decibels in the measured octave band decay ranges.
The equalization process can either increase low points in the output spectrum or decrease the high points. Increasing the output level at frequencies where the loud-speaker response is low leads to significant increases in the distortion components in the loudspeaker output. These are converted to an elevated noise floor in the measured response [5] and hence toa decreased decay range. Ifthe eqiJalization is performed to reduce the level of the loudspeaker output at peaks in the frequency response, the average output of the loudspeaker is re-duced. This reduces the MLS signal to ambient noise
level ratio, and hence it also reduces the decay range. There is thus a general trend for the decay range to be inversely related to the flatness of the equalized re-sponse.
All subsequent results in this paper were obtained using the hardware equalizer that produced an approxi-mately pink output response spectrum. This had the ad-vantage of only very slightly reducing the decay range compared to the unequalized case.
3 SIGNAL AND AMBIENT NOISE LEVELS
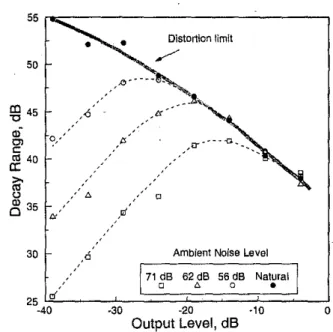
The first measurements in the test room included mea-suring the effects of various combinations of output sig-nallevel and ambient noise. Output levels are relative to the maximum system output. Fig. 3 shows some typical results as a function of the relative output level of the measurement system. All results in this figure were ob-tained using 10averages of the responses to a 64k-point sequence (5.24 s long). Decay ranges were measured as the average of the octave band decay ranges from 500 to 4000 Hz because similar values were obtained in each of these four octaves. Three different synthesized ambi-ent noise levels were included as well as the lower level natural ambient room noise.
The wide grey line drawn through the filled data points shows the mean trend for the decay range versus output signal level for the natural ambient noise condition; For these data even the lowest output signal was approxi-mately 17 dB above the ambient noise level in these four octave bands. This lowest output level case resulted in a decay range of approximately 55 dB. As the output signal level was increased, the decay range did not iD-crease but systematically deiD-creased. As the output signal level is increased, the loudspeaker distortion is increased and the decay range becomes reduced. Thus in quiet
'0
r - - - ,
55 r - . : : - - - ' - - - - ,a
o
Ambient Noise Level 71 dB 62 dB 56 dB Natural o c" 0 • 30 50
co
45 '0 oig>
セ 40 セ"
セ 35 25LEo':...-_---'_-=========-_J
-40 ·30 -20 ·10 Output Level, dBFig. 3. Measured decay range versus system output level (rela-tive to maximum system output) for various background noise
levels. All results were obtained using 64k-point sequences and were averages of 10 sequences over octave bands from
500to4000Hz. 2 a 6
co
'0o
413
8No EO Hardware EO Pink. EQ White eQ --0·· -e-- ····8··· -
...-.2
LL--=:C::=::::::J:=:=i::=:::c:=-..J
125 250 500 1000 2000 4000
Frequency, Hz
Fig. 2. Measured early-to-Iate sound ratios (egO) for four
different source spectra: - - - no equalization; - -
hard-ware equalization; . . . . pink equalization; - - - white equalization.
..
__
....._--_
..
セ ...,.,..."...
, ,...,...
'''"'' 269 lD 45"
.,; Cl C セ 40I-セ
セ 35 15NGZM⦅セ⦅]M⦅セ_
_::_----:'----,-...J 40 ·30 ·20 ·10 0 OutputLevel, dBFig. 5. Measured decay range versus system output level
(rela-tive to maximum system output) for 16k-, 32k-, and
64k-point sequence lengths. All measurements were averages of
responses to 10sequences over octaves from 500to4000Hz
and with 71-dB synthesized ambient noise. Sequence length
5 0 , - - - ,
Increasing the sequence length is also expected to lead to an increased decay range in the measured responses. Fig. 5 compares the measured decay ranges versus sys-tem output level for 16k-, 32k-, and 64k-point sequences
S5 ....: - - - ,
セB
.
Distortion limit ",.
....:
,
---セ 50 I- ....",.,
.. ' ...セB・
",6/ 100aセYNB
..••." ,.•..0 " " " ,-' 10Avg ..--1j-" ",' BNLLセ .. _,rr •/ /..
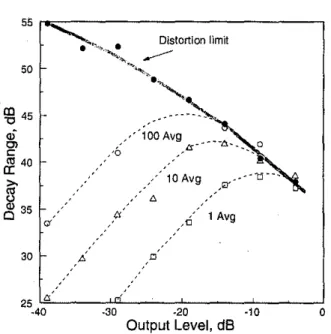
セ, 1 Avg 30 LOセLG ,,0' 25 NLLBGMNMMMZcZBGMMMGMM]MMMM⦅ZZ⦅MセM⦅Z ·40 ·30 ·20 ·10 0 OutputLevel,dBFig. 4. Measured decay range versus system output level (rela-tive to maximum system output) for various numbers of
aver-ages. All results were responses to 64k-point sequences over
octaves from 500 to 4000 Hz and with 71-<1B synthesized
ambient noise.
5 SEQUENCE LENGTH increase the measurement time.
Averaging the responses to a number of sequences of the MLS signal can be very beneficial to improving the resulting decay range, but it is again important to be sure that the system is not operating in a region that is already limited by loudspeaker distortion.
conditions it can be important to reduce rather than in-crease the test signal level to maximize the resulting decay range.
The other three sets of data correspond to three levels of the synthesized ambient noise. The spectra of these noises were approximately pink in the mid and higher frequencies. These three curves show that for each ambi-ent noise level there is an optimum output signal level for creating the maximum decay range in the measured responses. Kaneda [10] has very recently published somewhat similar results, but in terms of measurement error. To the left of'these maxima the decay range is limited by the signal-to-noise ratio. In this region incre-asing the signal level increases the resulting decay range. To the right of the maxima the decay range is limited hy loudspeaker distortion. Increasing the output signal level in this region reduces the resulting decay range. The maximum decay range increases as the ambient noise level decreases and the maxima occur at lower output signal levels. Thus for the intermediate ambient noise case of 62 dB an output level of - 20 dB leads to a near maximum decay range of just over 46 dB. How-ever, for the lower ambient noise case an increased decay range could be obtained by reducing the output level to
approximately - 27 dB. .
Itis very important to appreciate that MLS measure-ments are more complex than simple interrupted noise decays and that increasing the output signal level can quite often reduce rather than increase the resulting de-cay range. The wide gray line in Fig. 3 can be thought of as the distortion limit of the measurement system. That is, one cannot obtain conditions above this line hecause the system becomes limited by the noise floor caused by the loudspeaker distortion products.
4 MULTIPLE·SEQUENCE AVERAGING
J.Audio Eng. Soc., Vol. 44, No.4, 1996 April
One advantage of the MLS-type measurement is that the signal is deterministic and hence exactly repeatable. Thus by synchronously averaging the responses to sev-eral complete sequences, one can expect to improve the rejection of noise that is not correlated with the source signal [6]. Fig. 4 illustrates the effects of I, 10, and 100 averages as a function of the output signal level. The ambient noise corresponded to the high-noise-Ievel case of Fig. 3 (71 dB, 500-4000 Hz). The natural ambi-ent noise case from Fig. 3 is repeated to indicate the distortion limits of the measurement system.
Again the three curves of decay range versus output signal level have maxima indicating that there is an opti-mum output level for each number of averages. To the left of these maxima the decay range is again limited by the signal-to-noise ratio, and increasing the number of averages increases the resulting decay range' signifi-cantly. Each tenfold increase in the number of averages increased the resulting decay range by about 10 dB in this range. However, to the right of the maxima the maximum possible decay range is again limited by the loudspeaker distortion. In this region increasing the number of averages may have little effect other than to
BRADLEY
and the 71-dB synthesized ambient noise level. The re-sults show that tbe effect of sequence length is not al-ways the same as the effect of averaging. In general, doubling the sequence length leads to about a 3-dB in-crease in the decay range. Again there is an optimum output level of about -15 dB for the data in Fig. 5. However, the benefits of increasing the sequence length are not limited by the loudspeaker distortion.
The effects of averaging and sequence length are fur-ther compared in Figs. 6 and 7. Fig. 6 plots decay range versus total measurement time and includes results for 16-k, 32k-, and 64k-point sequences as well as different numbers of averages. In this figure the relative output
50
r---,
signal level was quite low (- 29 dB), and all results follow the same approximately linear relationship. At this low output signal level the system is not limited by loudspeaker distortion, and so increasing either the sequence length or the number of averages has the same effect of increasing the decay range.
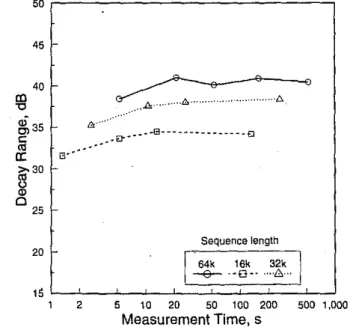
Fig. 7 shows similar results, but for a higher output signal level ( - 9 dB). In this figure increased sequence length leads to increased decay range, but increased numbers of averages have little effect. For this case the system is limited by loudspeaker distortion, and thus only increasing the sequence length increases the re-sulting decay range.
These results show that it is important to use the lon-gest sequence length possible to maximize the decay range in room response measurements.
45
6 OTHER FACTORS
50
r---..,
I
I
Choosing the right combination of output signal level, number of averages, and sequence length can maximize the decay range of measurements using a particular MLS measurement system. However, at least two other fac-tors can influence the resulting decays significantly.
The MLS measurement procedure assumes that the system being measured is time invariant. Some rooms, such as reverberation chambers with rotating vanes or auditoriums with electroacoustic enhancement systems, with time-variant components to minimize feedback; have obvious sources ofvariatioll9- over time. However, Chu[11]and Vorlander and Bietz 112] have both found quite significant effects of subtle temperature changes in rooms. These effects were confirmed in the present work by adding a l-kW electric heater in the test room for approximately I h. Room responses were measured before, after, and during the period that the heater was on. While the mean temperature of the room was not significantly changed, there would have「セ・ョ local tem-perature changes.
Fig. 8 shows measured reverberation times before, after, and during the time that the heater was operating. The before and after results agree very closely, indi-cating that the room and the measurement system were stable over longenime periods. The third curve shows the result for the largest change in measured RT values with the heater on. Other results were intermediate to the extremes in this figure. Changes in RT values over 0.5 s are seen in this figure for the maximum-change
case.
Fig. 9 similarly illustrates the effects on early-to-Iate sound energy ratios (C80). The effect of the time vari-ance produced by the heater again tended to be greatest at higher frequencies, and C80 values changed by over 2 dB. These effects increased with the total duration of the measurement, that is, errors increased with the use of increasing numbers of averages.
The possible negative effects of smalltime variations in the room to be measured present serious problems. Normally one would increase the sequence length and the number of averages to improve the decay range of
Sequence length Sequence length ... .8 8,"
.;;;>;
20 ...cr
20 45 4018
セSUfa
a:
i
30o
25Ii:- ..
18
k ••..セセセ
.. ,$ lNNjNNMMMNャN⦅GMMセ]Z[Z]]]]]]ZZZZBBGMNNNj 1 2 5 10 20 50 100 200 500 1,000 Measurement Time,SFig. 7. Measured decay range versus total measurement
dura-tion for 16k-, 32k-, and 64k-point sequence lengths. System output level -9 dB. All measurements were averages over octaves from 500 to 4000 Hz with 71-dB synthesized.
I
セ
.;:....
セセ
..
15
L..L---'_.L.-...c..:=::I=::::L::::C=:.L.-.J
1 2 5 10 20 50 100 200 500 1,000Measurement Time, s
Fig. 6. Measured decay range versus total measurement
dura-tion for 16k-, 32k-, and 64k-point sequence lengths. System output level - 29 dB. All measurements were averages over octaves from 500 to 4000 Hz with 71-dB synthesized ambi-ent noise.
o
Best fit regression line
BGINセ
DR :·10'log(RT)-K;8 ••••••••• 60 52 IJl 58 "C ai Cl c: '" 56a::
セ
l3
54 50 GMMセMャセセセNNNNNjNN Ml⦅MMャN⦅セNNj 0.3 0.5 1 2 3 5 RT,SFig. 10. Measured decay range DR versus RT measured on digital reverberator. All measurements were made using aVTォセ
point sequence.
62
r--"""---,
MLS room acoustics measurements can lead to high-quality results with large decay ranges. However, if con-siderable care is not used to optimize the measurement procedure, mediocre results may be obtained.
In general it is desirable to reduce the output signal level to minimize the effects of loudspeaker distortion, which tend to reduce the resulting decay range. Incre-asing the number of sequence responses that are aver-aged together can increase the decay range, but only when the system is not limited by loudspeaker distortion. However, increasing the sequence length will always 7 CONCLUSIONS
creased by 5.5 dB. Changing the sound-absorbing mate-rial in the room should have changed both signal and ambient noise levels by about the same amount so that the signal-to-noise ratio would have been approximately the same.
To explore this effect further, decay ranges and RT values were measured for a range of settings of a digital reverberator. The measurements were all made with the same 64k-point sequence length and the same output signal level. The results presented in Fig. 10 again show that the decay range decreases with increasing RT, and the decay range varies as approximately - 10 times the logarithm of the RT. This may simply be because the tail of uncorrelated noise at the end of the impulse re-sponse will increase in length as the RT is decreased for a particular sequence length. The correlation process will thus result in lower noise floors (and larger decay ranges) for shorter RT values with constant sequence length.
One can conclude that it is not always satisfactory to aim for a sequence length equal to the room RT; the longer the sequence relative to the room RT, the larger the possible decay range.
271 J'l , ,, , ,
If!
",..
,..
•••••• -0" ••"
..
..
,.
·
..
·
.
·
.
·
..
·
.
,/
\\
'"
2 ·2 125 250 500 1000 2000 , 4000 Frequency, HzFig;8. MeasuredRTversus frequency before and after opera-tion of a l-kW heater as well as maximum change.
Before Max change-e-- After ,,0-, ,,,,8·,, ッャNNNエNM⦅セ]セZZ]ZZi]セ⦅MMNj 2 U)
ti
4,---,---,
Before Max change After
-e- ··0·- ····6···
-4 ll⦅」ZZZZZZZjZ]]ZZZZZl]]セ⦅Nj
125 250 500 1000 2000 4000
Frequency, Hz
Fig. 9. Measured C80 versus frequency before and after opera-tion of a l-kW heater aswen as maximum change.
3
measurements. As the decay range increases there is usually less influence of the background noise levels and RT values tend to decrease to "correct" values. How-ever, when there is some time variance in the room, RT values will further reduce below "correct" values as the duration of the measurement (number of averages) is increased.It is therefore very important to limit the dura-tion of MLS measurements and to be aware of the possi-ble propossi-blems of such time variance.
The resulting decay range in measurements is also influenced by the RT of the room. During most of these test the RT of the room was 0.78 s (500-4000 Hz). When sound-absorbing material was removed from the room the RT increased to 2.10 s (500-4000 Hz). At the same time as the RT increased, the decay range
de-'EJ.. ".
BRADLEY
increase the resulting decay range. Thus it is usually better to increase the sequence length than to increase the number of averages. Even when the system is optimally configured, the actual decay range will depend on the ratio of the room RT to the sequence length, and subtle time variance in the room can lead to large errors in the resulting decay times.
The following steps are recommended to ensure an optimum decay range in MLS room acoustics measure-ments:
1) Deterroine the distortion limits of the measurement system in low ambient noise conditions (similar to the wide gray curve in Figs. 2 and 3).
2) When testing a room, first assess the ambieot noise level.
3) Use an output level that is low enough to provide the desired、・」セケ range.
4) Use the maximum possible sequence length to in-crease the decay range.
5) If the system is not limited by loudspeaker distor-tion at the selected output level, increase the number of averages to increase the decay range.
6) Limit the total measurement duration where time variance problems may exist in the room.
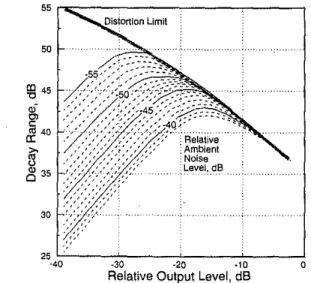
Fig. 11 helps to illustrate several of these steps. It represents the Fig. 3 results for a 64k sequence length and 10 averages with interroediate ambient noise levels approximately interpolated. The ambient noise level is relative to the maximum output signal level. For exam-ple, if the O-dB relative output level corresponded to a sound level of 100 dB at the receiver, then the -40-dB relative ambient noise level contour would correspond to an ambient noise level of 60 dB. Thus if one measures the ambient noise level and the signal level, and knows the output level setting, one can estimate the expected decay range. With this inforroation and Fig. 11 one could then increase or decrease the output signal level to opti-mize the decay range. Further increases in decay range could be obtained by increasing first the sequence length and in some cases the number of averages. Fig. 11 can
55 イMN[[ZMMセMMMセMMセMMMNNL
50
25.4.':'0--...,.3"'0---.2"'0---.":10---.10
Relative Oulput Level, dB
Fig. 11. System optimization chart in terms of decay range versus relative output level for various ambient noise levels.
Output level and ambient noise level are both relative to level of output signal corresponding to maximum system output.
272
be used to qualitatively describe the perforroance of other MLS measurement systems, or similar plots could be produced by similar series of measurements of decay ranges from other MLS systems.
These results demonstrate the importance of using longer sequence lengths. Increasing the sequence length is a more effective method of increasing the decay range than is increasing the number of averages because it is not limited in the same way by loudspeaker distortion. Also the longer the sequence relative to the room RT, the longer the possible decay range. Current MLS measurement systems are typically limited to about 64k-point sequence lengths. Modern computers could accommodate longer sequence lengths, and new mea-surement systems should include at least 256k-point
sequences.
Subtle time variance problems are a potentially seri-ous limit to longer time averages of MLS measurements in rooms. For example, it seems to be quite impractical to use very long averages with very low-level signals to measure occupied conditions in auditoriums. We need more inforroation to help us identify under what condi-tions these time-variant effects become important. One indication of the presence of time variance errors was observed in the shape of the high-frequency sound de-cays. In most rooms decays at high frequency (such as 4000 Hz) are either linear or a little concave upward, that is, the initial decay may be more rapid than the later decay. When there were time variance errors, the high. frequency decays tended to be concave downward so that the initial decay was less rapid than the later decay. As this is not likely to occur naturally in a room, it is a good indication of time variance errors in the
mea-surements.
8 REFERENCES
[1] J. Borish and J. B. Angell, "An 'Efficient Algo-rithm for Measuring the Impulse Response Using Pseu-dorandom Noise," J. Audio Eng. Soc., vol. 31, pp.
416-488 (1983 July/Aug.).
[2] D. D. Rife and J. Vanderkooy, Btイ。ョウヲ・イセfオョ」ᆳ
tion Measurement with Maximum-Length Sequences,"
J. Audio Eng. Soc.,vol. 37, pp. 419-444 (1989 June).
[3] H. Alrutz and M. R. Schroeder, "A Fast Hada-mard Transform Method for the Evaluation of Measure-ments Using Pseudorandom Test Signals," inProc. 11th
Int. Congr. on Acoustics (Paris, France, 1983), pp.
235-238.
[4] C. Dunn and M. O. Hawksford, "Distortion Im-munity of MLS-Derived Impulse Response Measure-ments," J. Audio Eng. Soc., vol. 41, pp. 314-335
(1993 May).
[5] J. Vanderkooy, "Aspects ofMLS Measuring Sys-tems," J. Audio Eng. Soc., vol. 42, pp. 219-231 (1994 Apr.).
[6] W. T. Chu, "Impulse-Response and Reverber-ation-Decay Measurements Made by Using Pseudoran-dom Sequences," Appl. Aeoust., vol. 19, pp. 193-205 (1990).
THE AUTHOR
273 After teaching acoustics and noise control for several
years in the Faculty of Engineering at the University
of Western Ontario, he joined the National Research Council. His work has concentrated on both room。」ッオウセ tics and subjective studies. He has completed studies on the annoyance of various types of noises as well as measurement studies in various rooms. Most recently
he has been concerned with the accuracy of various
room acoustics measurements as well as the subjective importance. of these quantities.
ROOM ACOUSTICS MEASUREMENTS
Acoustic Impulse Response Measurement,"J. Acoust. Soc. Jpn (E), vol. 16, no. 3, pp. 193-195 (1995).
[II] W. T. Chu, "Time Variance Effect on the Appli-cation of theM-Sequence Correlation Method for Room Acoustical Measurements," inProc. 15th Int. Congr. on Acoustics(Trondheim, Norway, 1995 June), vol. IV, pp.25-28.
[12] M. Vorliinder and H. Bietz, "Der Einfluss von Zeitvarianzen bei Maximalfolgenmessungen," presented at DAGA '95 (1995 Mar.).
John Bradley is a senior research officer in the Acous-tics Laboratory of the Institute for Research in
Construc-tion at the NaConstruc-tional Research Council of Canada. His
undergraduate degree was in physics and was obtained from the University of Western Ontario. His masters degree, received from the same university, involvedre-search on violin acoustics. He obtained his Ph.D. at
Imperial CoIlege of the University of London on a
proj-ect concerning electroacoustic enhancement systems
inrooms.
J. Audio Eng. Soc., Vol. 44, No.4, 1996 April
(7) A. Lundeby, T. E. Vigran, H. Bietz, and M. Vorliinder, "Uncertainties of Measurements in Room Acoustics,"Acustica,vol. 81, pp. 344-355 (1995).
(8) M. R. Schroeder, "Integrated-Impulse Method for Measuring Sound Decay without Using Impulses,"J.
Acoust. Soc. Am., vol. 66 (1979 Aug.).
[9] J. S. Bradley and G. A. Soulodre, "Objective Measures of Listener Envelopment," J. Acoust. Soc. Am., vol. 98, no. 5, pp. 2590-2597 (1995).