Publisher’s version / Version de l'éditeur:
ASTM Special Technical Publication, 1067, pp. 222-230, 1990
READ THESE TERMS AND CONDITIONS CAREFULLY BEFORE USING THIS WEBSITE. https://nrc-publications.canada.ca/eng/copyright
Vous avez des questions? Nous pouvons vous aider. Pour communiquer directement avec un auteur, consultez la première page de la revue dans laquelle son article a été publié afin de trouver ses coordonnées. Si vous n’arrivez pas à les repérer, communiquez avec nous à PublicationsArchive-ArchivesPublications@nrc-cnrc.gc.ca.
Questions? Contact the NRC Publications Archive team at
PublicationsArchive-ArchivesPublications@nrc-cnrc.gc.ca. If you wish to email the authors directly, please see the first page of the publication for their contact information.
NRC Publications Archive
Archives des publications du CNRC
This publication could be one of several versions: author’s original, accepted manuscript or the publisher’s version. / La version de cette publication peut être l’une des suivantes : la version prépublication de l’auteur, la version acceptée du manuscrit ou la version de l’éditeur.
Access and use of this website and the material on it are subject to the Terms and Conditions set forth at
Methods for measuring air leakage in high-rise apartments
Shaw, C. Y.; Gasparetto, S.; Reardon, J. T.
https://publications-cnrc.canada.ca/fra/droits
L’accès à ce site Web et l’utilisation de son contenu sont assujettis aux conditions présentées dans le site LISEZ CES CONDITIONS ATTENTIVEMENT AVANT D’UTILISER CE SITE WEB.
NRC Publications Record / Notice d'Archives des publications de CNRC:
https://nrc-publications.canada.ca/eng/view/object/?id=b61080ff-38ac-472f-bad9-c80cad3af6c5 https://publications-cnrc.canada.ca/fra/voir/objet/?id=b61080ff-38ac-472f-bad9-c80cad3af6c5Ser
TH1
National ResearchConsell
natlonalN21
d
'1
Council Canadade
recherches Canada0 ,
1649
Institute for lnstitut dec.
2
Research in recherche enBLDG.
Construction construction- - - -
Method for Measuring Air
Leakage in High-Rise
Apartments
by C.Y. Shaw, S. dasparetto and J.T. Reardon
Reprinted from
Air Change Rate and Airtightness in Buildings ASTM, STP 1067,1990
p. 222-230
(IRC Paper No. 1649)
NRCC 31681
L I B R A R Y
JAN 26
1991
B I B L I O T H ~ Q U E
I R C
CNRC-
IC19TIII~IIIIIII~~~I~~PI~EII~IIII
- - -18 9 02 0
8
-Resume
On a modifie la methode de mise en depression Quilibrk par ventilrteur pour l'appliquer P des immeubles d'habitation de grande hauteur, le but vi& &ant de mesurer simultanbent leur transparence P l'air globale et celle du mur exterieur d'un appartement en particulier. Cette methode nkessite l'emploi de d e w types d'appareils de znise en pression par ventilateur. Le
I premier, installe P la porte d'un appartement, mesure le debit d'air qui traverse le mur exbkieur, tan& que le second, i n s U A une porte extCrieure de l'imrneuble, mesure le debit d'air global qui passe P t r a m l'envebppe. On
Qquilibre lea pressions enhe le logement de contrble et les appartements adjacents afin de d u i r e le plus p i b l e les fuitg &air par les murs mitoyens en ajustant I'koulement &air du plus grcs appareil et l'ouverture de la porte des apputemento adjacents. Cette mbthode, utilisee pour &valuer l'etancheite
L l'air de
''-
--
' -- "L-'ih'- Iv-l & anr& leuram4iorati "\ode de degra de certains Leo auk 11 l'air et les dsesultat!
~
Authorized Reprint from Standard Technical Publication 1 067 - 1 990
Copyright American Society for Testing and Materials 191 6 Race Street Philadelphia. PA 191 03
Chia-yu Shaw,
lSimona Gasparetto,' and James
T.
Reardon1
Methods for Measuring Air Leakage in
High-Rise Apartments
REFERENCE: Shaw, C. Y . , Gasparetto, S., and Reardon, J . T., "Methods for Measuring Air Leakage in High-Rise Apartments," Air Change Rate and Airtightness in Buildings, ASTM STP 1067, M. H . Sherman, Ed., American Society for Testing and Materials, Philadelphia, 1990, pp. 222-230.
ABSTRACT: The balanced fan depressurization method has been modified for application ro high-rise apartment buildings in order to measure the overall air leakage and the wall air leakape of an apartment unit simultaneously. The method requires the use of two sets of fan pressurization apparatus. One is installed at the door of an apartment unit for measuring the air leakage rate of the exterior wall, and a much larger apparatus is installed at an exterior door of the building for measuring the overall air leakage rate. The pressures between the test unit and the adjacenr units are balanced to minimize the air leakage through the party walls by adjusting the airflow of the larger apparatus and the door opening of the adjacent apartments. The method was successfully applied to two high-rise apartment towers before and after they were retrofitted to improve airtightness of the envelope. In addition, the tracer gas decay method was applied to the same buildings to obtain the infiltration rates of selected apartment units.
The methods used to measure the airtightness values and the air infiltration rates and the test results of the two apartment towers are discussed.
KEY WORDS: leakage, pressure, residential, measurement, fan, tracer gas
Two high-rise senior citizen apartment buildings, Buildings D and V, were experiencing
significant deterioration of their exterior masonry. As air leakage was suspected as the major cause for the deterioration, the buildings were retrofitted to improve airtightness. To assess the effectiveness of the retrofit measures, the air leakage rates through the building envelope and through the exterior wall of one individual apartment unit in each building were mea- sured both before and after the retrofit. The balanced fan depressurization technique [ I ] was modified to be able to measure the air leakage rates through the exterior wall of the individual apartment unit and through the envelope of the whole building simultaneously.
A method was developed for use by building consultants and air sealing contractors to
estimate the air infiltration rate of an individual apartment unit based on its measured airtightness value and the pressure difference across its exterior wall. Tracer gas decay tests were conducted on two individual apartment units to determine the feasibility of the proposed method. This paper presents the test methods and results.
Test Building
Both buildings were constructed with reinforced concrete frames and double wythe brick masonry cladding. The exterior walls are 20.3-cm (8-in.)-thick masonry panels and are
'Research officer, Institute for Research in Construction, National Research Council, Canada. 21ndustrial development officer, Ministry of Energy, Province of Ontario, Canada.
SHAW ET AL. ON HIGH-RISE APARTMENTS
223
insulated on the inside. The 14-story Building D was constructed in 1977. The 17-story Building V, constructed in 1982, incorporates a cavity between the inner and outer wythes, in addition to the interior insulation. The two buildings are connected at the ground floor via a common foyer.Each floor has seven apartment units on each side of a common corridor. Outdoor air is supplied to each corridor through a central supply-only ventilation system. Exhaust air leaves the building through the exhaust fans in the bath room and the kitchen of each apartment. Each building has two elevators and two stairwells. One stairwell in each building has an outside door at ground level.
Test Methods
Airtightness Measurements
In each building, airtightness values of the building envelope and the exterior wall of one apartment unit were measured both before and after the retrofit. During the test of each building, the connecting ground-level door to the other building was sealed. The test methods are described below.
Overall Airtightness
As shown in Figs. 1 and 2, a large vane-axial fan was used to depressurize the test building. The fan airflow could be adjusted from 0 to 23 m3/s (0 to 50 000 ft3/min). The fan inlet was
1
224 AIR CHANGE RATEI 1
AN APARTMENT UNITI I
AIRTIGHTNESS VALUEI I / I,OF THE EXTERIOR WALL
,.
,..E APARTMENT UNITPRESSUr
&
&*/J*l
,
AIRTIGHTNESS VALUE OF THE WHOLE BUllDlffi+
+ 4FIG. 2-Building test setup showing the fan pressurization apparatus for measuring the airtightness values of the whole building and an apartment.
connected by 12 m (40 ft) of 0.9-m (3-ft)-diameter ducting to a plywood panel temporarily replacing the entrance door to a stairwell. All interior doors to the stairshaft were kept open to provide a free flow path for the air drawn by the fan from the floor spaces, through the stairshaft, to the outdoors.
The airflow rate was measured upstream of the fan intake using a pair of total pressure averaging tubes. Flow rate measurements are accurate to within 5% of the measured values. The pressure differences across the building envelope at both the ground and roof levels were measured using an electronic manometer with a strip chart recorder (accurate to within 5% of the measured values). The average of the two measured values was used to represent the mean pressure difference across the building envelope. Prior to and immediately after each test, the fan was sealed with a plastic sheet and the pressure differences across the envelope at the ground and top levels were measured. The two readings obtained at each location (one before and one after the test) were averaged to give the base readings of the pressure difference for the two locations. These base readings were then subtracted from subsequent pressure difference measurements to minimize weather effects (wind and stack action).
The two buildings were tested without their ventilation systems operating. The window air conditioners in Building D were removed for the tests. Those in Building V were left in place with their outdoor air dampers closed during the tests. In addition, all the windows in each building were closed tightly for each test.
SHAW ET AL. ON HIGH-RISE APARTMENTS
225
Exterior Wall AirtightnessFigure 2 is a schematic diagram of the test setup to measure the airtightness of the exterior wall of an individual apartment and the airtightness of the whole building's envelope si- multaneously. A small fan depressurization apparatus was connected to a plywood panel, replacing the apartment's entrance door, to draw outdoor air through the apartment's ex- terior wall and exhaust it into the corridor. The entrance doors of the two immediately adjacent apartments were cracked open just enough to make the individual pressure dif- ferences between them and the tested unit approximately zero. This adjustment was made to minimize the air leakage through the common walls [I] and is fundamental to this tech- nique. The pressure differences between the test unit and the units directly above and below were also measured during the tests to ensure that they were approximately zero. Under this "balanced" condition, the airflow rate measured through the small fan depressurization apparatus is equal to the air leakage rate through the exterior wall of the test unit driven by the pressure difference across the exterior wall [I].
The airflow rates through the small fan were measured using a Meriam LFE laminar flow element accurate to within 5% of the measured values. The pressure differences across the exterior wall of the test unit and across the common walls it shares with the adjacent units were measured using an electronic micromanometer and a strip chart recorder. The accuracy of all pressure measurements is within 5% of the measured values.
Air Change Rate Measurement Method for Individual Apartment Units
The air infiltration rate in an individual apartment unit can be estimated with the following equation. It uses the measured airtightness value of the exterior wall and the pressure difference measured across it.
where
q = air infiltration rate, Lls,
C = flow coefficient, L/(s.Pan),
A P = pressure difference across the exterior wall, Pa, and
n = flow exponent.
In Eq 1, the values of C and n for the test units were obtained from the fan pressurization tests described earlier. The pressure difference in this equation is that measured across the exterior wall of the apartment unit during normal operating conditions, that is, during conditions under which the air infiltration rate is to be estimated.
The method was used to estimate the air infiltration rates in two apartments, one in each building. The pressure differences were measured with the same apparatus used for the fan pressurization tests. The outdoor pressure tap was installed on the exterior surface of the living room window, and the indoor pressure tap was located near the center of the test unit.
For comparison with the estimates, the air change rates in the test apartment units were measured using the tracer gas decay method at the same time as the pressure differences were being measured. The tracer gas concentrations in the surrounding units and the pressure differences across the common walls were also measured during these tests. These data were used to estimate the flow rates and directions of any air exchange between the test unit and its surrounding units.
226 AIR CHANGE RATE
The tracer gas test procedure was as follows: A small amount of SF, gas was injected into the center of the living room. A small desk fan was used to help mix the tracer gas with the indoor air. After allowing 30 min for mixing, 50-mL samples of the indoor air were collected manually, using a syringe, every 10 min at the center of the room for at least 1 h. A total of seven to ten samples were collected for each test.
Each sample was taken as follows: Just prior to the sample time, the 60-mL syringe was purged twice and then, at the sample time, was used to draw in a 50-mL sample of air. The gas sample was then injected into a 20-mL evacuated glass test tube with a rubber septum- type stopper, of the same type used to collect blood samples in medical laboratories. In this way, the sample was stored under pressure. This pressure was relied cpon to later drive the sample into an electron-capture gas chromatograph for analysis.
The electron-capture gas chromatograph was calibrated against gases with known con- centrations. Four SF,-air gas mixtures ranging from 1 to 200 ppb were prepared in our laboratory for this purpose (the accuracy of the prepared gas mixtures could not be checked because no certified gas at such low concentrations is available). To check the consistency of the preparation procedure, several gas mixtures of the same concentration were prepared using containers of different sizes so that different proportions of SF, and air were used. The agreement among these gases was within 5% of each other.
Results and Discussion
Airtightness Values
The overall airtightness values for both buildings, before and after the retrofit, are shown in Fig. 3. The plotted results have been normalized by exterior wall area. The results indicate that the overall airtightness of each building was improved by the retrofit. They also show that Building V is leakier than Building D.
As the pressure difference across the envelope decreased with the building height due to the large flow resistance in the stairwell, the overall air leakage rate was presented in terms of the mean pressure difference across the envelope. The mean pressure difference was defined to be the average value of the pressure differences at the ground and top levels. To give some indication of the variation of the pressure differences along the building height, the pressure differences at the ground and top levels are given for a fan flow rate (airtightness value) which produced a mean pressure difference of about 50 Pa. For Building D (14 stories), the airtightness value corresponding to a mean pressure difference of 53 Pa was 2.25 Lls.m2 (Fig. 3), and the pressure differences at the ground and top levels were 74 and 32 Pa, respectively. For Building V (17 stories), the airtightness value, the mean pressure difference, and the pressure differences at the ground and top levels were 3.39 Lls.mz, 50 Pa, 75Pa, and 25 Pa, respectively.
The airtightness values of the exterior walls of the two individual apartment units are shown in Fig. 4. The results indicate that, in both buildings, the improvement in the air- tightness of the exterior wall of the tested apartment is much greater than that realized for the whole building. This suggests that the air leakage through the exterior walls for both buildings is not as important as that through their roofs and basements. Visual inspections suggest that some of the major leakage sites in the roof are the elevator shafts (and the smoke dampers in Building V).
A comparison between Figs. 3 and 4 indicates that the normalized overall airtightness value was greater than the normalized exterior-wall airtightness value. This is because the area of the exterior wall used to normalize the overall airtightness value includes the two side walls. The side walls (Fig. 1) are expected to be much more airtight than the front and back walls because the window area to wall area ratio for the side walls is much smaller than that for the other walls. Also, the windows in the side walls are not openable.
SHAW ET AL. ON HIGH-RISE APARTMENTS 227
MEAN PRESSURE DIFFERENCE ACROSS EXTERIOR WALL. Pa
FIG. %Overall airtightness value per unit area of exterior wall.
Air
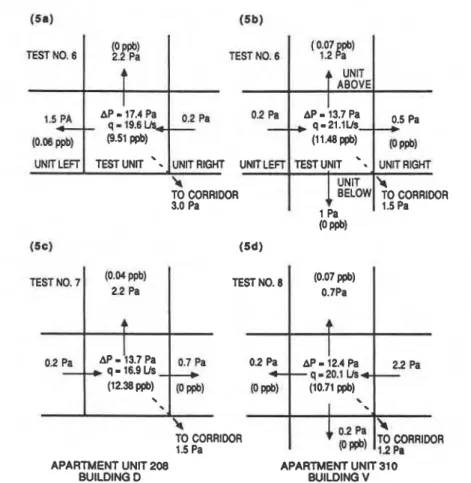
Change RatesFigure 5 shows the results of two typical tracer gas tests for each apartment unit, including the concentrations and pressure differences measured in the surrounding units. All four tests shown were made after the retrofits. Arrows are used to indicate the directions of the pressure differences between the test apartment units and their surroundings. The air infiltration rates were calculated from Eq 1. The flow coefficients and exponents used for the calculation were 3.43 L/s.Pao6' and 0.61 for Apartment Unit 208, and 5.68 Lls.Pao5 and 0.5 for Apartment Unit 310. The results indicate that there were some interapartment airflows during these tests. A mass flow balance for the unit left apartment in Fig. 5 a , assuming an air infiltration rate of 19.6 Lls equal to that calculated in Unit 208, was made to estimate the airflow rate from Unit 208. The result of this mass flow balance indicated that the airflow rate from Unit
208 was about 0.1 Lls. Similar observations in the other adjacent units, for all the tests,
suggest that these interapartment airflow rates were too small to be measured accurately. The air infiltration rates of Apartment Units 208 (Building D) and 310 (Building V) were calculated based on the pressure differences across the exterior walls measured under various weather conditions. At the same times that the pressure differences were measured, the air
AIR CHANGE RATE
7.00
..
-
N I C #;
6 . 0 - / I 0-
I-
-
-
-
---
BEFORE RETROFIT-
AFTER RETROFIT-
0 20 4 0 60 80 100 PRESSURE DIFFERENCE ACROSS EXTERIOR WALL, PaFIG. 4--Airtightness value of exterior wall per unit area of exterior wall.
change rates of the two apartment units were also measured using the tracer gas decay method. Although the measured air change rates included the effects of air inflows from the surrounding apartment units, the above discussion suggests that the contributions of the air inflows were negligible. Figure 6 shows a comparison between the calculated and the measured air infiltration rates. The results indicate that, for most cases, Eq 1 estimates the air infiltration rate within 20%.
Conclusions
The balanced fan pressurization method was modified to measure the air leakage rates through the exterior wall of an apartment unit and through the entire building envelope simultaneously. This technique was successfully used to test two high-rise apartment buildings to assess the effectiveness of an airtightness retrofit.
A method was developed to estimate air infiltration rates of individual apartment units using measured airtightness values and measured pressure differences across the exterior walls. A comparison between the air infiltration rates calculated using this method and those measured by the tracer gas decay method indicates that, for most cases, the proposed method estimates the air infiltration rates within 20%.
SHAW ET AL. ON HIGH-RISE APARTMENTS 229
fESTNO.6
APARTMENT UNIT 208 APARTMENT UNIT 310
BUILDING D BUILDING V TEsr NO. 8
f
0.2 Pa +- (12.38ppb) (Oppb) P PP) \.
I
TO CORRIDOR 1.5 PaFIG. %Tracer gas concentration, air flow directions, and corresponding pressure differentials.
!Ei
t
-
o APARTMENT 310. BUILDING V 0 0.2 0.4 0.6 0.8 1.0 1.2 (0.07 0.7Pat
AP-
12.4 h q-20.1 Lh4- (10.71 ppb)I
\.
4 0 - 2 ~ (0 p ~ b lMEASURED AIR CHANGE RATES (TRACER GAS), aclh FIG. 6-Calculated air infiltration rate versus measured air change rate.
0.5 Pa pppb)
u ~ r r
RWI.
TO CORRIDOR 1.5 Pa TEST NO. 6 0.2 Pa-
,
p.06 @) (9.51 ppb)wrr
LEFT TEST UNIT '.
-
UNIT RIGHT UNIT EFTh
TO CORRIDOR 3.0 Pa 22 Pa'
:j
ERRIDOR (0 ppb) (sc) (Sd) (007 1 i.2R'
UNrr ABOVE AP-
13.7 Pa q-21.1w,- (11.4ppb) TEST UNIT\.
UNIT BELOW 1 Pa230 AIR CHANGE RATE
Acknowledgments
This paper is based on the work done by the Institute for Research in Construction for the Ministry of Energy, Province of Ontario (MOE Module No. 6823, IRC CR 5387).
Reference
[I] Shaw, C. Y . , "Methods for Conducting Small-Scale Pressurization Tests and Air Leakage Data of Multi-Storey Apartment Buildings," NRCC 18632, ASHRAE Transactions, 1980, Vol. 86, Part 1,