Publisher’s version / Version de l'éditeur:
Vous avez des questions? Nous pouvons vous aider. Pour communiquer directement avec un auteur, consultez la
première page de la revue dans laquelle son article a été publié afin de trouver ses coordonnées. Si vous n’arrivez pas à les repérer, communiquez avec nous à [email protected].
Questions? Contact the NRC Publications Archive team at
[email protected]. If you wish to email the authors directly, please see the first page of the publication for their contact information.
https://publications-cnrc.canada.ca/fra/droits
L’accès à ce site Web et l’utilisation de son contenu sont assujettis aux conditions présentées dans le site LISEZ CES CONDITIONS ATTENTIVEMENT AVANT D’UTILISER CE SITE WEB.
Student Report (National Research Council of Canada. Institute for Ocean Technology); no. SR-2005-25, 2005
READ THESE TERMS AND CONDITIONS CAREFULLY BEFORE USING THIS WEBSITE.
https://nrc-publications.canada.ca/eng/copyright
NRC Publications Archive Record / Notice des Archives des publications du CNRC :
https://nrc-publications.canada.ca/eng/view/object/?id=f0c17a78-a6d5-4e5b-b52c-4a6f60f944b4 https://publications-cnrc.canada.ca/fra/voir/objet/?id=f0c17a78-a6d5-4e5b-b52c-4a6f60f944b4
NRC Publications Archive
Archives des publications du CNRC
For the publisher’s version, please access the DOI link below./ Pour consulter la version de l’éditeur, utilisez le lien DOI ci-dessous.
https://doi.org/10.4224/8895343
Access and use of this website and the material on it are subject to the Terms and Conditions set forth at Iceberg distribution on the Grand Banks: past and present
DOCUMENTATION PAGE
REPORT NUMBER
SR-2005-25
NRC REPORT NUMBER DATE
December 2005
REPORT SECURITY CLASSIFICATION
Unclassified
DISTRIBUTION
Unlimited
TITLE
ICEBERG DISTRIBUTION ON THE GRAND BANKS: PAST VS. PRESENT
AUTHOR(S)
Earl J. Reid
CORPORATE AUTHOR(S)/PERFORMING AGENCY(S)
Institute for Ocean Technology, National Research Council, St. John’s, NL
PUBLICATION
N\A
SPONSORING AGENCY(S)
IOT
IOT PROJECT NUMBER
42_926_10
NRC FILE NUMBER KEY WORDS
Iceberg, historical, distribution
PAGES iii, 21, App. FIGS. 13 TABLES SUMMARY
The following report is an analyses of historic data contributed to an electronic database named the Program on Energy and Research and Development (PERD) Iceberg Sightings Database. This database is composed of iceberg sightings on the Grand Bank’s since the 1960’s.
It is known that there is historical documentation of iceberg sightings in this location as far back as the 1800’s. The Institute for Ocean Technology (IOT) has started a project in an attempt to expand the PERD database by including all of this historical documentation. A time series such as this would show, during a time of suspected climate change, how the iceberg conditions of the present differ from those observed in the past.
Several students have already made contributions to this project in the past, by recording the historical iceberg sightings into an electronic format, working backwards in time from the year 1960. My contribution to this project has been transcribing the iceberg sightings from the 1930’s. Since the majority of my time has been spent on this task, I will attempt to show differences in the iceberg distribution of the 1930’s decade and the distribution of icebergs observed in the most current decade of the 1990’s.
ADDRESS National Research Council
Institute for Ocean Technology Arctic Avenue, P. O. Box 12093
National Research Council Conseil national de recherches Canada Canada Institute for Ocean Institut des technologies Technology océaniques
ICEBERG DISTRIBUTION ON THE GRAND BANKS:
PAST VS. PRESENT
SR-2005-25
Earl J. Reid
Summary
The following report is an analyses of historic data contributed to an electronic database named the Program on Energy and Research and Development (PERD) Iceberg Sightings Database. This database is composed of iceberg sightings on the Grand Bank’s since the 1960’s.
It is known that there is historical documentation of iceberg sightings in this location as far back as the 1800’s. The Institute for Ocean Technology (IOT) has started a project in an attempt to expand the PERD database by including all of this historical
documentation. A time series such as this would show, during a time of suspected climate change, how the iceberg conditions of the present differ from those observed in the past.
Several students have already made contributions to this project in the past, by recording the historical iceberg sightings into an electronic format, working backwards in time from the year 1960. My contribution to this project has been transcribing the iceberg sightings from the 1930’s. Since the majority of my time has been spent on this task, I will attempt to show differences in the iceberg distribution of the 1930’s decade and the distribution of icebergs observed in the most current decade of the 1990’s.
TABLE OF CONTENTS
1 INTRODUCTION ... 1
1.1 ICEBERG DATABASE... 1
1.2 PURPOSE... 3
1.3 SCOPE... 3
2 VISUAL AND NUMERICAL DATA ... 5
2.1 MAP... 5
2.2 MONTHLY DISTRIBUTION... 7
2.3 ACCUMULATION AND DENSITIES... 8
3 OBSERVATIONS... 13
3.1 CLIMATE CHANGE... 13
3.1.1 North Atlantic Oscillation... 13
3.1.2 Monthly Distribution... 15
3.1.3 Sea Ice... 15
3.1.4 Temperature... 16
3.2 OBSERVATION TECHNIQUES... 16
3.2.1 Shipping Lanes... 16
3.2.2 Grand Bank Operations... 18
3.2.3 Greenland Sightings... 19
LIST OF FIGURES
Figure 1: Map of Iceberg Sightings for the 1930's ... 6
Figure 2: Map of Iceberg Sightings for the 1990's ... 6
Figure 3: % of Monthly Iceberg distribution for the 1930's ... 7
Figure 4: % of Monthly Iceberg Distribution for the 1990's ... 8
Figure 5: Latitude Parameter of 41N|42N for the 1930's... 9
Figure 6: Latitude Parameter of 41N|42N for the 1990's... 10
Figure 7: Latitude Parameter of 46N|47N for the 1930's... 10
Figure 8: Latitude Parameter of 46N|47N for the 1990's... 11
Figure 9: Latitude Parameter of 47N|48N for the 1930's... 11
Figure 10: Latitude Parameter of 47N|48N for the 1990's... 12
Figure 11: North Atlantic Oscillation ... 13
Figure 12: Relationship of Icebergs with the NAO Index ... 14
Figure 13: A Closer look at the Iceberg Distribution of the 1930’s (Grey) and the 1990’s (White) ... 17
1 INTRODUCTION
1.1 Iceberg Database
Mr. Brian Hill, Ice Tank Supervisor of the Institute for Ocean Technology (IOT), is currently working on a project that involves the research of iceberg sightings throughout the Grand Banks of Newfoundland and Labrador prior to the 1960’s. The project was implemented shortly after 1998. During this year BMT Fleet Technology Limited (BMT) compiled a database named the Program on Energy and Research Development (PERD) Grand Banks Iceberg Database. It is now known as the PERD Iceberg Sightings Database, and contains all of the iceberg sightings on the Grand Banks and eastern Canada from 1960 to 2004.
PERD isa federal program that provides funds for research and development designed to guarantee the future of Canada’s energy is in the best interests of its economy and
environment. The PERD database allows access to all the information corresponding to the iceberg sightings since the 1960’s.
The PERD Iceberg Sightings Database was implemented to incorporate all of the iceberg sightings on the east coast of Canada, to assist with the identification of possible
problems that will interfere with the current activity on the Grand Banks. The database is in accordance with the six strategies of the Government of Canada’s energy priorities. These strategies include Diversifying Canada’s Oil and Gas, Cleaner Transportation for the Future, Energy Efficient Buildings and Communities, Energy Efficient Industry, Canada’s Electricity Infrastructure, and Climate Change. With its extensive and
thorough information of icebergs, the PERD Iceberg Sightings Database is an important source in the research involving Cleaner Transportation for the Future, and Climate Change.
One of the contributors to the PERD Iceberg Sightings Database is IOT. The institute contributes via Mr. Brian Hill’s project. Included in this project is the research of all the iceberg sightings prior to the 1960’s that have been reported by the International Ice Patrol (IIP), an organization initiated in 1914, to patrol the Grand Banks and detect all icebergs in the Trans Atlantic shipping lanes. This information is documented among the U.S. Treasury Departments Coastguard Bulletin. The bulletins tabulate a report of ice and other obstructions that were observed by any vessels, lighthouses, and other sighting sources that were located where the ice has drifted. Recorded among these observations are the iceberg number, sighting source, sighting method, latitude, longitude, year, ice season, date, number of bergs reported, and the size and shape of each berg or growler, along with any other comments that may need to be recorded for reader clarity.
The main component of Mr. Hill’s project requires the analysis and documentation of the sightings from a hardcopy to a Microsoft Excel sheet. This requires inputting the
information by reading through each entry of the hardcopy and transferring it to the Excel sheet. Sightings of sea ice, field ice & slob ice have previously been extracted and
analyzed by IOT, and obstructions such as wood, or wreckages were ignored during the data entry. Once each decade is finished, the information is sent to PERD to update the iceberg sightings database.
1.2 Purpose
Global warming is a topic that is of interest among the science and engineering world of present day. It is thought that anthropogenic affects have accelerated this phenomenon in recent decades, primarily since the 1960’s. It is, therefore, of interest to compare a current decade to a decade prior to the onset of global warming.
Ice climatology is of concern to operations on the Grand Bank’s. In particular those taking place among the oil and gas industry. This concern is demonstrated by the Sable Island’s oil and gas project off the coast of Nova Scotia. The environmental studies for this project were based on conclusions made from recent decades of ice-free waters. In 2003, the offshore platforms had to be suddenly evacuated, due to an intrusion of sea ice, an event not uncommon in decades prior to the onset of global warming.
The intentions of the following report are to show any differences that may exist between the iceberg data of the 1990’s decade and the iceberg data from the decade of the 1930’s. The data collected for this comparison has been extracted from the PERD Iceberg
Sightings Database and Mr. Brian Hill’s ongoing project at IOT. With the lack of information existing on this topic today, the following may provide a resource for any person involved in historical iceberg research.
1.3 Scope
There are three main sections to follow, which will be used in the analyses of the iceberg distribution among the 1930’s and the 1990’s. The first is composed of the raw data that has been accumulated, which will be used in the comparison of the two decades. This
data includes: total icebergs for each decade, maps that have been plotted using the program Versa Map, monthly distribution percentages of total bergs for each decade, iceberg densities between specified geographical coordinates, and the accumulation of the amount of bergs below 48°N, where the transatlantic shipping lanes are located.
The second section is a discussion of all of the differences that can be seen, between the two decades, in the data from the previous section. An evaluation such as this raises the argument that a sound comparison may not be made, due to the frequent changes
throughout a decade caused by atmospheric and oceanographic changes. Also, airborne observation techniques used presently are much different than the seaborne observations of yesteryear. One may ponder, then, the validity of comparing two decades that have such different observation techniques. This section will thus focus on the climatological differences between each decade, and how these differences, along with the differences in observation techniques, play a major role in the variation of iceberg distribution for the two decades.
The third and last section of the report will be a discussion of all the conclusions that can be derived from the observations. All the uncertainties that accompany this examination will also be mentioned amongst this section.
2 VISUAL AND NUMERICAL DATA
2.1 Map
During the1930’s, the total number of bergs that were observed by the IIP was 19,946. The following map has been plotted using the mapping program VERSAMAP 1.51 (Vmap). It has been formatted to include all the sightings corresponding to these 19,946 bergs. The most extreme southeasterly sighting for this decade was at 42.24°N and 34.22°W. The latitudinal and longitudinal parameters have been set between 80°N and 40°N, and 75°W and 35°W respectively, to ensure that all of the sightings during this decade are included.
Figure 1 shows the bergs followed the Canadian current from the north, where they got taken by the Labrador Current and carried down to the Grand Banks area. Here is where many of the bergs drifted and eventually melted. Some bergs ventured down from the southwest of Greenland, where they merged with the bergs from the Canadian current. These too found there way down to the southeastern tip of Newfoundland. The bergs drifted along the northern tip of Newfoundland, through the Straight of Belle Isle.
For the decade of the 1990’s, the total number of bergs observed by the IIP was 30, 406. The extreme southeasterly sightings for this decade were 39.90°N & 43.33°W and 44.17°N & 36.48°W. Figure 2 illustrates the path and drift of the sightings for the 1990’s. The bergs drifted along the eastern side of Newfoundland and Labrador, while the density of bergs throughout the Grand Banks and the west side of the Northern Peninsula was large.
Figure 1: Map of Iceberg Sightings for the 1930's
2.2 Monthly Distribution
For the 1930’s, 97.9% of the19, 946 bergs were observed during the spring and summer seasons. The month of May encountered the most icebergs, at 38.3 % of the total, while the least was seen during the month of November, at 0.02% of the total.
During the 1990’s, 89.54% of the 30, 406 bergs were observed during the spring and summer. May had the most bergs at 23.4 %, while November had no icebergs. Both this information and the information for the 1990’s are shown in figures 3 & 4.
0 5 10 15 20 25 30 35 40 45
January February March
April May June July
August
September October November December
Month
% of Bergs
0 5 10 15 20 25 30 35 40 45 Ja nu ar y Febr ua ry
March April May Jun
e
July
Aug
ust
September October Novem
ber Dec em ber Month % o f Be rgs
Figure 4: % of Monthly Iceberg Distribution for the 1990's
2.3 Accumulation and Densities
The Trans Atlantic Shipping lanes are located south of 48°N. During the 1930’s, it has been determined that 58.44% of the total bergs were observed among this location. Also, density percentages of latitude and longitude squares, below 48°N, have been found. Data for three different latitudinal cases has been calculated, using the same longitudinal limits of 46°W and 52°W. Here are the density percentages for each condition:
• 46°N & 47°N: 2.38, 4.84, 4.81, 2.02, 3.21, & 3.60 • 47°N & 48°N: 2.21, 3.65, 3.95, 4.91, 6.09, & 4.90
• 41°N & 42°N: 0.03, 0.09, 0.32, 0.16, 0.51, & 0.07
The accumulation of bergs located throughout the Trans Atlantic shipping lanes during the time frame of the 1990’s was 32.4% of the total observations. For comparison purposes, the same three latitudinal and longitudinal square parameters of the thirties have been used for the nineties density percentages of the North Atlantic shipping lanes. They are:
• 46°N & 47°N: 4.46, 4.58, 2.77, 1.17, 0.90, & 1.29 • 47°N & 48°N: 4.50, 7.33, 5.92, 3.31, 2.65, & 3.48 • 41°N & 42°N: 0.03, 0.21, 0.31, 0.35, 0.41, & 0.16 Figures 5 through 10 illustrate this data.
0 .0 0 0 .1 0 0 .2 0 0 .3 0 0 .4 0 0 .5 0 0 .6 0 4 6 |4 7 4 7 |4 8 4 8 |4 9 4 9 |5 0 5 0 |5 1 5 1 |5 2 L o n g itud e P a r a m eter s (D e g r ees)
% of be rgs be low 4 8N
0 .0 0 0 .1 0 0 .2 0 0 .3 0 0 .4 0 0 .5 0 0 .6 0 4 6 |4 7 4 7 |4 8 4 8 |4 9 4 9 |5 0 5 0 |5 1 5 1 |5 2 L o n g itud e P a ra m e te r s (D eg r e es) % of be rgs be low 4 8N
Figure 6: Latitude Parameter of 41N|42N for the 1990's
0 1 2 3 4 5 6 4 6 | 4 7 4 7 | 4 8 4 8 | 4 9 4 9 | 5 0 5 0 | 5 1 5 1 | 5 2 L o n g it u d e P a r a m e t e r s (D e g r e e s ) % o f be rgs be lo w 4 8N
0 1 2 3 4 5 6 4 6 | 4 7 4 7 | 4 8 4 8 | 4 9 4 9 | 5 0 5 0 | 5 1 5 1 | 5 2 L o n g it u d e P a r a m e t e r s ( D e g r e e s ) % of ber gs below 4 8N
Figure 8: Latitude Parameter of 46N|47N for the 1990's
0 1 2 3 4 5 6 7 8 4 6 | 4 7 4 7 |4 8 4 8 | 4 9 4 9 |5 0 5 0 | 5 1 5 1 |5 2 L o n g itud e P a r a m e te r s (D e g r e e s ) % o f ber gs bel ow 48N
0 1 2 3 4 5 6 7 8 4 6 | 4 7 4 7 | 4 8 4 8 | 4 9 4 9 |5 0 5 0 |5 1 5 1 |5 2 L o n g it u d e P a r a m e t e r s (D e g r e e s ) % of bergs below 48N
3 OBSERVATIONS
3.1 Climate Change
3.1.1 North Atlantic Oscillation
The North Atlantic Oscillation (NAO) is a large variation in atmospheric pressure between the subtropical high system and the low polar system. The NAO plays a dominant role in the climate of the North Atlantic Ocean, which includes iceberg drift and distribution.
The strength of the NAO is measured by an index, which is the difference in pressure between the subtropical high, and the polar low. This difference is either positive or negative. A positive NAO index indicates that there is a larger than normal subtropical high and a deeper than normal polar low, resulting in stronger, colder winds from the North and Northwest over Eastern Canada. A negative NAO index however, indicates a weak subtropical high and weak polar low, resulting in weaker and milder winds that take a west-east path. This means that a positive NAO should result in a stronger Northerly flow in the East, which should encourage iceberg drift, while a negative NAO indicates a weaker flow. Figure 11 shows the flow pattern of the North Atlantic Oscillation.
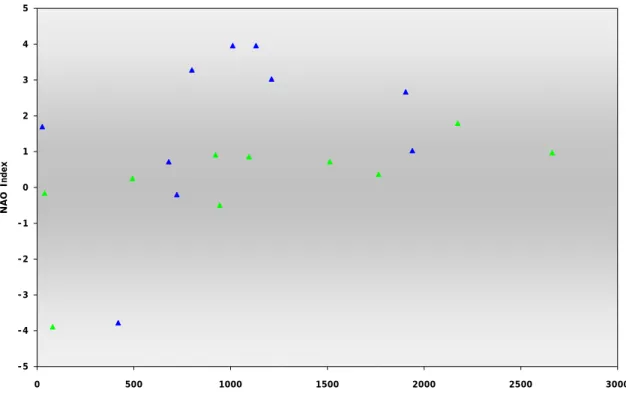
One would expect that an ice season with more bergs would correspond to a year with a higher NAO index, while less bergs would indicate a year with a smaller NAO. Figure 12 is a plot of the number of bergs below 48°N Vs. the NAO index. The 1930’s are represented by the green triangles and 1990’s are represented by the blue triangles. Here it is shown that there is somewhat of a linear relationship between the amount of bergs and the NAO index. A large number of bergs correspond to a higher NAO, while a small number of bergs correspond to a lower NAO.
-5 -4 -3 -2 -1 0 1 2 3 4 5 0 500 1000 1500 2000 2500 3000 # of Bergs below 48N NAO Index
Figure 12: Relationship of Icebergs with the NAO Index
The NAO index, located in the appendices, shows that the 1930’s experienced an average index of 0.132, while the 1990’s experienced an index of 1.64. This indicates that a
colder climate was present during the latter decade, which implies that the climate of the 1930’s was actually warmer than that of the 1990’s.
Figures 1 & 2 illustrates the iceberg distribution of the 1930’s were strewn more
southeasterly than those of the1990’s. The best explanation for this difference is due to the influences of the NAO.
Figures 5 to Figures 10 show that there was very little or no change in the percentage of bergs that drift close to the extreme drift marks. It was determined from this data set that there was a 0.29% increase, since the 1930’s, of bergs that reached this location. This information therefore gives very little evidence of any kind of climate change.
3.1.2 Monthly Distribution
The data set of the percentage of bergs distributed monthly shows that most of the bergs for both decades were observed during the spring and summer. However, a closer look at figures 3 & 4 shows us there were more bergs during the winter season of the nineties than there were for the thirties. Also, the month of May during the thirties experienced 38.3% of the entire population of bergs for the decade, while only 23.4 % of the bergs for the nineties were observed during the month of May, a 15 % difference.
3.1.3 Sea Ice
Sea ice is a common occurrence throughout the Grand Banks during the winter months. Due to the fact that seawater freezes at approximately -2°C, sea ice is more common
among a colder climate. Sea ice protects icebergs from wave erosion, providing a longer lifespan for the icebergs. A colder climate would assist the bergs, providing a cold perimeter of sea ice around them, preserving the bergs for longer periods of time. This information is a possible reason for the difference in the iceberg total for each decade, given the implied colder climate of the 1990’s.
3.1.4 Temperature
Another data source that is helpful in the argument of climate change is the temperature for a specific time series. A study done by Environment Canada gives the temperatures for the 1930’s and the 1990’s. These temperatures span the winter months of each decade, from January to April. The average temperature for these months during the 1930’s was –3.80°C, while the average temperature for these months during the 1990’s was –4.12°C. This 0.32 °C difference is clear evidence of a colder 1990’s climate, validating the argument of climatological differences playing a major role in the different iceberg distributions for each decade.
3.2 Observation Techniques
3.2.1 Shipping Lanes
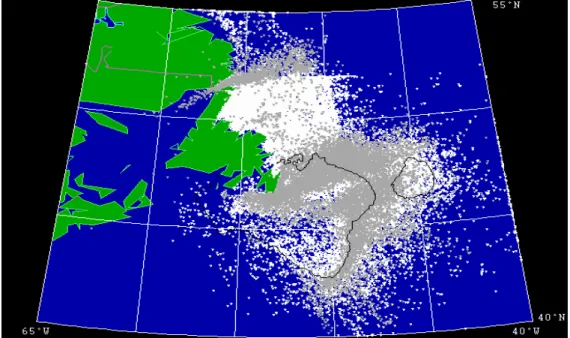
Further inspecting the data from the maps may lead one to believe that climate change is the main contributor to the differences in the number of bergs for each decade, but one reason for this difference may be due to the different observation techniques used. This is demonstrated in figure 13.
Figure 13: A Closer look at the Iceberg Distribution of the 1930’s (Grey) and the 1990’s (White)
It is apparent in this figure that the distribution of icebergs for the 1990’s was more densely populated between 48°N and 52°N than bergs of the 1930’s. Other data that illustrates this is the data from section 2, which indicates that almost 60% of bergs sighted during the 1930’s were below 48°N, while a little over 30% of sightings during the 1990’s were distributed in the same location. The reason for this difference is due to the following.
During the early and mid 20th century ships reported almost all of the icebergs, where most of these sightings were in the area of the North Atlantic shipping lanes, located below 48°N. It was very uncommon for any ships or vessels to stray North of this point, with the exception of the Straight of Belle Isle, a common route to the St. Lawrence River. During the 1990’s, however, the most common observation technique was airborne methods. This method would allow for a wide range of area to be scanned and
observed, and was a very accurate way to study the floe of bergs, which means the IIP’s study of the iceberg distribution amongst the Grand Banks was much more thorough. This data helps show that a prominent factor for the difference in iceberg distribution for each of these decades is due to the observation techniques.
3.2.2 Grand Bank Operations
Not only are the Grand Banks a busy area of transatlantic shipping, it is also an area that contains a large quantity of oil and gas. There are three platforms that are currently extracting these resources, all of which are located within the limits of 46°N & 48°N, and 48°W & 49°W. These platforms are Hibernia, Terra Nova, and White Rose. All
precautionary measures are taken to prevent any accidents on these rigs. This includes the research and study of iceberg flows in the area of oil extraction.
The data from section 2 shows that there was very little change in the density of icebergs along the Grand Banks from the 1930’s to the 1990’s. Between 46°N& 47°N, at the specified longitudes, there were approximately 21% of the total bergs below 48°N, and approximately 15% of the total bergs below 48°N in the 1990’s were located in the exact same area. For 47°N & 48°N, 26% of the total bergs below 48°N were distributed during the 1930’s, and 27% of this total were distributed throughout the 1990’s. Thus, there was very little change in the percentage of bergs that accumulated amongst the location of these oilfields. Although there is potential for hazard, this information implies that the operations on the Grand Banks are, for the most part, free of iceberg collision.
3.2.3 Greenland Sightings
A closer look at Figure 1 and Figure 2 illustrates that a number of bergs were observed along the coast of Greenland during the 1930’s, while a minimal amount of icebergs were observed at this location in the 1990’s. The dominating role for this difference is due to the change of sighting methods of each decade.
During the time previous to the year 1959, there was no iceberg observation organization present in Greenland. Any berg that found its way along the coast of Greenland was reported to the IIP. Thus, any bergs that were found off the coast of Greenland during the 1930’s were entered into the IIP iceberg reports. In 1959, a Danish ship named the Hans Hedtoft collided with a berg off the coast of Greenland, claiming all lives of the
personnel on board. This initiated a Danish iceberg patrol similar to the IIP. Since this time, any bergs that find there way in this location are now reported to this organization. This is why there was a very small berg count along the coast of Greenland during the 1990’s, compared to the berg count of the 1930’s.
4 CONCLUSION
As mentioned earlier in the report, there is a belief throughout present day society, that the global climate is getting warmer, due mainly to anthropogenic effects. The
information accumulated in the report has provided a foundation for an opposing argument. This information indicates that the climate of the 1990’s was actually colder than the climate of the 1930’s, contrasting with these present beliefs. This climate difference is a key factor for the difference in iceberg distributions.
It has also been illustrated that there is a large difference in the observation techniques used during each of these decades. The use of airborne techniques of the 1990’s and the implementing of the Danish Ice patrol in Greenland is also responsible for the difference in iceberg distribution between the 1930’s and the 1990’s.
Results of iceberg distribution amongst the oilfields on the Grand Bank’s showed little difference in the density and accumulation of bergs during the 1930’s and the 1990’s. This illustrates that there is some degree of safety from icebergs for those involved in these projects, although there is always a chance of disaster, which is illustrated by the evacuation of the offshore platform on the Sable Island’s in 2003.
The preceding report has lead to the conclusion that the reasons for the differences in iceberg distribution between the 1930’s and the 1990’s are due to the different climates and observation techniques of each decade.
5 REFERENCES
Season of 1930-1939. International Ice Observation and Ice Patrol Service in the North Atlantic, Table of Ice and Other Obstructions. Washington, D.C.: U.S. Coast Guard, 1931-1940.
Program for Energy and Research and Development (PERD) Grand Banks Iceberg Database. Available On-line:
http://www.chc.nrc.ca/English/Cold Regions/Reports/PERD/grandbanks_e.htm,
November 2005
International Ice Patrol. Mission. Available On-line:
http://www.uscg.mil/lantarea/iip/home.html, November 2005.
International Ice Patrol. History. Available On-line:
http://www.uscg.mil/lantarea/iip/home.html, November 2005.
North Atlantic Oscillation. Available On-line: http://www.ldeo.columbia.edu/NAO/, November 2005
Program for Energy and Research and Development (PERD). About PERD. Available On-line: http://www2.nrcan.gc.ca/es/oerd/english/View.asp?x=669, November 2005.
Appendix A
Appendix B