Publisher’s version / Version de l'éditeur:
Vous avez des questions? Nous pouvons vous aider. Pour communiquer directement avec un auteur, consultez la première page de la revue dans laquelle son article a été publié afin de trouver ses coordonnées. Si vous n’arrivez pas à les repérer, communiquez avec nous à [email protected].
Questions? Contact the NRC Publications Archive team at
[email protected]. If you wish to email the authors directly, please see the first page of the publication for their contact information.
https://publications-cnrc.canada.ca/fra/droits
L’accès à ce site Web et l’utilisation de son contenu sont assujettis aux conditions présentées dans le site LISEZ CES CONDITIONS ATTENTIVEMENT AVANT D’UTILISER CE SITE WEB.
IEA 2003, International Ergonomics Association XVth Triennial Congress
[Proceedings], 2003
READ THESE TERMS AND CONDITIONS CAREFULLY BEFORE USING THIS WEBSITE. https://nrc-publications.canada.ca/eng/copyright
NRC Publications Archive Record / Notice des Archives des publications du CNRC :
https://nrc-publications.canada.ca/eng/view/object/?id=6851e262-f2f0-4c80-96e8-b3f61198a453
https://publications-cnrc.canada.ca/fra/voir/objet/?id=6851e262-f2f0-4c80-96e8-b3f61198a453
NRC Publications Archive
Archives des publications du CNRC
This publication could be one of several versions: author’s original, accepted manuscript or the publisher’s version. / La version de cette publication peut être l’une des suivantes : la version prépublication de l’auteur, la version acceptée du manuscrit ou la version de l’éditeur.
Access and use of this website and the material on it are subject to the Terms and Conditions set forth at
Anthropometric Visual Data Mining: A Content-Based Approach
Paquet, Eric; Rioux, Marc
National Research Council Canada Institute for Information Technology Conseil national de recherches Canada Institut de technologie de l’information
Anthropometric Visual Data Mining: A
Content-Based Approach*
Paquet, E., Rioux, M.
August 2003
* Submitted to IEA 2003 - International Ergonomics Association XVth Triennial Congress. Seoul, Korea. August 24-29, 2003.. NRC 44977.
Copyright 2003 by
National Research Council of Canada
Permission is granted to quote short excerpts and to reproduce figures and tables from this report, provided that the source of such material is fully acknowledged.
Anthropometric Visual Data Mining: a Content-based Approach
Eric Paquet and Marc Rioux National Research Council Canada
[email protected] and [email protected]
Whereas much of the previous work on anthropometric data mining has focused on mining measurements and statistical data, in this paper content-based anthropometric data mining of three-dimensional scanned human bodies is discussed. A short review of digitalisation of human bodies is presented. Then it is shown how it is possible to describe the three-dimensional shape of the bodies by representing them with compact support feature vectors. A recurrent data mining system based on these vectors is then presented. This system allows to clustorize the population by using the “query by example” paradigm and the knowledge of the expert in a recurrent approach. A virtual environment is then used in order to perform visual data mining on the clusters and to characterize the population by defining archetypes. The subject is covered both from the theoretical and implementation point of view. We discuss calculation of the feature vectors, recurrent query by example clustorization, database, virtual environments and definition of the archetypes.
INTRODUCTION
The aim of anthropometry is to characterize the human body by a set of measurements. Those measurements are then utilized in order to design clothes that fit us better and means of transportation more adapted to our morphology. The technique by which these measurements are taken has barely changed since the ancient Greek. That is, most measurements are taken with the help of a ribbon. Despite its simplicity, this approach has many advantages: it is inexpensive, it reduces the complexity of the human body to a few parameters and is adaptable to any shape and size if the measurer has a proper understanding of the human morphology.
Recently, new approaches have been investigated, including the virtualisation of the whole human body (Vanier, 1995). This virtualisation is usually carried out with a full body scanner. The later can be based on various technologies that will be briefly reviewed later. The scanner provides a three-dimensional sampling of the human body i.e. that the body is characterized by a dense set of three-dimensional measured points. The topology of these points can be represented, for instance, with a polygonal mesh or with a set of parametric surfaces. It is noteworthy that the measurements obtained represent the human body at a certain time and that various scans may lead to slightly different results.
The scanning approach is very attractive, but the amount of data obtained is tremendous. Thus, it is tempting to extract the traditional measurements from the virtualised model. In order to be able to extract these measurements efficiently, an important research effort has been devoted to the automatic segmentation of the human body. Although very interesting from many point of views, this approach suffers from many drawbacks. It is well known that segmentation is a difficult task and that most (if not all) segmentation algorithms are unstable and suffer from a lack of robustness. Since automatic extraction of measurements relies principally on segmentation, many outliers are to be expected which is unacceptable in most applications.
There is an additional reason why this approach is not fully satisfactory: the three-dimensional model is reduced again to a very small number of dimensions. Since the whole body has been measured, it would be appropriate to make a better use of the entire set of acquired data.
This paper presents a new approach to describe three-dimensional scans of human bodies as well as a method to visually explore and analyse the data in order to define archetypes i.e. representative individuals that can be later used in the design of clothes and transportation equipments.
The paper is organized as follow. First, a number of full body scanners as well as their underlying measuring principles are described. Then, the description of three-dimensional scans is addressed. An approach to “data mine” archetypes from a given data set is proposed. This approach derives from content-based description, expert knowledge, recurrence and clustorization. The visualisation issue is addressed as well as the implementation. Finally, the system is applied to the CAESAR™ anthropometrics database.
A BRIEF REVIEW OF HUMAN BODIES VIRTUALISATION
Four full body scanners are briefly discussed as well as their underlying measuring principle namely: the Cyberware™, the Vitronics™, the W&W™, and the TecMath™.
The Cyberware™ and the Vitronics™ are both based on laser scanners triangulation. Four laser scanner heads are simultaneously translated on a rigid frame in order to acquire a registered set of three-dimensional points in a few seconds time. The colour information is acquired simultaneously by a set of digital cameras. The geometrical resolution is around 2 mm.
In the case of the W&W™ full body scanner, Moiré fringes are projected on the human body and many images are acquired simultaneously. By analysing the deformation of the pattern, it is possible to reconstruct the three-dimensional shape of the subject. For the TecMath™ system, the subject is put in front of a light background and the contour of the body is extracted from a picture taken by a digital camera. By extracting numerous contours for various orientations of the body, it is possible to reconstruct its three-dimensional shape. All systems provide a dense set of three-dimensional points.
DESCRIPTION OF THE THREE-DIMENSIONAL HUMAN SHAPE
The National Research Council has developed a system that automatically describes the shape of a large set of human body scans (Paquet, 2000). In this approach, the information about each body is inscribed in a descriptor, which is an abstract and compact representation of the three-dimensional shape of the corresponding body.
The descriptor is computed as follow. Firstly, a scale, translation, rotation and reflection invariant reference frame is calculated from the principal axis of the tensor of inertia of the human body. The principal axes correspond to the Eigen vectors of the tensor of inertia. It can be shown that the normalised principal axes are translation, scale and rotation invariant. By applying a suitable transformation, reflection invariance can be obtained. The axes of the reference frame are identified or labelled by their corresponding Eigen values.
The three-dimensional shape descriptor is based on the concept of a cord. A cord is defined as a vector that goes from the centre of mass of the human body to the centre of mass of a given triangle modelling its surface. It is thus assumed that a triangular mesh represents the surface of the human body.
The distribution of the cords is represented by three histograms. The first histogram represents the angular distribution between the cords and the Eigen vector with the highest Eigen value. The second histogram represents the angular distribution between the cords and the Eigen vector with the second highest value. The distribution of the radii is represented by a third histogram. This histogram is scale-dependent, but it can be made scale-independent by normalising the scale based either on the maximum radius or on the average radius. Note that all descriptors must have an identical normalization in order to be comparable. Each histogram is quantized over a certain number of bins. The histograms are normalised by the highest amplitude and each channel is quantified on one byte. A weight is associated to each cord. This weight corresponds to the area of the surface of the triangle to which the cord is attached. The weighting operation insures that the descriptors are, up to a certain point, tessellation invariant by taking into account the relative geometrical importance of each triangle on the body. That means that the descriptors do not depend on a particular representation or tessellation of the human body.
CONTENT-EXPERT-RECURRENT-BASED APPROACH FOR THE DEFINITION OF HUMAN
ARCHETYPES
The designs of clothes, transportations equipments as well as the ergonomic science are based on representative
individuals or archetypes. If they are selected properly, the design of a wide range or products can be successfully achieved. For our purpose, an archetype is defined as a representative individual taken from a given cluster. This individual must be a real body belonging to the cluster. Centre of mass and other averaging techniques do not lead to a representation that is satisfactory from an anthropometric point of view. Clusters can be defined in various ways. Traditionally, they have been derived from a principle component analysis or PCA of the ribbon-based measurements. In this section, it is proposed to define the clusters from a content-expert-recurrent-based approach. In the third section, a technique to describe three-dimensional scans of human bodies has been presented. Such an approach is said to be content-based because it describes the full body by its own content. Let us suppose we have a large number of scans and that each one of them has been described with the technique introduced in the third section.
In order to search for similar bodies, the following approach is proposed. First an expert chooses a body randomly or according to some a priori knowledge. This body is called the example and the whole procedure is said to be a query by example or QBE approach. The descriptor of this body is then compared with the other body descriptors. The comparison can be effectuated with the help of a metric, with Bayesian techniques or with a fuzzy approach. In the later case, a fuzzification of the descriptor has to be performed. The uncertainty of the measurements can be taken into account through a covariance matrix if required. In our case, a Euclidian norm is used and we assume that the covariance matrix reduces to a single variance that is a function of the number of measurements, which is a reasonable approximation for our purpose. After the bodies have been compared, a small subset of the most similar bodies is generated. A body is then selected from the subset. An expert according to a given set of criterions carries out the selection. For instance, the expert might be searching for an archetype for thin bodies. The expert starts the process by selecting a body of a thin person and then interrogates the database in order to obtain a short list. Then, he/she selects who, according to his best knowledge, would constitute the best archetype and reiterates the process again. After a few iterations of the recurrent process, it is possible to rapidly converge to the
centre of a given cluster. The fact that a cluster exists does not mean that it is meaningful: its relative importance and density must be asserted in a later step.
The presented approach is not limited to content-based description of bodies. Actually, classical anthropometric measurements and statistical data can be combined with the content-based approach. These data can be critical in order to enforce a certain number of constraints on the content-based description. For instance, one can used the waist, the weight or the income: the later being critical in the design of luxury products. If a classical and content-based approach is combined, the alphanumerical data act as a bank of filters, rules or criterions. The bodies are filtered according to those criterions and then analysed according to a content-based approach. For instance, only bodies heavier than 50 kg and lighter than 70 kg could be considered for a content-based analysis.
VISUAL DATA MINING
The assertion of the cluster is of the outmost importance. The objective of the procedure is to characterize the population with the smallest possible number of clusters. The number of clusters cannot be determined a priori. An archetype must be assigned to each significant cluster. If it is not the case, the archetype space will not be able to take into account the most common situations. This is what happens very often in the fashion industry. The small, medium and large paradigm does not define properly the population and at the end of the retail season, there is always a substantial inventory of one of those sizes. The relative importance and density of the clusters can be characterized by statistical calculations. The interpretation of these calculations can be difficult and their characterization involves the expert only at the end of the process, which can be too late. Consequently, a visual data mining approach is proposed in order to take into account the knowledge of the expert throughout the process.
The visual representation of the clusters is constructed as follow. The archetypes of each cluster, as obtained in the previous section, are positioned into space. The distance between them corresponds to the distance between their descriptors. The relative disposition of the archetypes is arbitrary as long as the distance constraint is enforced. The archetypes are disposed in order to facilitate the visualisation and navigation throughout the cluster space.
Then, the bodies are attributed to their respective cluster. A body is attributed to a given cluster if the distance between its descriptor and the archetype descriptor is minimum. In the visual representation, the scale for the intra-cluster distance can be different from the scale for the inter-cluster distance if visualisation is facilitated. The orientation within the cluster and the relative orientation of the clusters can be used to display additional parameters like the income and the weight. By navigating and exploring the cluster space, the expert can validate them and select the most relevant subset.
APPLICATION TO THE CAESAR™ ANTHROPOMETRIC DATABASE
This section briefly describes the CAESAR™ anthropometric database (Brunsman, 1997) and some preliminary results obtained with the database. The CAESAR™ database has been created by scanning thousands of individuals in the USA, Italy, Canada and the Netherlands with a Cyberware and a Vitronics full body scanner. For each individual, anthropometric and demographic data were collected like the weight, the income, the car brand, etc.
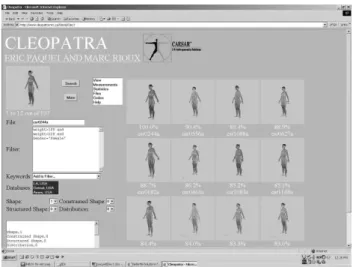
Figure 1. Outcome of a query for a thin woman from the CAESAR™ database with our three-dimensional shape content-based approach. Constraints have been applied on the weight and the gender.
Our system is been used in order to describe and cluster the various populations of the CAESAR™ database. It is currently accessible to the CAESAR™ partners (the peoples who sponsored the creation of the database) in order
to perform their own research. Figure 1 shows the outcome of a query for thin women from the North American part of the CAESAR™ anthropometric database. By performing various queries as described in the previous sections, it is possible to understand better the profile of the population and to design the products accordingly.
The visual data mining system is still in development but a virtual environment or VE has been already developed. This environment displays in passive stereo mode any three-dimensional scene including our visual data mining representation. It is constituted of two laptops, two standard DLP video projectors and two circularly polarized filters. One computer renders the left-eye view while the other computer renders the right-eye view. Both computers are synchronized in client-server architecture and are characterized by their distributed and multithread architecture. The two views are simultaneously back-projected on a polarisation-preserving screen made by ScreenTech. Many experts can simultaneously work on the stereo display by wearing the corresponding polarised glasses.
CONCLUSIONS
An anthropometric visual data mining system based on a content-expert-recurrent-based approach has been presented. This approach makes an optimal utilisation of the scanned data while allowing multiple and iterative interventions of the expert in the archetype determination process.
REFERENCES
Vannier, M. W. and Robinette, K. M. 1995 “Three dimensional anthropometry”, Proceedings ‘95 Biomedical Visualization, October, pp. 1-8, IEEE Computer Society Press.
Paquet E. and Rioux M. 2000, "Influence of Pose on 3-D Shape Classification". SAE International Conference on Digital Human Modeling for Design and Engineering, Dearborn, MI, USA, June 6-8, Paper # 2000-01-2148. Brunsman, M. A., Daanen, H. and, Robinette, K. M. 1997. “Optimal Postures and Positioning for Human Body Scanning”, Proceeding of International Conference on Recent Advances in 3-D Digital Imaging and Modelling. IEEE Computer Society Press, Los Alamitos, CA, USA.