HAL Id: hal-02902617
https://hal.archives-ouvertes.fr/hal-02902617
Submitted on 20 Jul 2020
HAL is a multi-disciplinary open access
archive for the deposit and dissemination of
sci-entific research documents, whether they are
pub-lished or not. The documents may come from
teaching and research institutions in France or
abroad, or from public or private research centers.
L’archive ouverte pluridisciplinaire HAL, est
destinée au dépôt et à la diffusion de documents
scientifiques de niveau recherche, publiés ou non,
émanant des établissements d’enseignement et de
recherche français ou étrangers, des laboratoires
publics ou privés.
Remote sensing of CO, CH4 , and O3 using a
spaceborne nadir-viewing interferometer
Cathy Clerbaux, P. Chazette, Juliette Hadji-Lazaro, Gérard Mégie, J.-F.
Müller, S. Clough
To cite this version:
Cathy Clerbaux, P. Chazette, Juliette Hadji-Lazaro, Gérard Mégie, J.-F. Müller, et al.. Remote
sensing of CO, CH4 , and O3 using a spaceborne nadir-viewing interferometer. Journal of
Geo-physical Research: Atmospheres, American GeoGeo-physical Union, 1998, 103 (D15), pp.18999-19013.
�10.1029/98JD01422�. �hal-02902617�
JOURNAL OF GEOPHYSICAL RESEARCH, VOL. 103, NO. D15, PAGES 18,999-19,013, AUGUST 20, 1998
Remote sensing of CO, CH4, and Oa using a spaceborne
nadir-viewing interferometer
C. Clerbaux,
1 P. Chazette,
2 J. Hadji-Lazaro,
1 G. Mdgie,
1 J.-F. Miiller,
3
and S. A. Clough
4
Abstract. Within the next 5 years, several instruments launched on polar orbiting
satellites will provide high-resolution
infrared remote-sensing
measurements
of CO,
CH4, and 03 on a global scale. The upwelling spectral radiances to be recorded
by a nadir-looking remote sensor have been simulated using a high-resolution
radiative code (line-by-line radiative transfer model (LBLRTM)) coupled to a
three-dimensional
chemical transport model (intermediate model of the annual
and global evolution of species
(IMAGES)). The instrumental specifications
of
the Fourier transform interferometric
monitor for greenhouse
gases/Advanced
Earth Observing
System (IMG/ADEOS) and infrared atmospheric
sounding
interferometer
(IASI/METOP) were used
to generate
realistic
data. Calculations
have been performed to assess the sensitivity of the nadir spectral radiances to changes in the gas concentration, temperature profile and to instrumental characteristics. We provide spectral intervals for an efficient retrieval of these species, together with a set of climatological tropospheric standard mixing ratio profiles.
1. Introduction
Global scale measurements of trace gases are required
to understand tropospheric chemistry and to estimate the possible radiative forcing of climate due to increas-
ing concentrations of greenhouse gases [World Meteo- rological Organization (WMO), 1995; Intergovernmen- tal Panel on Climate Change (IPCC,), 1996]. Ozone (Oa) and two of its main precursors, carbon monoxide (CO) and methane (CH4), are strongly coupled through chemical reactions involving the hydroxyl radical (OH). The photolysis (A < 310 nm) of tropospheric Oa is
followed
by reaction
of the oxygen
atom O(1D) with
water vapor (H20), producing OH. Reaction with OH
provides the dominant loss mechanism of many atmo- spheric pollutants. The oxidation cycles of both CH4
and CO either produce or destroy Oa depending on the
level of concentration of nitric oxide [Crutzen, 1973; Lo- gan et al., 1981]. As a consequence, a change in the
1Service d Adronomie du CNRS, Institut Pierre-Simon Laplace, Paris, France.
2 Laboratoire des Sciences. du Clim..at et de.l'Environnement GEA, Institut Pierre-Simon Laplace, Saclay, France.
aBelgian Institute for Space Aeronomy, Brussels. 4Atmospheric and Environmental Research, Inc., Cam- bridge, Massachusetts.
Copyright 1998 by the American Geophysical Union. Paper number 98JD01422.
0148-0227/98/98JD-01422509.00
concentration of one of these species modifies the oxi- dizing capacity of the troposphere and hence affects the
lifetimes and abundances of many other trace gases.
At the beginning of the 1990s, important changes
in CO and CH4 growth rates were reported [Novelli et al., 1994; Dlugokencky et al., 1994], and the under-
standing of these changes in term of sources and sinks
has been the focus of several studies [Dlugokencky et al., 1996; Granier et al., 1996]. Despite this effort,
large uncertainties remain on the estimated strengths of
sources
and sinks
of the main trace
gases
[ WMO, 1995].
These uncertainties could only be resolved from the si- multaneously measured distributions of sources gases(CO and CH4) and O3 together with chemical trans- port models (CTMs) using inverse calculation methods [Brown, 1995] and data assimilation techniques [Fisher and Lary, 1995]. Global budgets for these species would
constrain the oxidizing power of the troposphere and thus infer the global distribution of OH, which is not directly measurable from space. The impact of biomass burning could also be analyzed from these observations.
This has heightened interest in developing global scale
measurements using ground-based networks [Novelli et
al.,
1992;
Dlugokencky
et
al, 1994]
an•
spaceborne
re-
mote sensors. The ground-ha.ted mea•s.•rements, usin•
gas bottle sampling and gas chromatography, provide accurate data but are restricted in spatial coverage.
Only a limited picture of the distribution of species like
GO and O3 can be obtained. Remote sensors provide global scale measurements but with an order of mag- nitude lower accuracy. Several nadir-viewing instru-
19,000 CLERBAUX ET AL.: REMOTE SENSING OF CO, CH4, AND Oa ments dedicated to the sounding of the troposphere are
planned for launch on polar orbiting satellites within
thc coming
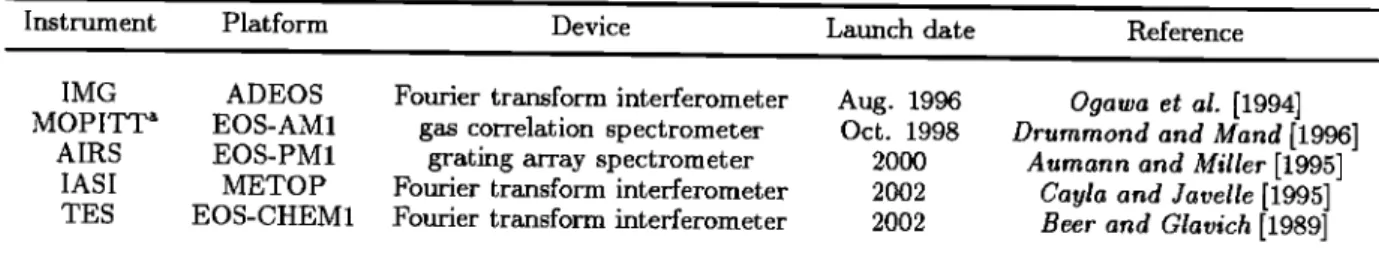
decade. A summary
of the ongoing
and
forthcoming missions is presented in Table 1. The in-
terferometric
monitor for greenhouse
gases
(IMG) in-
strument was launched aboard the Japanese Advanced
Earth Observing
System
(ADEOS) on August
17, 1996,
and stopped
operating
after 10 months, on June 30,
1997. The measurements of pollution in the tropo- sphere (MOPITT) instrument is scheduled for launch
in October
1998 as part of NASA's EOS-AM1 payload.
The atmospheric
infrared sounder
(AIRS) will fly on
the EOS-PM1 spacecraft in the years 2000. The in-
frared
atmospheric
sounding
interferometer
(IASI) will
be carried by the European
Operational
Meteorology
(METOP) platform, to be launched around 2002. The
tropospheric
emission
spectrometer
(TES) will proba-
bly be part of the EOS-CHEM1 satellite early in the next century. All these instruments record atmospheric
spectra using the thermal emission of Earth as a source.
According
to their main mission
objectives,
they use
different
instrumental
device, spectral
resolution,
and
spatial
and temporal
samplings.
AIRS and IASI belong
to the next generation
of temperature
and humidity
sounders
for operational
weather
forecasting.
MOPITT
is designed
to measure
the global
distribution
of tropo-
spheric
CO and CH4. IMG and TES are both high reso-
lution interferometers
primarily
dedicated
to chemistry
and climate research. Owing to their nadir-viewing
recording geometry, these instruments are mostly sensi-
tive to the tropospheric
part of the atmosphere,
except
for TES, which will also
be able to scan
the stratosphere
thanks to its combined
limb and nadir-viewing
modes.
From data provided by these instruments it will be
possible
to retrieve information
on many geophysical
variables. Preliminary studies were undertaken to as-
sess the extent to which concentrations of infrared-
absorbing molecules could be retrieved with useful ac-
curacy
from upwelling
spectral
radiances
[Wetzel
et al.,
1995]. In order to prepare
these
missions,
fast forward
radiative
codes
[Clough
et al., 1992; Clough
and Iacono,
1995; Cheruy
et al., 1995;
Pan et al., 1995]
and efficient
algorithms for the retrieval of trace gases from measured
nadir radiances
are under development
[Clough
et al.,
1995; Clerbaux
et al., 1995; McMillan et al., 1996].
This paper aims to present the information content and sensitivity studies undertaken in the framework of
the development
of an inversion
algorithm
to retrieve
CO, CH4, and Oa from infrared atmospheric
spectra
recorded by a nadir-looking Fourier transform interfer-
ometer
[Clerbaux
et al., 1995]. Inversion
results
are not
reported in this paper, which attempts to estimate the uncertainties on radiances provided by IMG and IASI and compare the measurement accuracy to the variabil- ity of each molecule. A realistic database of aimulated
measurements
has been created (section
2), and rel-
evant spectral intervals for an efficient retrieval have
been
selected
(section
3). The contribution
of geophys-
ical variables
(concentration
and temperature)
and in-
strumental
characteristics
(noise
and resolution)
to the
recorded nadir radiances has been analyzed, and the ex-
pected variability of each species is estimated from the
CTM (section
4). A reduced
climatological
database
with representative
profiles
for each
species
is provided
(section
5).
2. Simulation of Nadir Radiance Spectra
In order to build a comprehensive database to make
sensitivity
studies and test inversion
algorithms,
we
have coupled
the atmospheric
concentration
profiles
provided
by the three-dimensional
tropospheric
chemi-
cal transport
model IMAGES (intermediate
model of
the annual and global evolution
of species)
[Miiller
and Brasscur, 1995] to the line-by-line radiative code
LBLRTM
[Clough
et al., 1992;
Clough
and
Iacono,
1995]
and then convolved these spectra with either the IMG or IASI instrumental function. The two models have
been extensively
validated
against
observational
data,
and their main characteristics
are briefly
reported
here,
along with the instrumental specifications of IASI and IMG.
2.1. Chemical Transport Model
The intermediate
model of the annual and global
evolution
of species
(IMAGES) is a three-dimensional
chemical
transport
model of the troposphere.
It ex-
tends
from the surface
to the lower
stratosphere
(50
hPa) with a horizontal resolution of 5 ø in latitude and
longitude, and includes 25 a-levels in the vertical. It
Table 1. Nadir-Viewing
Remote
Sensors
Providing
Simultaneous
Measurements
of Oa, CO, and
CH4
in
the Infrared, Using the Thermal Emission of Earth as a SourceInstrument Platform Device Launch date Reference
IMG
ADEOS
Fourier
transform
interferometer
Aug. 1996
MOPITT * EOS-AM1 gas correlation spectrometer Oct. 1998 AIRS EOS-PM1 grating array spectrometer 2000
IASI METOP Fourier transform interferometer 2002
TES EOS-CHEM1 Fourier transform interferometer 2002
Ogawa et al. [1994]
Drummond and Mand [1996]
Aurnann and Miller [1995]
Cayla and Javelle [1995]
Beer and Glavich [1989]
CLERBAUX ET AL.: REMOTE SENSING OF CO, CH4, AND Os 19,001
provides the distribution of 41 chemical compounds, in-
cluding CO, CH4, and 03. The chemical mechanisms
include 125 chemical reactions and 26 photodissociation
reactions. The model accounts for chemical transforma- tion, surfaces emissions (emissions from biogenic and anthropogenic sources), and dry and wet depositions.
The transport of long-lived chemical species is simu- lated by a semi-Lagrangian advection scheme on the basis of monthly mean climatological winds and tem- peratures provided by the European Center for Medium
Range Weather Forecasts (ECMWF). The effect of wind
variability at timescal•s shorter than a month is formu- lated through an eddy diffusion parametrization. Con- vection transport is also parametrized. The distribution of clouds, eddy diffusion coefficients, and the boundary conditions are monthly means constrained by observa-
tional data.
2.2. Radiative Transfer Model
The forward model used in this study is the line-by-
line radiative transfer model (LBLRTM, version 4.2),
which is an improved and accelerated version of FAS-
CODE [Clough et al., 1992; Clough and Iacono, 1995].
It has been parametrized for nadir-viewing geometry to simulate the infrared radiation emitted and absorbed by the Earth-atmosphere system along the optical path. High-resolution atmospheric radiances have been gen-
erated for cloud and aerosol-free conditions. In this
model, the line parameters for radiance calculations are provided by the HITRAN 92 spectroscopic database
[Rothman et al., 1992]. The Voigt line shape is used
at all atmospheric levels with an algorithm based on a linear combination of approximating functions. An algorithm is implemented for the treatment of the vari- ation of the Planck function within a vertically inho-
mogeneous layer. LBLRTM incorporates a full water
vapor continuum
model (CKD_2.2), validated against
atmospheric observations. Continua for carbon dioxide, oxygen, and nitrogen are also included.
Table 2. Instrumental Characteristics for IMG and IASI
IMG IASI
Spectral range, cm -• 714-3030 645-2760 Optical path difference, cm 10 2 Number of pixels I 4
Footprint, km 8 12
Total scan cycle time, s 110 8
apodization. The data are sampled at twice the Nyquist sampling frequency.
IASI has a squared field of view sampled by a matrix of 2x2 circular pixels of 12 km each and will provide
measurements with a good horizontal coverage due to
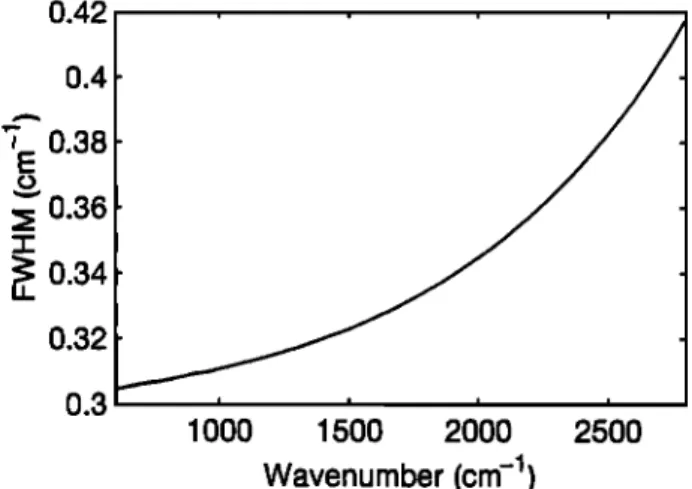
its ability to scan across •rack with a swath width of -4-1100 km. Owing to the off-axis position of the de- tectors in the focal plane, the IASI instrument spectral
response
ihnc'tion
(ISRF) and hence
the spectral
reso-
lution associated with its OPD of 2 cm are wavenumber
dependent. With increasing wavenumbers, the theoret-
ical sinc function is broadened by off-axis effects and becomes asymmetrical. The associated spectral reso- lution in terms of FWHM is provided as a function
of wavenumbers in Figure 1 [Camy-Peyret and Payan, 1997].
For technological reasons, the full spectral range cov-
ered by these instruments is subdivided in three spec-
tral bands with different radiometric noise associated
with the performance of each detector. The instrumen-
tal noise
(in mW/(m • cm
-• sr)) of each
instrument
is
plotted in Figure 2. For example, Figure 3 representsa high-resolution spectrum in the spectral range used
for CO retrieval as well as the simulated radiances for
both IMG and IASI instruments, taking into account spectral resolution, sampling, and radiometric noise.
2.3. Instrumental Function and Radiometric Noise
The high-resolution simulated radiances obtained by
introducing the IMAGES mixing ratio profiles of CO, CH4, and O3 into LBLRTM were convolved with the IMG and IASI instrumental response functions. The main instrumental characteristics of these two spec- trometers are reported in Table 2. They were optimized
taking into account the constraints associated with their
main mission objectives, which are climate research for
IMG and operational meteorology for IASI. This results
in a trade-off between spectral resolution and horizontal
sampling. The IMG spectrometer records atmospheric
spectra
using
an optical
path difference
(OPD) of 10 cm,
which corresponds to a spectral resolution, defined as
the full width at half maximum (FWHM) of thc spec- tral response function, of 0.1 cm -z after a Gaussian
0.42 , , q' 0.38 E ø,,9,
• 0.36
,•' o.34
0.32
•
13.3 ' ' ' ' 1000 1500 2000 2500Wavenumber
(cm
-•)
Figure 1. Spectral resolution (full with at half max- imum) as a function of wavenumber, calculated using
19,002 CLERBAUX ET AL.' REMOTE SENSING OF CO, CH4, AND O3 0.6 0.4 O.e 0 q- q- i lOOO -IASI + IMG 1500 2000 2500
Wavenumber
(cm
-1)
Figure 2. Radiometric instrumental noise for IASI and
IMG.
3. Spectral Interval Selection
The spectral signature of atmospheric molecules which
absorb in the infrared spectral range and present high concentration levels may be analyzed from the spec- tra recorded by a nadir-looking instrument using the
Earth's infrared emission as a source. Owing to pressure-
broadening of the absorption lines, these instruments are mostly sensitive to tropospheric absorbers. The
main absorption features in the 650-3000 cm -1 atmo-
spheric spectral range are due to rotational transition
lines related to the fundamental vibrational bands of
H20, CO2, 03, N20, CH4, and CO. To retrieve these species from the radiance spectra, channels with rele-
vant information for inversion have to be selected. In an
ideal situation, these spectral intervals would be located over the strongest absorption band of the molecule and should be sufficiently narrow to exclude the contaminat-
ing signal from other gases. Because of time and data
rate constraints, use of selected narrow spectral inter-
vals is also strongly recommended for routine retrieval.
Figure 4 and Figure 5 provide the simulated radiances
at 0.1 cm
-1 spectral
resolution
for moan atmospheric
conditions (Air Force Geophysics Laboratory (AFGL) U.S. Standard Atmosphere 1976) in the spectral range
where the main absorption bands of 03, CH4, and CO
occur. In order to illustrate the contribution of for-
eign interfering gases which absorb in the same spectral
range, the spectra were also calculated for the species
alone. In the 980-1080 cm -1 spectral interval, most
of the absorption features belong to the •3 vibrational
band of 03 (Figure 4a). Isolated H20 lines and a weak CO2 absorption band, betwoof. 1030 and !080 cm -l, explain the very small differences observed between the
two subplots of Figure 4a. To retrieve methane from the atmospheric spectra, selected spectral ranges are
to be chosen within either the 1200-1400 cm -1 or 2700- 3000 cm-1 spectral interval, which contain the methane
absorption lines associated with the •4 and •3 vibra-
tional bands, respectively. Important interferences due
to H20 (which
saturates
the spectra
above
1320
cm-1)
and N20 (between
1240 and 1320
cm
-1) are responsi-
ble for the strong perturbations observed in the •4 band
(Figure 4b), whereas the •3 band is mostly affected by water vapor lines (Figure 4c). Note that because of the IASI spectral range limitation at 2760 cm-1, only a nar-
row part of the • band may be used for CH4 retrieval from the IASI spectra. The top panel of Figure 5 rep-
resents the atmospheric spectra in the 2000-2250 cm -1
I I I [ I I I I I IASl 2 1 o • •
2125 2130 21•35 2140 21•45 21•50 21•55 2160 2165
Wavenumber (cm -1)Figure 3. Radiance spectra for a nadir view in the 2125-2165 cm -1 spectral interval, simulated
CLERBAUX ET AL.. REMOTE SENSING OF CO, CH4, AND Os 19,003 lOO Synthetic spectrum 100 980
• •øL_
'
,
,
,
,
._ • 60 • , , , 0 • I I • 1200 1240 1280 1320 1360 1400 (b) 0.3 0 0.3 0 2700 CH 4 2750 2800 2850 2900 2950 Wavenumber (cm -1)Figure 4. Simulated
nadir
radiance
spectra
at 0.1 cm
-• spectral
resolution
in the spectral
range
of (a) Os and (b) and (c) CH4 retrieval,
and corresponding
main
absorption
bands
for these
molecules.
spectral
range,
where
the intense
1-0 vibrational
tran-
sition of CO occurs. In order to illustrate the difficulty
of discriminating
between
the spectral
signature
of CO
and other absorbing
gases,
the separated
contribution
of CO, H20, CO2, Os, and N20 are also
represented.
Within these main vibrational bands, a set of narrow
spectral
windows
which
minimize
interferences
has
been
selected in order to define the relevant intervals to be used in the inversion process for an efficient retrieval of
Os, CH4, and CO. For each
selected
interval,
the follow-
ing criteria
were
applied'
(1) intense
and nonsaturated
spectral
signature
of the target species
(to increase
sig-
nal to noise
ratio) and (2) low contribution
of interfering
gases
(preferably
CO2 or N20 than H20 or Os, which
have
strong
spatial
variabilities).
The AFGL Standard
Atmosphere
1976 mixing ratio profiles
were used for
a first selection,
and then a test set of IMAGES rep-
resentative
profiles
allowed
refinement
of the proposed
wavenumber limits. The latter are provided in Table 3,
along
with the spectroscopic
identification
of the main
absorption
features. Each selected
interval contains
ei-
ther one single
absorption
line (CO, CH4) or groups
of
unresolved
lines merged
into broad peaks (CH4, 03).
All the selections were carried out at high spectral
resolution. When decreasing the spectral remlution, the
wings
of the instrumental
function
can introduce
inter-
ferences from other gases with absorbing lines located outside the selected spectral range, but these intervals
still remain less contaminated. A detailed study of this
effebt is given by Chazette
et al. [1998]. According
to
their spectral resolution and sampling, IMG and IASI have different recording channels within these intervals. The corresponding available channels for each instru- ment are also provided in Table 3. By adding all the
available channels for IMG and IASI, a total of 820 and
158 channels, respectively, are found for 03,884 and 36
for CH4 (including
both the v3 and the •4 bands),
and
19,004 CLERBAUX ET AL.. REMOTE SENSING OF (:O, CH4, AND Oa •o "T E4 •0 ._ 2 0 i I f I . [ co 2 o o
2000
2o:5o
I I I N2021•00
2150
2200
2250
Wavenumber (cm -1)Figure 5. (top) Simulated
nadir
radiance
spectra
at 0.1 cm
-1 spectral
re•olution
in the spectral
range of CO retrieval, and (remaining pannels) separated contribution for each absorbing gases (CO, H2, CO2, Oa, and N20).
An efficient inversion algorithm for the retrieval of CO, CH4, and Oa should include several of these chan- nels in order to improve the signal-to-noise ratio and to minimize the remaining weak contributions due to
interfering gases (mainly H20). Calculation time some- times limits the number of channels that can be intro-
duced in the inversion scheme. Among all the intervals, those which best agreed with the high-intensity/low-
interference criteria are given in parentheses in Table
3. The sensitivity studies described hereinafter were performed using the four intervals footnoted in Table 3, which were found to be totally free from interfering
constituents.
4. Sensitivity Studies
4.1. Measurement Accuracy
The radiances recorded by an infrared nadir-looking
instrument are functions of trace gas concentrations, at-
mospheric temperature profile, surface emissivity, and
measurement. In this study, we assumed that all vari- ables other than the gas concentration are known. The use of selected spectral intervals minimizes the uncer- tainty due to absorption of interfering gases. The sur- face emissivity over land is usually unknown, but use
of differential radiance values (baseline substracted) re-
duces contributions from surface emissivity, aerosols, and, to a lesser extent, clouds. Most of the uncertainty
on the measured radiances then comes from the instru-
mental noise and the use of a temperature profile that
may be erroneous.
Both IMG and IASI missions have as measurement
objectives the derivation of total column amounts for CO, CH4, and Oa. A measurement accuracy <10%
should be achieved for cloud and aerosol-free conditions [Diebel et al., 1996]. Retrieval of low-resolution vertical
profiles will also be undertaken for these species. This
section attempts to discuss these requirements and com-
pare them with the expected variability of each species. To perform these sensitivity studies, we used the large
instrumentalcharacteristics
(noise
andresolution).
Other data set of radiances
associated
with realistic
mixing
CLERBAUX ET AL.: REMOTE SENSING OF CO, CH4, AND O3 19,005
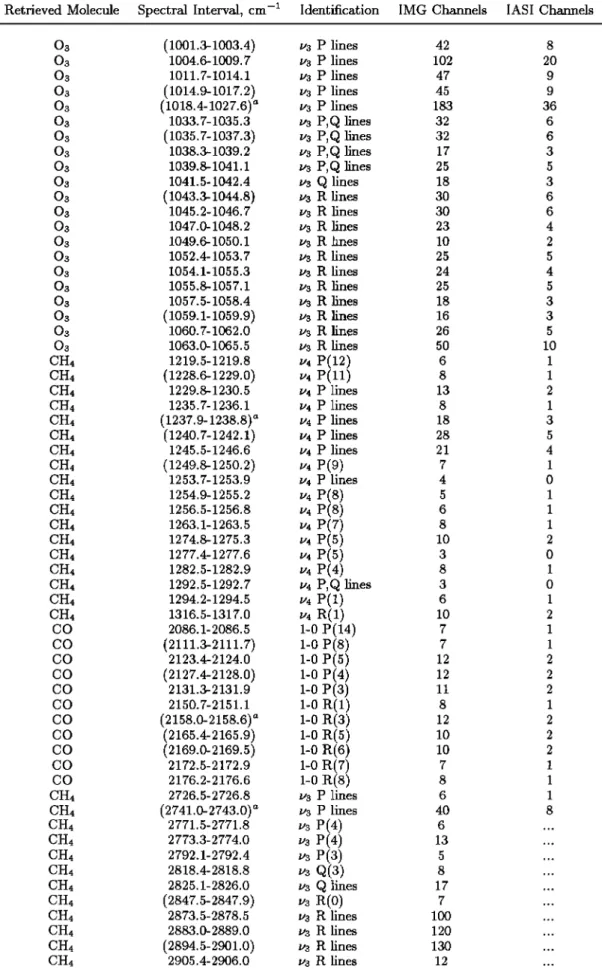
Table 3. Selected Spectral Intervals for Oa, CH4, and CO, Identification of the Main Absorption Features, and Corresponding Number of Channel Available for IMG and IASI
Retrieved Molecule Spectral Interval, cm -• Identification IMG Channels IASI Charmels
O3 (1001.3-1003.4) 1/3 P lines 42 8 O3 1004.6-1009.7 1/3 P lines 102 20 O3 1011.7-1014.1 1/3 P lines 47 9 O3 (1014.9-1017.2) 1/3 P lines 45 9 O3 (1018.4-1027.6) a 1/3 P lines 183 36 O3 1033.7-1035.3 1/3 P,Q lines 32 6 O3 (1035.7-1037.3) 1/3 P, Q lines 32 6 O3 1038.3-1039.2 1/3 P, Q lines 17 3 O3 1039.8-1041.1 1/3 P,Q lines 25 5 O3 1041.5-1042.4 1/3 Q lines 18 3 O3 (1043.3-1044.8) 1/3 R lines 30 6 O3 1045.2-1046.7 1/3 R lines 30 6 O3 1047.0-1048.2 1/3 R lines 23 4 O3 1049.6-1050.1 1/3 R hnes 10 2 O3 1052.4-1053.7 1/3 R lines 25 5 O3 1054.1-1055.3 1/3 R lines 24 4 O3 1055.8-1057.1 1/3 R lines 25 5 03 1057.5-1058.4 1/3 R lines 18 3 O3 (1059.1-1059.9) 1/3 R lines 16 3 O3 1060.7-1062.0 1/3 R lines 26 5 O3 1063.0-1065.5 1/3 R lines 50 10 CH4 1219.5-1219.8 1/4 P(12) 6 1 CHt (1228.6-1229.0) 1/4 P(11) 8 1 CH4 1229.8-1230.5 1/4 P lines 13 2 CH4 1235.7-1236.1 1/4 P lines 8 1 CH4 (1237.9-1238.8) a 1/-/4 P lines 18 3 CH4 (1240.7-1242.1) 1/4 P lines 28 5 CH4 1245.5-1246.6 1/4 P lines 21 4 CHt (1249.8-1250.2) 1/-/4 P(9) 7 1 CH4 1253.7-1253.9 I/4 P lines 4 0 CH4 1254.9-1255.2 1/4 P(8) 5 1 CH4 1256.5-1256.8 1/4 P(8) 6 1 CH4 1263.1-1263.5 1/4 P(7) 8 1 CH4 1274.8-1275.3 1/4 P(5) 10 2 CH4 1277.4-1277.6 1/4 P(5) 3 0 CH4 1282.5-1282.9 1/4 P(4) 8 1 CH4 1292.5-1292.7 1/4 P,Q lines 3 0 CH4 1294.2-1294.5 1/4 P(1) 6 1 CH4 1316.5-1317.0 1/4 R(1) 10 2 C O 2086.1- 2086.5 1-0 P (14) 7 1 CO (2111.3-2111.7) 1-0 P(8) 7 1 CO 2123.4-2124.0 1-0 P(5) 12 2 CO (2127.4-2128.0) 1-0 r(4) 12 2 CO 2131.3-2131.9 1-0 P(3) 11 2 CO 2150.7-2151.1 1-0 R(1) 8 1 CO (2158.0-2158.6) • 1-0 R(3) 12 2 CO (2165.4-2165.9) 1-0 R(5) 10 2 CO (2169.0-2169.5) 1-0 R(6) 10 2 CO 2172.5-2172.9 1-0 R(7) 7 1 CO 2176.2-2176.6 1-0 R(8) 8 1 CH4 2726.5-2726.8 1/3 P lines 6 1 CH4 (2741.0-2743.0) • 1/3 P lines 40 8 CH4 2771.5-2771.8 1/3 P(4) 6 ... CH4 2773.3-2774.0 1/3 P(4) 13 ... CH4 2792.1-2792.4 1/3 P(3) 5 ... CH4 2818.4-2818.8 1/3 Q(3) 8 ... CH4 2825.1-2826.0 1/3 Q lines 17 ... CH4 (2847.5-2847.9) 1/3 R(0) 7 ... CH4 2873.5-2878.5 1/3 R lines 100 ... CH4 2883.0-2889.0 1/3 R lines 120 ... CH4 (2894.5-2901.0) 1/3 R lines 130 ... CH4 2905.4-2906.0 1/3 R lines 12 ...
19,006 CLERBAUX ET AL.: REMOTE SENSING OF CO, CH4, AND Oa
Table 3. (continued)
Retrieved Molecule Spectral Interval, cm -1 Identification IMG Channels IASI Charmels
CH4 2910.4-2910.8 a R(6) 8 ... CH4 (2915.5-2918.0) ya R lines 50 ... CH4 (2926.0-2928.5) ya R lines 50 ... CHi 2947.0-2950.0 •,• R lines 60 ... CHi 2957.5-2959.5 •'3 R lines 40 ... CHa 2998.0-3000.0 ya R lines 40 ...
Intervals in parentheses are those that best ag•'eed with the high-intensity/low-interference cri-
teria.
a The sensitivity studies were performed using this interval.
by introducing the 2520 vertical profiles provided per month by the 3-D IMAGES model into the LBLRTM
radiative code.
4.2. Instrumental Noise
In order to simulate the contribution of the instru-
mental noise to the signal, each radiance spectra was also randomly perturbed using the noise characteristics provided in Figure 1. Averaged uncertainties on radi-
ances due to instrumental noise were found to be lower than 1% for 03 and CH4 (//4), 6% for CO, and 10% for
4.3. Vertical Temperature Profile
Temperature profiles are usually measured by observ-
ing the upwelling spectral radiance of the main vibra- tional bands of C02. Thanks to the high spectral res- olution of the forthcoming instruments, it is expected that temperature could be retrieved with accuracies of
1 K (RMS) at vertical resolution of 1 km, at least in the lower troposphere [Diebel et al., 1996]. In this sec-
tion, we study how the use of an erroneous temperature
profile impacts the calculated radiances and hence the
retrieval accuracy.
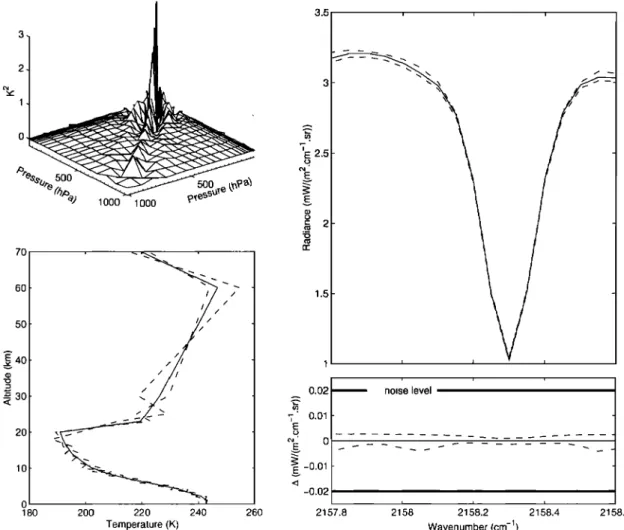
To perform realistic simulations, we made use of an error covariance matrix provided by Meteo-France which is represented in Figure 6. This matrix charac- terizes the accuracy associated with the retrieval of a temperature profile on 21 levels, using the IASI instru- mental characteristics. It was assumed that tempera-
ture determination could be achieved with at least a
similar accuracy when analyzing the IMG spectra. A test set of standard temperature profiles has been de- fined and then randomly perturbed using this error co- variance matrix. We estimated the impact of the use of
an erroneous profile by calculating the differences be-
tween the radiances obtained using the reference tem-
perature profiles and using a set of corresponding noisy
profiles, in each spectral interval and at each instru- mental resolution. In all cases, the use of an erroneous temperature profile leads to a relative error on the cal- culated radiance that does not exceed 0.5%, which is thus always below the noise level. As an example, a
polar temperature profile with two profiles perturbed
with random noise• their associated radiances in the
CO 2157.8-2158.6
cm -1 spectral
range, and the rela-
tive differences compared to the noise level are plotted in Figure 6.
As the spectra obtained by nadir-looking instruments use the thermal emission of Earth as a source, the tem-
perature dependence of each calculated radiance is de-
termined by both the temperature dependence of its
absorption coefficients and of the Planck function. Ow-
ing to the shape of the latter, the impact of an error on the temperature profile increases as a function of wavenumbers. As expected, the species absorbing at
lower wavenumbers (03, CH4-//4) are even less affected than those absorbing at higher wavenumbers (CO, CH4- //3)-
4.4. Spatial and Temporal Variability
From the monthly-mean tropospheric mixing ratio profiles simulated by the IMAGES model, we calcu- lated total column amounts for CO, CH4, and 03, each 5øx5 ø, for each month. Large variabilities are observed above continents, as a function of latitude, longitude, and season. The amplitude of the change in total col- umn is directly related to the average lifetime of the species, which is estimated to about 2 months and 10 years for CO and CH4, respectively, and ranges from
a few weeks
(low troposphere)
to 3 months
(high tro-
posphere)
for 03 [Mt•'ller
and Brasseur,
1995]. Because
of its long lifetime the distribution of methane in the
troposphere is nearly homogeneous, and its seasonal
change is small.
The global variability of each constituent at the spa- tial and temporal resolution of the IMAGES model may be quantified by analyzing the change in its to-
tal column value at a fixed time period (month fixed)
or by observing the change in concentration at a given
location (longitude
and latitude fixed) during the 12
months of the simulation. The results are summarized in Table 4, which presents for each constituent the rel-
ative difference
(in percent)
between
the minimum
and
the maximum values, as well as the standard deviation
CLERBAUX ET AL.' REMOTE SENSING OF CO, CH4, AND O3 19,007 3.5 i i i
•
3
.•
½½--
'o
•E;
2.,.5
% 10001000
• 2 70 6o / 1.5 / 50 / /.•
•• /
0.02,
noise
level
• 3o • • 0.0110
• -0.01
-o.o,
Temperature (K) Wavenumber (cm -1)Figure 6. (left) Temperature
error covariance
matrix (top) and temperature
profiles
used for
the simulation
(bottom). The initial temperature
profile is represented
by a solid line, whereas
the two noisy profiles calculated using the error covariance matrix are represented. in dashed
lines.
(right)
Associated
calculated
radiances
(0.1 cm
-1 spectral
resolution)
in the 2157.8-2158.6
cm -1 spectral range and differences between the three radiance spectra. The level of noise (2
10-2mW/(m
2 cm
-1 sr))is also
indicated
for comparison.
ities. These values should be considered as approxima-
tive due to the use of the IMAGES database. Indeed, the limitations of the model (monthly-means and lim- ited at 50 mbar) lead to calculated variabilities that
may be underestimated compared with the real atmo- spheric variabilities. In particular, the IMAGES model does not represent correctly the ozone variability at
the tropopause (troposphere/stratosphere exchanges).
A detailed comparison between the model res, fits and
the available observations, which are generally in goocl
agreement, is given by M•ille,' and Brasseur [1995].
From these values, it can be observed that if the 10% accuracy requirement is achieved, measurements of changes in CO and Os total columns, which both have temporal and spatial variabilities exceeding this value, would be allowed. It is not the case for methane,
Table 4. Changes in Total Columns on Spatial and Temporal Scales for the IMAGES Database (Below 50 mbar)
CO CH4 03
Variability Spatial Temporal Spatial Temporal Spatial Temporal
Maximum/minimum
Standard deviation (let)
300 90 10 5 800 200
33.5 22.5 2.5 1.5 49 43
19,008 CLERBAUX ET AL.' REMOTE SENSING OF CO, CH4, AND O3
for which a maximum change of 10% in total content was found. A better 'accuracy than 10% would then be
needed in order to prmride useful measurements for this
species.
4.5. Vertical Mixing Ratio Profile
To create the database, a fixed mean temperature
profile was used for each run, in order to assess the sen-
sitivity of the calculated radiances (in the spectral in- tervals defined above) to the vertical distribution of the
species studied. As expected, we found that radiances are strongly correlated to total column amounts. We
observed, however, that some mixing ratio profiles, cor-
responding to different total column amounts, can pro-
vide similar atmospheric spectra when. taking noise into
account. As an example, Figure 7 shows three selected IMAGES CO mixing ratio profiles, which correspond
to total column
amounts
of 1.78x10
ls, 1.95x10
ls, and
2.24x10¹⁸
molecules/cm
2. The associated
calculated
radiance
spectra in the 2157.8-2158.6
cm
-1 interval,
also plotted in Figure 7, are found to be very close,
as may be checked by considering the differences be-
tween these three radiance spectra which are repre-
sented along with the level of noise. When taking noise into account, it can be seen that a similar signal is ob-
tained for these three profiles and that the information on the shape of the profile is lost. This remains true
when using the other selected intervals for CO. It means
that the sensitivity of the measured radiances on the
change of CO profile in the boundary layer is weak.
We tried to generalize this observation to the entire
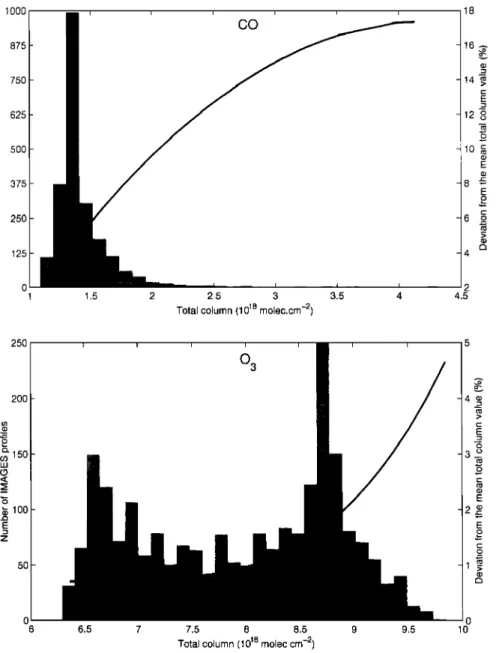
data set. We identified the profiles that provide the same spectra if noise is taken into account. We then calculated the mean value and the standard deviation of the corresponding total column amounts. Figure 8 represents the coefficient of variation (standard devia-
tion/mean value) from a mean total column
value, for
CO and 03. The most important values are observed
for CO, which combines at the same time a high vari-
ability and a high instrumental noise contribution. It
can be observed that the dispersion increases with con-
centration. High values were found for high concentra-
tions, mainly due to the low number of IMAGES data
available, as can be observed on the histogram also rep- resented in Figure 8. For this molecule, half of the 2520
IMAGES profiles have a relative dispersion lower than
21
--,•, ,
\ 20 18 17 16 15 14 13 12 =10 9 8 7 6 5 4 3 2 1 0 0 1 oo 150 Mixing ratio (ppbv) 2.4 2.2 E 1.6 ß E • 1.4 E c 1.2 ._ 1 0.8 0.6 0.4 0.02, ß O.Ol o• -O.Ol
-0.02 i i i noise level / \ / \ / i i i 50 200 250 2157.8 2158 2158.2 2158.4 Wavenumber (cm -1) 2158.6Figure ?.
(left) Selected
CO mixing
ratio profiles.
(right) Associated
calculated
radiances
(0.1 cm
-1 spectral
resolution)
in the 2157.8-2158.6
cm
-1 spectral
range
and differences
between
the three radiance
spectra.
The level
of noise
(2 10
-2 mW/(m 2 cm
-1 sr)) is also
indicated
for
CLERBAUX ET AL' REMOTE SENSING OF CO, CH4, AND O3 19,009 lOOO 875 75O 625 5OO 375 25O 125 co 18 16 14 12 8 6 1.5 2 2.5 3 3.5 4
Total column (1018 molec.cm -2)
2 4,5 25O 2OO u) 150 ¸ '- 100 E 5O -3 -2 -1 6.5 7 7.5 8 8.5 9 9.5
Total column (1018 molec.cm -2)
0 0 6 10 4• ¸ ¸ ._o
Figure
8. Standard
deviation
(in percent)
from
a mean
total
column
value
for CO and
O3
IMAGES profiles which provide similar spectra when noise is included in the simulation, as afunction of the mean total column. An histograrn of the dispersion of the total columns calculated
from the IMAGES profiles (month of July) is also provided.
5%, and 1% of the data exceeds
the required
10% limit
of retrieval accuracy. A similar work has been under- taken on 03, which also has a high variability but a
much lower noise contribution. The results are also rep- resented in Figure 8, and it can be observed that in this case, due to the low noise level and high number of ra- diance channels, the change in vertical profiles leads to errors not exceeding 2% for 90% of the database. Fi- nally, due to it= low geographic variability, this effect is
negligible for methane.
Being a tropospheric model, the IMAGES model pro-
vides mixing ratio profiles limited to 50 hPa (..o21 km). In order to assess the contribution of the upper part
of the profile on the calculated nadir radiances, simula- tions were performed using a fixed tropospheric profile
and the 6 AFGL standard atmospheres for altitudes above 21 km. For all radiance channels belonging to
the selected intervals (see Table 3), we have calculated the relative differences between the radiances associ-
ated with the U.S. 1976 Standard Atmosphere profile and the five other standard profiles. As expected, the most important variations were found for all three com-
pounds for radiances located at the center of the line, or absorption feature, which are more sensitive to the higher levels of the atmosphere. These values remain very low, however, reaching 1.2% for ozone, which ex- hibits a strong increase in mixing ratio above 20 km,
0.7% for CO, which strongly increases above 60 km due
to photodissociation of CO2, and 0.07% for CH4. By comparing these values to uncertainties on radiances
19,010 CLERBAUX ET AL.' REMOTE SENSING OF CO, CH4, AND O3
due to noise (1% for 03, 6% for CO and CH4), it can
be seen that, by using a nadir-viewing instrument, the information on trace gas content for altitudes exceed- ing 20 km is lost into the instrumental noise. At these altitude levels, only ozone induces a detectable contri- bution on the measured spectra.
5. Climatological Profiles
Most of the retrieval algorithms rely on a first-guess profile for initialization of the inversion process. Also, for the retrieval of water vapor and temperature, repre- sentative profiles of trace gases are generally required. Standard model atmospheres, as the commonly used AFGL profiles for mean tropical, midlatitude, and po- lar atmospheres, are often used as a source of profiles to generate spectra representative of a typical air mass. There are two major limitations when using such model atmospheres. First, trace gases with strong emission
sources have distributions with large temporal and spa-
tial variabilities, which generally do not match with a latitudinal air mass representation. Second, these stan-
dard atmospheres do not encompass the full range of
extremes encountered in a real atmosphere in terms of
constituent concentration.
In order to provide mean profiles representative of the spatiotemporM variability of each species, a statis- tical classification has been performed on the IMAGES database to build a reduced climatological database. In
the section 4, ,.v.• concluded tha;t some concentration
profiles could provide similar spectra. For each month
and each constituent. ß a standard statistical method of
classification has been applied to the calculated radi- ances data set to gather vertical mixing ratio profiles
associated with close radiance spectra in the same class.
We used a classical agglomerative hierarchical cluster-
ing method [Anderson, 1958], which maximizes the vari-
ance between the classes using the calculated radiances
as classification parameter. The agglomerative cluster-
ing procedure is stopped when the variance associated
with the classification reaches 90%. A mean concentra-
tion profile is then calculated by averaging all the atmo- spheric profiles of each class. We checked that profiles
which belong to two separated classes have associated
spectra that could at least be distinguished when taking
noise into account.
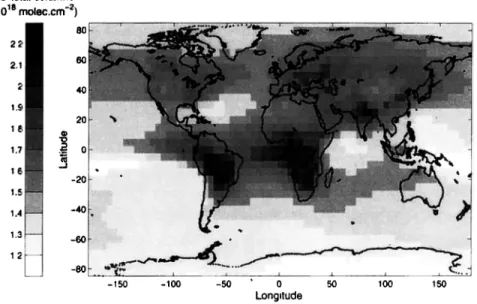
The climatological values profiles derived from the
classification of CO for the month of July are plotted in
Figure 9. These profiles are representative of the main distribution of CO, as can be observed in Figure 10,
which provides (top) the CO total columns calculated from the outputs of IMAGES and (bottom) the result of
the classification. Figure 10 clearly shows that because
of its short lifetime and seasonally varying sources and
sink, the distribution of CO could not be represented in terms of latitude dependent air masses. A similar work has been performed for each month and for the three species. For CO and 03, strong latitudinal vari-
14 -(:•=• 10 6 4 2 [ [ [ ] [ [ profile 1 ... profile 2 ... profile 3 profile 4 , profile 5 60 80 100 120 140 160 180 200 Mixing ratio (ppbv) 220 240 Figure 9. July.
Climatological vertical profiles for CO in
abilities are found with amplitudes varying as a func- tion of time. For CH4, due to its longer lifetime and
thus lower variability, the geographical distribution of
the standard profiles is close to a latitude dependent air
mass classification, except above high emission sources.
We also used our extended profile database to se-
lect a minimum concentration
profile (corresponding
to a geographical
point where
there is no source)
and
a maximum concentration profile (intense sources) for
each species. The profiles associated with the lower and
higher concentrations in terms of total column amounts were chosen. Files with minimum, maximum, and stan-
dard concentration profiles .(along with their geograpb- i. cM distri¬:•tion) are available upon request through anonymous ftp.
6. Conclusions and Discussion
Most of the inversion algorithms presently under de-
velopment for the retrieval of trace gases from nadir
radiances spectra are designed to use selected spectral
intervals and also need a priori profiles for initialization.
In order to meet these requirements, we provide a range of spectral windows for an efficient retrieval of tot al •01-
umn amounts for CO, CH4, and 03 as well as a set of
representative climatological profiles.
The simultaneous retrieval of these three compounds
on a global scale from spectra provided by nadir-viewing instruments will enhance our knowledge and under-
standing of the troposphere. Due to their different
natural variabilities and spectroscopic properties, how-
ever, the retrievable information is very different for CO, CH4, and 03. The sensitivity studies undertaken
here are aimed at studying these differences for an in-
frared nadir-viewing Fourier transform interferometer and providing quantified values using IMG and IASI
CLERBAUX ET AL.' REMOTE SENSING OF CO, CH4, AND Os CO total columns ( 10•8 molec.cm-2) 2.2 2.1 1.9 ß
•?•i•?::::..':: ¾::::::;:;::•i•i::.:' •:• mA•;. •,,• ' •!i'?•;i!iiiii• ?•ii?':•--::J!'!•.!!!'.;; "'. ' •••'••••• '•;. %•"•: • •': •'•'::'•:.; ...
•
•
•'•:-";•:•..""
•'•:: -•.;•:-'•
....
• •.., ' . '<•
-.
• ...
.
....
60 • •*'• • ... ':•?• .,.-• u •'v • '• ,•: ... • ... •',' •:• .• ... • • •.•.?• . .• •, .,:: •. • ... - • 5o - • oo - 5o o 5o • oo • 5o Longitude 19,011 CO profiles 6÷0 o -20 -4o -6o -80 - t 50 - 1 O0 - 50 0 50 1 O0 LongitudeFigure 10. (top) CO total columns
as provided
by the IMAGES model
for July and (bottom)
geographic distribution of the climatological profiles. The label and color associated to eac]-, profile
are those of Figure 9. Profiles corresponding to sea levels exceeding i km were not included in
the classification and are shown in whlte.
6.1. Carbon Monoxide
This study shows that despite its large natural vari- ability, the retrievable information is limited for CO
due to its narrow IR spectral signa. ture with a rela-
tively high associated signal-to-noise ratio. As several
interfering molecules absorb in the same spectral range,
there is only a very limited number of useful channels
for inversion. For the largest concentrations, where the
10% requirement for inversion accuracy may not be ful-
filled, spatial average of successive measurements would
increase the signal-to-noise ratio. The retrievable infor-
mation is restricted to altitudes below 20 km. The use
of standard atmospheres based on latitude air masses is
not recommended for CO.
6.2. Methane
The accuracy to be achieved by inversion procedures
should be lower than the 10% requirement in order to
be able to detect some changes in the methane con- centration using this kind of instrument. Although the available channels of the v3 band are less affected by perturbations due to interfering species than those of
the v4 band, the large contribution
of noise
at this spec-
tral range makes the latter more useful. Standard at-
mospheres based on latitude air masses may be used as
first-guess profiles.
6.3. Ozone
Ozone has a large natural variability. A lot of clean