HAL Id: hal-01889147
https://hal.archives-ouvertes.fr/hal-01889147
Submitted on 8 Oct 2018HAL is a multi-disciplinary open access archive for the deposit and dissemination of sci-entific research documents, whether they are pub-lished or not. The documents may come from teaching and research institutions in France or abroad, or from public or private research centers.
L’archive ouverte pluridisciplinaire HAL, est destinée au dépôt et à la diffusion de documents scientifiques de niveau recherche, publiés ou non, émanant des établissements d’enseignement et de recherche français ou étrangers, des laboratoires publics ou privés.
Protonation of methyluracils in the gas phase: The
particular case of 3-methyluracil
Jean-Yves Salpin, Violette Haldys, Vincent Steinmetz, Emmanuelle Léon,
Manuel Yáñez, M. Merced Montero-Campillo
To cite this version:
Jean-Yves Salpin, Violette Haldys, Vincent Steinmetz, Emmanuelle Léon, Manuel Yáñez, et al.. Proto-nation of methyluracils in the gas phase: The particular case of 3-methyluracil. InterProto-national Journal of Mass Spectrometry, Elsevier, 2018, 429, pp.47 - 55. �10.1016/j.ijms.2017.05.004�. �hal-01889147�
Protonation of Methyluracils in The Gas Phase:
The Particular Case of 3-Methyluracil
Jean-Yves Salpin*1, Violette Haldys1, Vincent Steinmetz2, Emmanuelle Léon1, Manuel Yáñez3, M. Merced Montero-Campillo3
1. LAMBE, CEA, CNRS, Université d’Evry Val d’Essonne, Université Paris-Saclay, F-91025, Evry, France
2. LCP, CNRS, Université Paris-Sud, Université Paris-Saclay, F-91405, Orsay, France 3. Departamento de Química, Módulo 13. Universidad Autónoma de Madrid. Cantoblanco, Campus de Excelencia UAM-CSIC, 28049-Madrid. Spain.
email: jeanyves.salpin@univ-evry.fr
Number of pages (including Tables, Figures, legends and schemes) : 28
Abstract
The gas-phase structure of the protonated isomeric methyl uracils (1-Me-, 3-Me- and 6-Me-) was examined using mid-infrared multiple photon dissociation (IRMPD) spectroscopy performed at CLIO, the Orsay (France) Free Electron Laser facility. Experimental infrared spectra were recorded for protonated species generated by electrospray ionization, isolated and irradiated in a quadrupole ion trap, and compared to calculated infrared absorption spectra of the different low-lying isomers computed at the B3LYP/6-31++G(d,p) level of theory. For both protonated 1-Me-uracil and 6-Me-uracil, the global energy minima correspond to enolic tautomers, whose infrared absorption spectra were found to match very well with the experimental IRMPD spectra. A small fraction of another low energy lying keto tautomer is also present under electrospray conditions. Protonation of 3-Me-uracil by electrospray results exclusively in the formation of a keto form. 3-Me-uracil, which therefore constitutes a particular case in the series of pyrimidine nucleobases studied so far. Methylation of the N3 position of uracil prevents the interconversion between the keto and enol forms, as encountered for uracil, and uracil methylated on N1, C5, or C6. These data also give new insights about the unimolecular reactivity of protonated uracils.
Keywords: IRMPD spectroscopy, photodissociation, protonated Methyluracils, mass spectrometry, DFT calculations.
1. Introduction
Within DNA, the strong hydrogen bonds (HBs) between the canonical forms of purine and pyrimidine nucleobases ensure the structural integrity of the biopolymer, and subsequently the encoding and expression of the genetic information. Thymine, for instance, is found in its canonical structure, a dioxo tautomer, in the Watson-Crick base-pair made with adenine. Besides the formation of canonical AT and GC base pairs, other recognition patterns are possible. Through internal proton transfers, which are correlated to the intrinsic acid-base properties of their electronegative centers, different tautomeric forms of the nucleobases can be formed, leading to the establishment of non-canonical hydrogen bonds. The role of tautomerization in genetic expression has therefore been extensively studied. Some of these studies have determined that the production of these tautomers can lead to mispairs and eventual mutations during nucleic acid replication. [1-4]
Because of the probable relationship between the occurrence of these rare tautomeric forms and point mutations, the evaluation of the tautomeric behaviour of nucleobases and the characterization of their acid-base properties, is of fundamental importance. To address these questions, working in the gas phase is particularly appropriate because it allows one to obtain information on their intrinsic properties by eliminating any influence from solvent and conformational averaging effects. Furthermore, such studies allow for a direct comparison between experimental and theoretical data. Professor Terrance B McMahon has followed this strategy all along his extraordinary career dedicated to the study of the reactivity of gaseous ions, and recently provided new insights about the proton transport within protonated nucleobases, notably catalyzed by ammonia. [5]
Over the past decade, mass spectrometry has been increasingly useful in gas-phase studies of nucleobases, thanks to the combination of two technical developments that have occurred during the last thirty years. The first one is the advent of electrospray ionization, [6] which
allows for facile formation of ions in the gas phase from non-volatile compounds, and greatly simplifies the study of nucleic acid building blocks (from nucleobases to double strands) by mass spectrometry. The second one is the development of structure-sensitive activation techniques, which enables one to obtain direct structural information on gaseous ions. Among those, Infrared Multiple Photon Dissociation spectroscopy (IRMPD) of mass-selected ions, is now established as a very powerful approach to probe the structure of gaseous ions of moderate size, [7-10], and different groups have used IRMPD spectroscopy to study the structure and tautomerization of protonated DNA and RNA building blocks generated by electrospray [11-24]. In our continuing effort to study the structure and unimolecular reactivity of gaseous nucleobases, either protonated [11-13,25,26] or complexed to metals [27-32], the present paper reports the IRMPD study in the fingerprint region between 1000 and 2000 cm-1 of three protonated methyluracils, namely 1-Me, 3-Me and 6-Me-uracil (Scheme 1), generated by electrospray ionization and trapped in a quadrupole ion trap. The study is complemented by DFT and ab-initio electronic structure calculations that provide information regarding the relative stability of the different conformers and their vibrational modes. Several recent theoretical studies have been dedicated to the effect of methylation on tautomeric equilibria of nucleobases.[33-37] Our work shows that 3-Me-uracil constitutes a particular case in the series of pyrimidine nucleobases we have studied so far. Its protonation under electrospray conditions results in the exclusive formation of a protonated keto form, methylation of the N3 position of uracil preventing the interconversion between the keto and enol forms.
<Scheme 1>
2. Experimental and theoretical methods
2.1 Experimental details.
IRMPD spectroscopy experiments have been performed using an experimental platform employing a quadrupole ion trap (Bruker Esquire 3000+) which has been previously described in detail.[38-40] Tunable mid-infrared radiation is produced by the Free Electron Laser (FEL) of CLIO (Centre Laser Infrarouge d'Orsay).[41] This laser is based on a 16-45 MeV linear electron accelerator, whereby bunches of electrons are injected in an undulator, a periodic magnetic field, which is placed in the optical cavity. Using a fixed electron energy, the energy of the emitted photons can be continuously scanned by adjusting the undulator gap. The mean average power was monitored and found to be quite stable (~1200400 mW) over the 9001900 cm-1 energy range scanned using electrons accelerated at 45 MeV.
A conical hole (2.0 mm of diameter) in the ring electrode of the trap was made in order to allow the optical access to the centre of the trap. The IR-FEL beam is mildly focussed using a 1m focal length spherical mirror, and enters the vacuum chamber through a ZnSe window oriented near the Brewster angle. Multistage mass spectrometry was carried out using the standard Bruker Esquire Control (v5.2) software. After mass selection (MS1), mass-selected ions were irradiated with the IR FEL light using the MS2 step, after which the resulting ions
were mass-analyzed. During the MS2 step, the excitation amplitude was set to 0 to avoid any CID-like process. Depending on the nucleobase, an irradiation time ranging from for 300 to 750 ms has been used.
Mass spectra were recorded after 10 accumulations, using the standard mass range (m/z 50-3000) and the normal scan resolution (13000 Th/s), the accumulation time being typically of 10-25 ms, depending on the sample. This sequence was repeated 10 times for each photon energy.
10-4 M aqueous solutions of the nucleobases were prepared in a 1/1 water/methanol mixture (v/v), and were introduced in the source using direct infusion with a syringe pump. Typical ESI conditions were a flow rate of 3 μL/min, capillary spray voltage at –4.0 kV, nebulizer at 14 PSI, drying gas flow at 5 L/min, and drying gas temperature at 200°C.
IRMPD spectra are obtained by plotting the photofragmentation yield R (R = -ln[Iparent/(Iparent
+ ΣIfragment)]), where Iparent and Ifragment are the integrated intensities of the mass peaks of the
precursor and of the fragment ions, respectively) as a function of the frequency of the IR radiation.[42]
2.2 Theoretical calculations.
DFT calculations were carried out using the B3LYP density functional,[43,44] as implemented in the Gaussian 09 set of programs.[45] The different protonated forms considered were first optimized at the B3LYP/6-31++G(d,p) level, without any symmetry constraint. Harmonic vibrational frequencies were calculated at this level to characterize the stationary points as local minima or saddle points, and to estimate the zero-point vibrational energy (ZPE) corrections. The infrared absorption spectra were calculated within the harmonic approximation. It has been previously demonstrated[46,47] that DFT and MP2 methods provide similar geometries for nucleic acid bases. In particular, the hybrid B3LYP
functional has been shown to accurately describe both position and relative intensities of IR bands.[46-49] As far as the positions are concerned, a scaling factor value of 0.96 has been chosen, as in our previous study on protonated uracil and thymine.[11] Finally, to be consistent with the experimental spectral resolution, the calculated spectra have been convoluted by a 15 cm-1 wide large Lorentzian function.
Relative energies for the different conformers were refined by single-point calculations on top of the B3LYP-optimized geometries using a larger 6-311++G(3df,2p) basis set. The reliability of the B3LYP relative energies was assessed by additional single-point M06-2X and MP2(fc)/6-311+G(3df,2p) calculations, and completed by CCSD(T)/6-31++G(d,p) estimates. This set of data is available as a Supporting Information. The non-covalent interactions, which are in part responsible for the relative stabilities of the different tautomers of the species investigated, have been analysed through the use of the NCI approach. This approach takes advantage of the fact that non-covalent interactions are characterized by low-density and low reduced density gradient values, so these weak interaction regions can be located by using gradient isosurfaces, in which a blue-green-red color code one to distinguish between strong attractive non-covalent interactions (blue) and strong repulsive non-covalent interactions (red). Green color denotes very weak interactions (attractive or not) in the van der Waals range. These representations have been created with NCIPLOT (Non-Covalent Interaction Plot). [50,51]
3. Results, discussion
3.1 Overview of the IRMPD experiments
The photo-fragments observed by IRMPD are similar to those obtained by low-energy collision induced dissociation. Each compound exhibits a specific set of photo-fragments. Protonated 1-Methyl-uracil is characterized by elimination of H2O (m/z 109), as well as
only when each nitrogen bears a hydrogen atom, namely with 6-Methyluracil. This is consistent with recent chemical dynamics simulations which suggest that this process proceeds mostly though proton transfer between the two nitrogen atoms. [25] For this compound, the other fragments are associated with elimination of water and 43 mass units [CHNO]. The m/z 70 ion is no longer observed, unlike the case of 3-Methyluracil. This strongly suggests that one of the nitrogen atoms has to be methylated to generate this ion. The most intense photo-fragment observed with 3-Methyluracil is detected at m/z 96 and is specific of this molecule. This ion formally corresponds to elimination of CH3NH2. This result
is in line with previous studies on protonated uracil[25,26,52], which demonstrated, notably by isotopic labelling, that the loss of ammonia involves almost exclusively the N3 centre. The IRMPD spectra of protonated 1-Me-Uracil, 3-Me-Uracil and 6-Me-uracil are given in Figure 1. By examining this Figure, one can clearly observe two different behaviours under IRMPD conditions. On the one hand, protonated 1-Me- and 6-Me-uracils exhibit similar spectra, characterized notably by an overwhelming feature around 1600 wavenumbers, a band around 1480 cm-1, and a small absorption near 1800 cm-1. This IRMPD profile has been already observed for protonated uracil and thymine (5-Me-uracil)[11] and suggests that these four protonated species share structural similarities. On the other hand, the IRMPD spectrum obtained for protonated 3-Me-uracil is markedly different, as attested by the very intense absorptions near 1200 and 1800 cm-1, as well as intense features between 1450 and 1600 cm-1. This finding clearly indicates that the structure of protonated 3-Methyluracil differs from those of both protonated uracil and the other Methyluracils.
The assignment of the IRMPD spectrum of the various compounds is based on the comparison with the spectra computed for the various low energy-lying isomers. As will be discussed in detail in the forthcoming sections, there is a quite good agreement between the IRMPD spectrum and the calculated IR absorption spectrum of the lowest energy isomer of
each protonated nucleobase. For both 1-Me- and 6-Me-uracil, this isomer corresponds to an enolic form, with the exception of the relatively weak IRMPD signal observed at about 1800 cm-1 (Figure 1a and 1c). As shown in our previous studies on uracil and thymine, this particular band is the result of a resonant absorption through the infrared active C=O stretch of a protonated keto form. Considering the strong infrared cross-section associated with the carbonyl group, this weak signal tends to suggest a minor contribution of a keto form for both systems. By contrast, the C=O stretching mode results in a very intense absorption for 3-Methyluracil, pointing to the prominent formation of a keto form (vide infra) for this ion.
3.2 DFT study of protonated methyluracils
Figure 2 gathers the four most stable protonated forms for 1-Me and 6-Me protonated uracils, whereas for the 3-Me structure the three most stable forms plus a fourth one selected for the sake of comparison are shown. Energetics and structure of all the protonated forms optimized in this study are provided in sections S1-3 of the Supporting Information, along with the labelling for the different isomers.
As can be observed in Figure 2, similar results are obtained for protonated 1-Me- and 6-Me-uracil. The corresponding global minima correspond to dienolic forms, namely 1Me2_ha and
6MeU2_ha, respectively. These results are also comparable to those obtained during previous
theoretical studies regarding protonated uracil[11,53,54] which, regardless of the method of calculation (ab initio or DFT), describe the enolic structure as the most stable one. For both systems, the second most stable structure is the O8-protonated keto form (1Me1_hd and
6MeU1_hd). The third most stable form (the XMeU1_hc rotamers) lie 12 kJ/mol above the
global minimum. One can notice that the energy difference between the most stable structures is small (about 1 kJ/mol) and reduced with respect to protonated uracil. A detailed study of protonated cytosine by Tureček and co-workers demonstrated that use of diffuse functions
and extended basis sets was essential to accurately evaluate the relative energies between the various protonated forms.[55] All calculations at the different levels of theory (see Section 2.2) confirmed that the XMeU2_ha structures are systematically more stable than the
XMeU1_hd structures. In particular, the CCSD(T)/6-31++G(d,p) calculations provide an
energy gap even more pronounced than DFT and MP2, with an estimated value of 8.4 kJ/mol.
DFT calculations point out a different situation for protonated 3-Me-uracil. For this system, the global minimum corresponds to the keto form 3MeU1_hd. The 3MeU1_hc rotamer is slightly less stable. More importantly, dienolic forms appear strongly destabilized with respect to 1-Me-and 6-Me-uracil. Whereas 1MeU2_ha and 6MeU2_ha forms are the global minima of the PES, the 3MeU2_ha form, is 90.2 kJ/mol less stable than the global minimum. This large destabilization is due to the replacement of the attractive electrostatic interactions between the positively charged hydroxyl hydrogen atoms and the N lone-pair that are present in the dienolic 1MeU2_ha and 6MeU2_ha forms, to repulsive interactions in 3MeU2-ha between the aforementioned hydroxyl hydrogen atoms and the hydrogens of the methyl group (see Scheme 2, Figure S4 and text therein).
Scheme 2
Note that even the most stable enolic form (3MeU2b_hb) characterized by the two hydroxyl hydrogens pointing away from the methyl group is already high in energy (+29.5 kJ/mol). Hence, whereas in the previously described 1-Me and 6-Me forms the stability is governed by the subtle balance between the acidity properties of the different protonation sites (N, O), the presence of the Me group completely modifies this balance.
Scheme 2 also shows why structure hb is a high-lying local minimum for 1-Me and 6-Me isomers, because of the repulsive interactions between the oxygens lone-pairs and the N3 lone-pair, whereas the analogous structure for 3-Me-uracil is a low-lying minimum stabilized by the interactions of the oxygen lone-pairs with the positively charged atoms of the methyl group (see Figure S5). The system is further stabilized through a OH···N1 interaction. The acidity of this hydroxyl group at position C2 in structure hb is enhanced by the fact that it is acting as a proton acceptor with respect to the neighbouring CH3 group. Accordingly, the
tautomeric enolization from 3MeU1_hd and 3MeU1_hc to 3MeU2b_hb is clearly
"ha"
disfavoured because the carbonyl group at C2, in the first two tautomers, is already acting as a HB acceptor with respect to one of the H atoms of the methyl group.
Finally, protonation onto C5 (XMeU1_he) and C6 centers (XMeU1_hf) have also been considered. The resulting structures are also very high in energy. Note that 3MeU1_hf and
6MeU1_hf do not correspond to minima on the potential energy surface. In conclusion, both
IRMPD experiments and DFT calculations clearly indicate the peculiarity of 3-Methyluracil with respect to both uracil and other methylated (1-Me, 5-Me and 6-Me) derivatives.
3.3 IRMPD spectra of protonated 1-Me- and 6-Meuracil
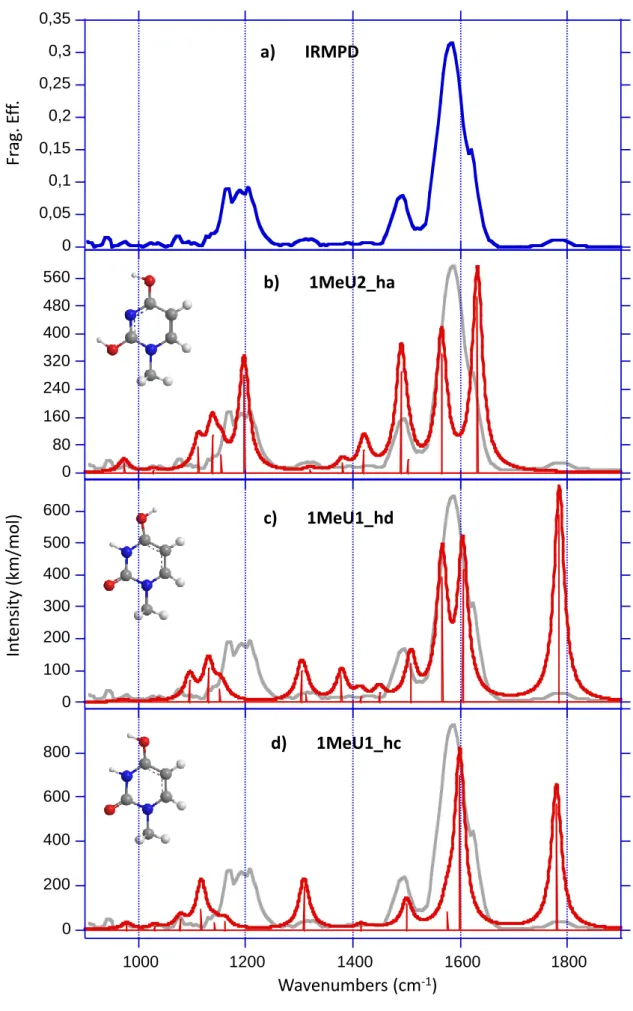
The experimental IRMPD spectrum of protonated 1-Methyluracil is given in Figure 3a. This spectrum is dominated by a broad band (fwhm~70 cm-1) centred at 1590 cm-1. This band displays an asymmetric profile with a maximum at 1580 cm-1 and a shoulder at 1620 cm-1. This suggests that this signal probably corresponds to the convolution of two strongly active IR modes. Two other intense signals are detected, namely a band at c.a. 1490 cm-1, and a broad feature centred around 1190 wavenumbers. Finally, two relatively weak bands are also detected around 1320 and 1785 cm-1.
All the IRMPD bands (except for the signal detected at 1785 cm-1) can be assigned by considering the IR active modes of the 1MeU2_ha structure, which are summarized in Table 1. The asymmetric profile of the large signal centred at 1590 cm-1 can be ascribed to two intense computed modes at 1566 cm-1 and 1631 cm-1, associated to the C4-C5 stretch and the combined stretches of C5-C6 and C2-N3 bonds, respectively. The former is only slightly red-shifted as compared to the strong IR absorption detected at 1580 cm-1, while the latter is in good agreement with the shoulder observed experimentally at the blue side of the band (1620 cm-1). The intense band detected at 1490 cm-1 can be attributed to the CO stretch of both C2O7 and C4O8 bonds, while the weak feature detected at 1317 cm-1 may be assigned to the
bending modes of the vinylic hydrogens. Finally, two computed modes can account for the broad feature detected around 1200 cm-1, and correspond to various bending modes of the two hydroxyl groups. This experimental signal appears to be characteristic of the presence of enolic tautomers as it cannot be reproduced by the 1Me1_hd and 1Me1_hc keto forms (Figures 3c-d).
The computed spectrum for the global minimum 1MeU2_ha cannot account, however, for the small signal observed experimentally at 1785 cm-1. This signal (position, intensity) has already been observed for protonated uracil and thymine,[11,12] as well as for protonated uridine [21] and thymidine,[23] and results from a resonant absorption through an active C=O stretch. This IR mode is characteristic of the presence of an oxo protonated form, as attested by the agreement observed with the computed C=O stretch of oxo forms such as 1MeU1_hd (Figure 3c) and 1MeU1_hc (Figure 3d). Note that the computed spectrum of 1MeU1_hd, and to a lesser extent that of 1MeU1_hc, can also account for the experimental bands detected a 1621, 1590 and 1317 cm-1. Consequently, as for protonated uracil and thymine, the experimental IRMPD spectrum suggests the presence of two tautomeric forms of protonated 1Me-uracil.
Given the multiple photon character of the IRMPD process, the relative IRMPD band intensities should be taken with caution, and rigorous estimates of the relative proportions of each protonated form cannot be made on the sole basis of the experimental spectra. However, the calculated infrared cross section of the 1MeU1_hd isomer at 1779 cm-1 is very large and at least as large as the IR modes around it. As a result, given the fact that the residual laser power at 1800 cm-1 was still significant (~500 mW), if the 1MeU1_hd oxo isomer would be selectively formed, one would expect a stronger IRMPD signal at 1780 cm-1, i.e. of similar order of magnitude as those detected ~1600 cm-1, as for 3-Me-uracil. Consequently, we may reasonably conclude that the most abundant tautomer generated under our experimental
conditions corresponds to the enolic structure. A similar conclusion can be drawn for protonated 6-Me-uracil and will not be discussed in detail. As already mentioned (Figure 2), the IRMPD spectrum obtained for protonated 6-Me-uracil and 1-Me-uracil share the same characteristics. Comparison with computed spectra for 6MeU2_ha, 6Me1_hd and 6Me1_hc is provided in the Supporting Information.
These data globally suggest that under electrospray conditions, tautomerization of either the neutral or protonated forms of these molecules occur in order to account for the formation of dienolic tautomers of the protonated species. The results obtained for uracil support this assumption. For neutral uracil, it has been shown that the presence of one or several molecules of water considerably lowers the activation barrier associated with tautomerization.[11,56] The same has been found for protonated uracil, the tautomerization towards enolic forms being greatly facilitated by the presence of protic solvents like ammonia[5] or water.[12] Finally, it is also worth noting that activation of the ions by sequential absorption of IRMPD photons may promote the isomerization of the enolic forms prior to dissociation. Our recent chemical dynamic simulation study of the collision induced dissociation of protonated uracil[25] demonstrated that the enolic form of protonated uracil, strictly similar to 1MeU2_ha and 6-MeU2_ha, is totally unreactive upon CID activation, and that interconversion towards more reactive protonated forms has to take place to explain the CID fragments observed experimentally.
3.4 IRMPD spectra of protonated 3-Me-uracil
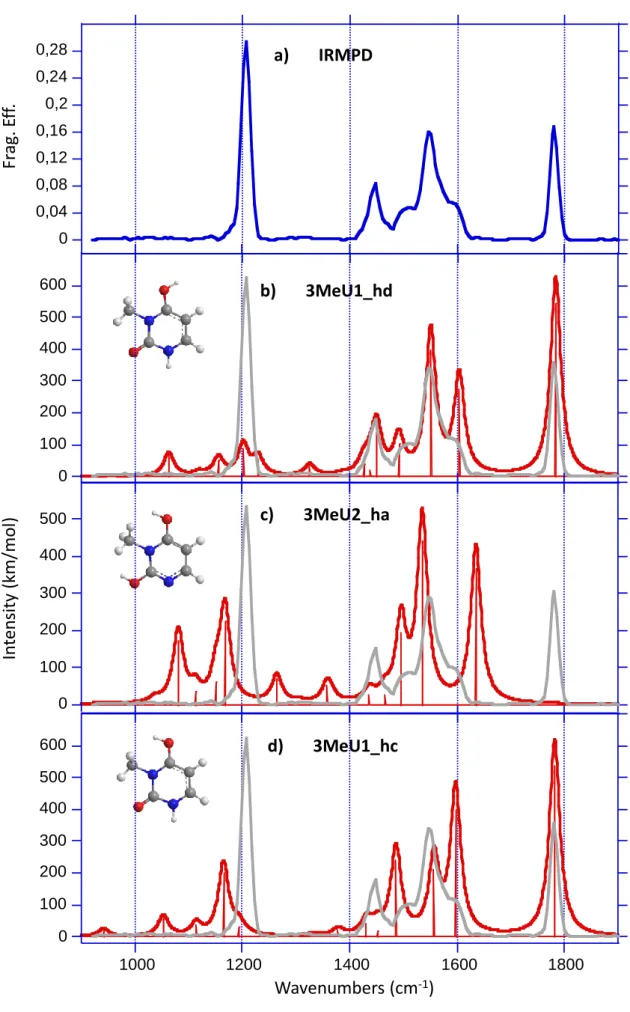
Figure 4 compares the experimental IRMPD spectrum of protonated 3-Me-uracil (Figure 4a) to the computed vibrational spectrum of the two most stable optimized keto forms, and of the
3MeU2_ha structure (Figure 4b-d). The experimental IRMPD spectrum is strikingly different
different structure. In spite of the decrease in the FEL power above 1700 cm-1, one can observe a particularly intense signal around 1780 cm-1, which contrasts markedly with the weak feature observed for the two other nucleobases. The IRMPD spectrum is also characterized by a sharp signal at 1206 cm-1. The IRMPD signature between 1450 and 1600 wavenumbers also differs significantly from what was measured for uracil, 1-Me-uracil, 6-Me-uracil and thymine. Comparison of Figure 4a and 4b shows an excellent agreement between the experimental trace and the DFT-computed vibrational spectra of the calculated global minimum, namely 3MeU1_hd. Assignment of all the IRMPD can be achieved by considering the IR active modes of 3MeU1_hd (Table 2). The experimental band at 1780 cm
-1
can be attributed to the strongly active C2=O7 carbonyl stretch. The signal detected at 1206 cm-1 can result from the superposition of two IR modes close in energy (1202 and 1230 cm-1), corresponding to the combination of CH and NH bending modes, and the bending of the hydroxyl group, respectively. Finally, the shape of the IRMPD spectrum between 1440 and 1600 cm-1 is also in very good agreement with the infrared cross section of 3MeU1_hd isomer. This feature can be decomposed in four distinct signals at 1446, 1510, 1546 and 1597 cm-1 which can be ascribed to CH (1439 cm-1) and NH (1450 cm-1) bending modes, the C4O8 (1492 cm-1), C4C5 (1551 cm-1) and C5C6 (1597 cm-1) stretching modes, respectively. The rotamer 3MeU1_hc can also reproduce some of the signals detected experimentally but the agreement with experiment is much better for 3MeU1_hd, which is consistent with the lower stability of the 3MeU1_hc form as discussed above. Finally, one can see (Figure 4c) that the enolic form 3MeU2_ha, whose structure is similar to that observed for 1-Me- and 6-Me-uracil, can be reasonably precluded. This is again consistent with the expected low stability of this form as we have discussed above. The same applies to form 3MeU2b_hb (Figure 2), which lies 29.5 kJ/mol above the global minimum, and whose calculated normal modes do not match the experimental trace. Consequently, one can conclude from this set of data that
the protonation of 3-Me-uracil under electrospray conditions results exclusively in the formation of a keto form, which according to our computational survey should correspond to the 3MeU1_hd structure.
Methylation of uracil onto the N3 atom therefore prevents the tautomerization process. The presence of the methyl group on N3 avoids the attractive stabilization between the nitrogen lone pairs and positively-charged hydrogens from the neighboring hydroxyl groups. Furthermore, this finding is consistent with the solvent-assisted mechanism as proposed in different studies, accounting for the interconversion of the keto form into an enolic form[5,12], which presently cannot occur due the presence of this methyl group. By contrast, the proposed mechanism is possible for the other uracil compounds.
Conclusion
Comparison of the present results with those deduced from previous studies demonstrates that 3-Me-uracil constitutes a particular case in the series of pyrimidic nucleobases we have studied so far. On the one hand, its protonation under electrospray conditions results in the formation of a protonated keto form. On the other hand, the most abundant structure generated under electrospray conditions for cytosine, uracil, 1-Me-uracil, 5-methyluracil (thymine) and 6-Me-uracil corresponds to an enolic form, a minor proportion of a keto form being also evidenced. This study also shows that the free C=O stretching mode of protonated nucleobases can be particularly intense under IRMPD conditions. These new data give further support to the interpretation provided in our previous work and are consistent with the solvent-assisted mechanism proposed to explain the tautomerization of nucleobases under electrospray conditions.
Acknowledgements
The authors wish to thank the CLIO team (J. M. Ortega, C. Six, G. Perilhous, J. P. Berthet) as well as P. Maître for their support during the experiments. This work has been also partially supported by the Projects No. CTQ2012-35513-C02-01 and CTQ2013-43698-P (Ministerio de Economía y Competitividad of Spain), by the STSM COST Action CM1204, the Project FOTOCARBON-CM S2013/MIT-2841 (Comunidad Autónoma de Madrid, Spain), the “Fonds pour le Rayonnement de la Recherche (FRR, Université d’Evry Val d’Essonne) A generous allocation of computing time at the Centro de Computación Científica of the Universidad Autónoma de Madrid is also acknowledged. Finally, last but not least, we would like to warmly thank Professor Terrance B. McMahon for all the nice moments and discussions we shared during the last twenty years.
Supporting information
Structures and energetics of the different optimized structures are provided as Supporting Information, together with IRMPD and computed IR absorption spectra for protonated 6-Me-uracil.
Bibliography
[1] P.O. Lowdin. Rev. Mod. Phys. 35 (1963) 724.
[2] M.D. Topal, J.R. Fresco. Nature 263 (1976) 285.
[3] H. Ruterjans, E. Kaun, W.E. Hull, H.H. Limbach. Nucleic Acids Research 10 (1982)
7027.
[4] L.C. Sowers, G.V. Fazakerley, R. Eritja, B.E. Kaplan, M.F. Goodman. Proc. Nat. Acad. Sci. USA 83 (1986) 5434.
[5] R. Wu, T.B. McMahon. J. Am. Chem. Soc. 129 (2007) 569.
[6] J.B. Fenn, M. Mann, C.K. Meng, S.F. Wong, C.M. Whitehouse. Science 246 (1989) 64.
[7] L. MacAleese, P. Maître. Mass Spectrom. Rev. 26 (2007) 583. [8] J.S. Brodbelt, J.J. Wilson. Mass Spectrom. Rev. 28 (2009) 390. [9] J.R. Eyler. Mass Spectrom. Rev. 28 (2009) 448.
[10] T.D. Fridgen. Mass Spectrom. Rev. 28 (2009) 586.
[11] J.-Y. Salpin, S. Guillaumont, J. Tortajada, L. MacAleese, J. Lemaire, P. Maitre. ChemPhysChem 8 (2007) 2235.
[12] J.M. Bakker, R.K. Sinha, T. Besson, M. Brugnara, P. Tosi, J.-Y. Salpin, P. Maitre. J. Phys. Chem. A 112 (2008) 12393.
[13] J.M. Bakker, J.-Y. Salpin, P. Maitre. Int. J. Mass Spectrom. 283 (2009) 214.
[14] Y.W. Nei, T.E. Akinyemi, J.D. Steill, J. Oomens, M.T. Rodgers. Int. J. Mass Spectrom. 297 (2010) 139.
[15] J. Oomens, A.R. Moehlig, T.H. Morton. J. Phys. Chem. Lett. 1 (2010) 2891.
[16] A. Filippi, C. Fraschetti, F. Rondino, S. Piccirillo, V. Steinmetz, L. Guidoni, M. Speranza. Int. J. Mass Spectrom. 354 (2013) 54.
[17] H.U. Ung, A.R. Moehlig, R.A. Kudla, L.J. Mueller, J. Oomens, G. Berden, T.H. Morton. Phys. Chem. Chem. Phys. 15 (2013) 19001.
[18] B. Yang, R.R. Wu, G. Berden, J. Oomens, M.T. Rodgers. J. Phys. Chem. B 117 (2013) 14191.
[19] B.E. Ziegler, R.A. Marta, M.B. Burt, S.M. Martens, J.K. Martens, T.B. McMahon. J. Am. Soc. Mass Spectrom. 25 (2014) 176.
[20] R.R. Wu, B. Yang, C.E. Frieler, G. Berden, J. Oomens, M.T. Rodgers. J. Phys. Chem. B 119 (2015) 5773.
[21] R.R. Wu, B. Yang, C.E. Frieler, G. Berden, J. Oomens, M.T. Rodgers. Phys. Chem. Chem. Phys. 17 (2015) 25978.
[22] H.U. Ung, K.T. Huynh, J.C. Poutsma, J. Oomens, G. Berden, T.H. Morton. Int. J. Mass Spectrom. 378 (2015) 294.
[23] J.-Y. Salpin, D. Scuderi. Rapid Commun. Mass Spectrom. 29 (2015) 1898.
[24] R.R. Wu, B. Yang, C.E. Frieler, G. Berden, J. Oomens, M.T. Rodgers. J. Am. Soc. Mass Spectrom. 27 (2016) 410.
[25] E.R. Molina, D. Ortiz, J.-Y. Salpin, R. Spezia. J. Mass Spectrom. 50 (2015) 1340. [26] E.R. Molina, J.-Y. Salpin, R. Spezia, E. Martinez-Nunez. Phys. Chem. Chem. Phys. 18
(2016) 14980.
[27] S. Guillaumont, J. Tortajada, J.-Y. Salpin, A.M. Lamsabhi. Int. J. Mass Spectrom. 243 (2005) 279.
[28] A.M. Lamsabhi, M. Alcamí, O. Mó, M. Yáñez, J. Tortajada, J.-Y. Salpin. ChemPhysChem 8 (2007) 181.
[29] J.-Y. Salpin, S. Guillaumont, J. Tortajada, A.M. Lamsabhi. J. Am. Soc. Mass Spectrom. 20 (2009) 359.
[30] C. Trujillo, A. Lamsabhi, O. Mo, M. Yanez, J.-Y. Salpin. Int. J. Mass Spectrom. 306 (2011) 27.
[31] J.-Y. Salpin, V. Haldys, S. Guillaumont, J. Tortajada, M. Hurtado, A.M. Lamsabhi. ChemPhysChem 15 (2014) 2959.
[32] B. Power, V. Haldys, J.-Y. Salpin, T.D. Fridgen. J. Mass Spectrom. 51 (2016) 236. [33] J.R. Sambrano, A.R. de Souza, J.J. Queralt, J. Andres. Chem. Phys. Lett. 317 (2000)
437.
[34] J.R. Sambrano, A.R. de Souza, J.J. Queralt, M. Olive, J. Andres. Chem. Phys. 264 (2001) 333.
[35] H. Yekeler. Journal of Molecular Structure-Theochem 713 (2005) 201.
[36] G.K. Forde, A.E. Forde, G. Hill, A. Ford, A. Nazario, J. Leszczynski. J. Phys. Chem. B 110 (2006) 15564.
[37] T.L.P. Galvao, M. da Silva, M. da Silva. J. Phys. Chem. A 118 (2014) 4816.
[38] B. Chiavarino, M.E. Crestoni, S. Fornarini, J. Lemaire, P. Maitre, L. MacAleese. J. Am. Chem. Soc. 128 (2006) 12553.
[39] L. MacAleese, A. Simon, T.B. McMahon, J.M. Ortega, D. Scuderi, J. Lemaire, P. Maitre. Int. J. Mass Spectrom. 249 (2006) 14.
[40] A. Simon, L. MacAleese, P. Maitre, J. Lemaire, T.B. McMahon. J. Am. Chem. Soc. 129 (2007) 2829.
[41] R. Prazeres, F. Glotin, C. Insa, D.A. Jaroszynski, J.M. Ortega. Eur. Phys. J. D 3 (1998) 87.
[42] J. Lemaire, P. Boissel, M. Heninger, G. Mauclaire, G. Bellec, H. Mestdagh, A. Simon, S. Le Caer, J.M. Ortega, F. Glotin, P. Maitre. Phys. Rev. Lett. 89 (2002) 273002.
[43] C. Lee, W. Yang, R. Parr. Phys. Rev. B: Condens. Matter 37 (1988) 785. [44] A.D. Becke. J. Chem. Phys. 98 (1993) 5648.
[45] M.J. Frisch, e. al. Gaussian09, Revision C.01. See Supporting Information for complete citation.
[46] M.P. Gaigeot, N. Leulliot, M. Ghomi, H. Jobic, C. Coulombeau, O. Bouloussa. Chem. Phys. 261 (2000) 217.
[47] A. Hocquet, N. Leulliot, M. Ghomi. J. Phys. Chem. B 104 (2000) 4560. [48] M.D. Halls, H.B. Schlegel. J. Chem. Phys. 109 (1998) 10587.
[49] M.D. Halls, J. Velkovski, H.B. Schlegel. Theor. Chem. Acc. 105 (2001) 413.
[50] J. Contreras-Garcia, E.R. Johnson, S. Keinan, R. Chaudret, J.P. Piquemal, D.N. Beratan, W.T. Yang. J. Chem. Theor. Comput. 7 (2011) 625.
[51] P. Dem'yanov, P. Polestshuk. Chem. Eur. J. 18 (2012) 4982.
[52] C.C. Nelson, J.A. McCloskey. J. Am. Soc. Mass Spectrom. 5 (1994) 339. [53] J.K. Wolken, F. Turecek. J. Am. Soc. Mass Spectrom. 11 (2000) 1065.
[54] E.S. Kryachko, M.T. Nguyen, T. Zeegers-Huyskens. J. Phys. Chem. A 105 (2001) 1288.
[55] J.K. Wolken, C. Yao, F. Turecek, M.J. Polce, C. Wesdemiotis. Int. J. Mass Spectrom. 267 (2007) 30.
Schemes, Tables and Figures captions
Scheme 1: Most stable calculated neutral tautomers of 1-Me, 3-Me and 6-Me uracil. Scheme 2: Interactions that contribute to the stabilization and destabilization of conformers ha and hb of 1MeU2_ha and 6MeU2_ha and 3MeU2-ha systems.
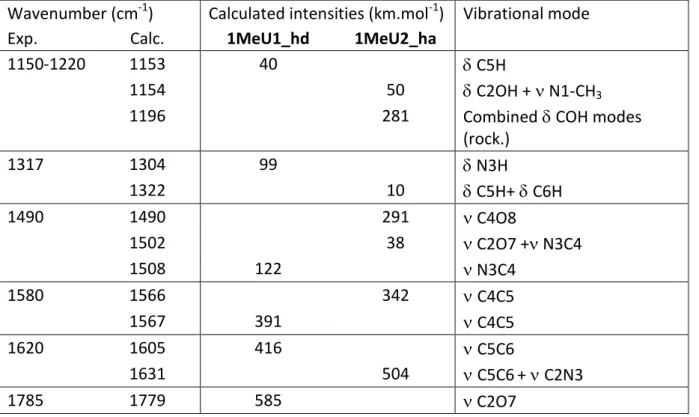
Table 1: Experimental IRMPD spectrum of protonated 1-Methyluracil compared with
computed vibrational modes for the 1MeU1_hd and 1MeU2_ha structures
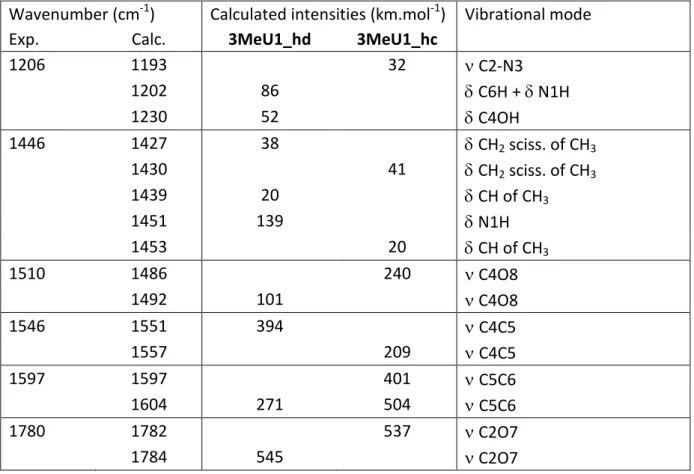
Table 2: Experimental IRMPD spectrum of protonated 3-Methyluracil compared with
computed vibrational modes for the 3MeU1_hd and 3MeU1_hc structures
Figure 1: Experimental IRMPD spectra recorded for (a) 1-Methyluracil, (b) 3-Methyluracil
and (c) 6-Methyluracil.
Figure 2: Structure and B3LYP/6-311++G(3df,2p)+ZPE relative energies (kJ/mol) of the
lowest energy structures obtained of protonated 1-Me-, 3-Me- and 6-Me-uracil . See Sections S-1-3 of the Supporting information for a complete survey of the various structures considered.
Figure 3: IRMPD spectrum of protonated 1-Methyluracil. DFT calculated IR absorption
spectra of the 1MeU2_ha (b), 1MeU1_hd (c) and 1MeU1_hc (d) isomers compared to the experimental IRMPD spectrum (a) recorded with an irradiation time of 300 ms
Figure 4: IRMPD spectrum of protonated 3-Methyluracil. DFT calculated IR absorption
spectra of the 3MeU1_hd (b), 3MeU2_ha (c) and 3MeU1_hc (d) isomers compared to the experimental IRMPD spectrum (a) recorded with an irradiation time of 750 ms
Table of content IRMPD 0 100 200 300 400 500 600 DFT
Figure 1 0 0,05 0,1 0,15 0,2 0,25 0,3 0,35 0 0,04 0,08 0,12 0,16 0,2 0,24 0,28
c) 6Me-U
b) 3Me-U
a) 1Me-U
0 0.5 1 1.5 2 Fr ag . E ff . 1000 1200 1400 1600 1800 Wavenumbers (cm-1)Figure 3 0 0,05 0,1 0,15 0,2 0,25 0,3 0,35 1000 1200 1400 1600 1800 d) 1MeU1_hc c) 1MeU1_hd b) 1MeU2_ha a) IRMPD 0 200 400 600 800 0 80 160 240 320 400 480 560 0 100 200 300 400 500 600 Wavenumbers (cm-1) In ten sity (km /m ol ) Fr ag . E ff .
Figure 4 1000 1200 1400 1600 1800 d) 3MeU1_hc b) 3MeU1_hd a) IRMPD 0 100 200 300 400 500 600 0 100 200 300 400 500 600 0 0,04 0,08 0,12 0,16 0,2 0,24 0,28 c) 3MeU2_ha 0 100 200 300 400 500 Wavenumbers (cm-1) In ten sity (km /m ol ) Fr ag . E ff .
Table 1: Experimental IRMPD spectrum of protonated 1-Methyluracil compared with
computed vibrational modes for the 1MeU1_hd and 1MeU2_ha structures Wavenumber (cm-1) Calculated intensities (km.mol-1) Vibrational mode
Exp. Calc. 1MeU1_hd 1MeU2_ha
1150-1220 1153 40 C5H
1154 50 C2OH + N1-CH3
1196 281 CombinedCOH modes
(rock.) 1317 1304 99 N3H 1322 10 C5H+ C6H 1490 1490 291 C4O8 1502 38 C2O7 + N3C4 1508 122 N3C4 1580 1566 342 C4C5 1567 391 C4C5 1620 1605 416 C5C6 1631 504 C5C6+ C2N3 1785 1779 585 C2O7
Table 2: Experimental IRMPD spectrum of protonated 3-Methyluracil compared with
computed vibrational modes for the 3MeU1_hd and 3MeU1_hc structures Wavenumber (cm-1) Calculated intensities (km.mol-1) Vibrational mode
Exp. Calc. 3MeU1_hd 3MeU1_hc
1206 1193 32 C2-N3 1202 86 C6H + N1H 1230 52 C4OH 1446 1427 38 CH2 sciss. of CH3 1430 41 CH2 sciss. of CH3 1439 20 CH of CH3 1451 139 N1H 1453 20 CH of CH3 1510 1486 240 C4O8 1492 101 C4O8 1546 1551 394 C4C5 1557 209 C4C5 1597 1597 401 C5C6 1604 271 504 C5C6 1780 1782 537 C2O7 1784 545 C2O7