Carbon sequestration in leaky reservoirs
Texte intégral
Figure
Documents relatifs
TAUX DE FILTRATION DU ROTIFÈRE BRACHIONUS CALYCIFLORUS : LAISON DES MÉTHODES DE MESURE; INFLUENCE DE L’AGE Filtration rate in the rotifer Brachionus calyciflorus : comparison of
We first realized a state of the art of regional carbon storage potentials to propose updated and new data in the model, and particularly, we add a new distribution between onshore
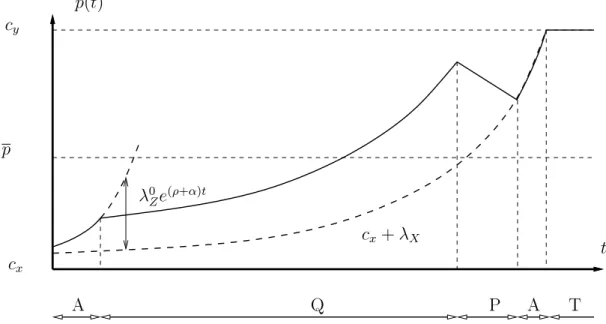
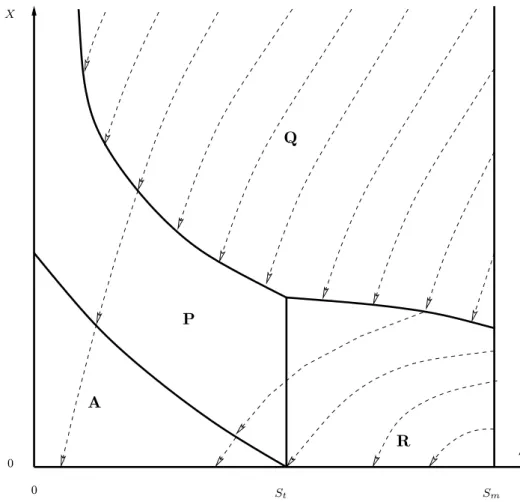
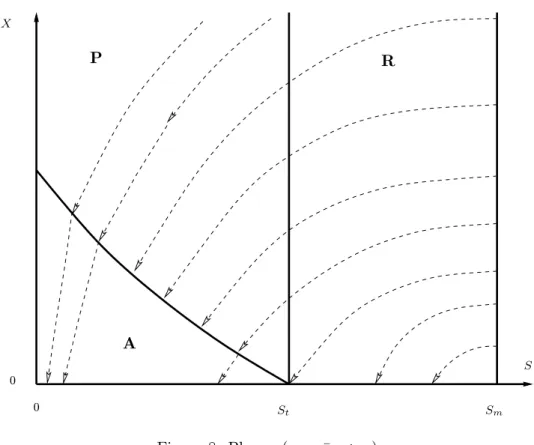
The fact that final phases can be identified opens the way to a finite-horizon approach to determine the optimal trajectories. From initial points located on the boundary , the
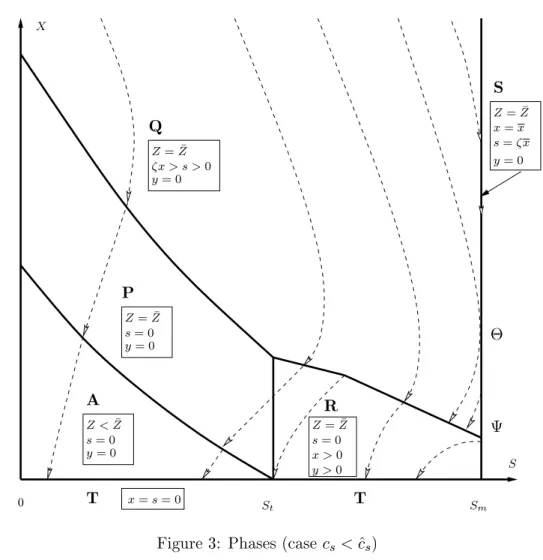
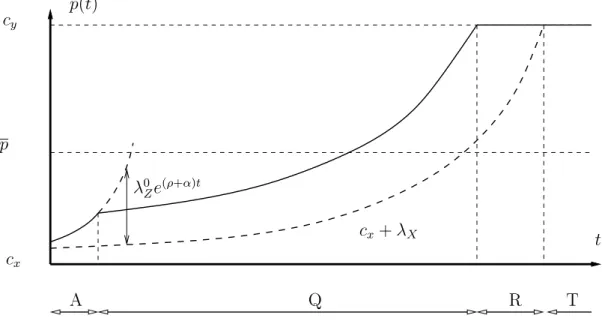
We name the rst situation Phase A: it is characterized by the absence of constraints on the state, zero capture and exclusive consumption of nonrenewable energy.. We name the
Distributions of source current density for three and fi ve connected holes at di ff erent locations (physical experiments). The small black open curves denote the locations of leak.
The twofold coordinated atoms belonging to the finite linear chain interact moderately with the metallic surface (in the 1.0 eV/atom range), while we observe that end of chain,
Reference source not found.8. An example of the effective CO 2 storage capacity calculations using the most likely values from Table 2 is shown in Table 3. Considering the
