HAL Id: hal-00137882
https://hal.archives-ouvertes.fr/hal-00137882
Submitted on 22 Mar 2007HAL is a multi-disciplinary open access
archive for the deposit and dissemination of sci-entific research documents, whether they are pub-lished or not. The documents may come from teaching and research institutions in France or abroad, or from public or private research centers.
L’archive ouverte pluridisciplinaire HAL, est destinée au dépôt et à la diffusion de documents scientifiques de niveau recherche, publiés ou non, émanant des établissements d’enseignement et de recherche français ou étrangers, des laboratoires publics ou privés.
193nm immersion lithography studies with a double
grating high NA achromatic interferometer
Anne-Laure Charley, Philippe Bandelier, Bénédicte Mortini, Alexandre
Lagrange, Olivier Lartigue, Patrick Schiavone
To cite this version:
Anne-Laure Charley, Philippe Bandelier, Bénédicte Mortini, Alexandre Lagrange, Olivier Lartigue, et al.. 193nm immersion lithography studies with a double grating high NA achromatic interferometer. 2005, pp.1111. �hal-00137882�
193nm immersion lithography studies
with a double grating high NA achromatic interferometer
A.L. Charley1,3, P. Bandelier2, B. Mortini1, A. Lagrange2, O. Lartigue2, P. Schiavone3
1
STMicroelectronics, 850 rue Jean Monnet, FR-38921 Crolles, CEDEX France Corresponding author: [email protected]
Corresponding address: Laboratoire des Technologies de la Microélectronique c/o CEA Grenoble, 17, avenue des martyrs, 38054 GRENOBLE Cedex, France
Fax : +00334 38 78 58 92 Tel: +00334 38 78 64 40
2
CEA/LETI, 17 rue des martyrs, 38054 Grenoble cedex, France
3
CNRS/LTM c/o CEA Grenoble, 17 rue des martyrs, 38054 Grenoble cedex, France
1. Introduction
As immersion lithography will be the lithography technique for sub-65nm generation device fabrication, benefits and drawbacks of the introduction of an immersion fluid between the imaging optics and the wafer have to be studied. In this context, it is of high interest to be able to understand the properties of hyper high NA imaging and to do so, to have access to a technique which can mimic an industrial immersion stepper by having the possibility to tune the polarization state and numerical aperture. Interferometric lithography has proven to be a useful method to study projection imaging at high numerical aperture (NA). It has been shown to help addressing several issues of immersion lithography such as polarization state impact on imaging, photoresists material screening as well as preliminary defectivity considerations due to the introduction of water and high index fluid studies [1, 2, 3]. In the frame of this work, a home-built interferometer with immersion lithography capabilities has been fully designed and mounted in our facilities. Specific designs have been made in order to reach NAs as high as 1.4. All issues preventing the printing of high-contrasted lines over a large area, such as laser beam uniformity and vibrations control have been addressed and 40-nm-half-pitch resist lines can be currently printedwith water immersion lithography. As a result, the interferometer has been used to screen resist and topcoat candidates for immersion lithography before their introduction in a production environment. An overview of our results is presented, focusing on the topcoat/resist compatibility.
Besides, in order to prepare hyper NA lithography, We have implemented a simulation model which can be used to predict the light distribution inside a photolithographic stack. This model enables us to predict the resist image created by the interference of two coherent beams in the photo-resist volume. Simulations of polarization effects at oblique angles will be presented as well as the evaluation of image contrast in both TE and TM polarization. The contrast in TM polarization is dropping with increasing NA. Finally, we validate those predictions by experiments on our interferometer.
2. Experimental setup
The apparatus is based on the interfering beams which are created by illuminating a first diffraction grating followed by a second diffraction grating recombining the diffracted beams on the photo-resist plane (see figure 1).
Fig. 1: Schematic of the immersion achromatic interferometric configuration and diagram of diffraction angles, materials refractive index and gratings pitches.
A two grating interferometer of this type had been previously built by MIT researchers for dry lithography [4, 5, 6] and it has been adapted to immersion interferometric lithography. The setup have been designed and simulations have been performed in order to optimize the grating diffraction efficiency as a function of the etch depth and the fractional linewidth [7]. After calculations, the numerical aperture can be expressed as eq. (1) :
Q
NA=
λ
(1)where λ is the wavelength and Q is an equivalent diffraction grating pitch defined by eq.(2).
1 2 1 2 1 P P Q = − (2)
The main advantage of this system is to be an achromatic interferometer : thus, temporal coherence is irrelevant and spatial coherence limits only the depth-of-focus within which interference can be obtained. Therefore it is possible to use a basic commercial ArF excimer laser as the exposure source. The other advantage of this interferometer is that the main optical elements, that is the two diffraction gratings, are fabricated using the capabilities of the silicon line available in our laboratory (including e-beam direct writing lithography techniques) ; therefore we are free to shift to various applications such as high index fluids testing and contact holes printing.
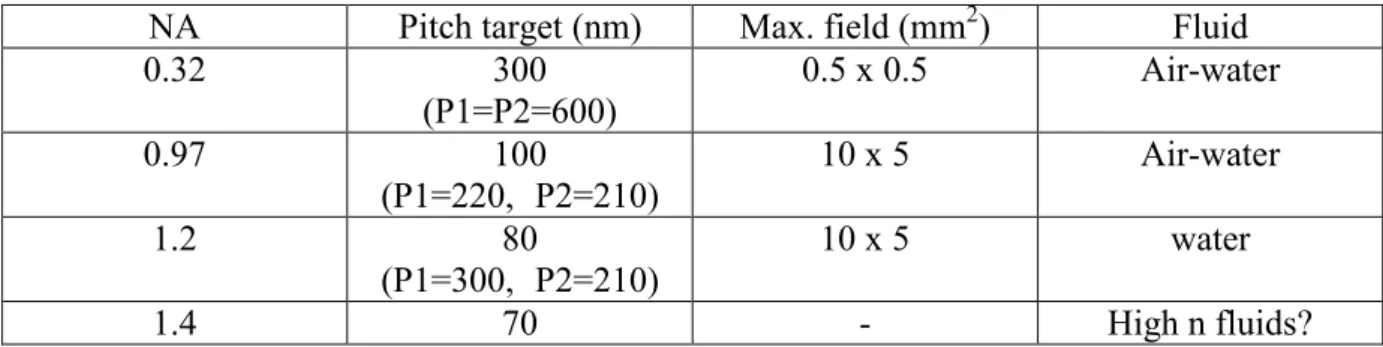
Several configurations have been designed enabling the printing of resist lines down to 70 nm pitch and are summarized in table 1.
NA Pitch target (nm) Max. field (mm2) Fluid
0.32 300 (P1=P2=600) 0.5 x 0.5 Air-water 0.97 100 (P1=220, P2=210) 10 x 5 Air-water 1.2 80 (P1=300, P2=210) 10 x 5 water 1.4 70 - High n fluids?
Table 1: Different immersion interferometric configurations available with corresponding field and immersion fluid
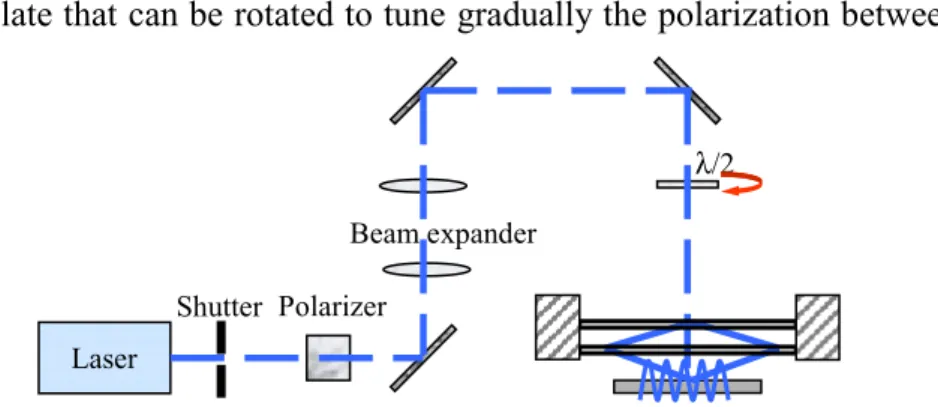
The source is a 193 nm GAM excimer laser with spatial and temporal coherence lengths of respectively 500 and 930 µm. The laser beam is propagated through a mechanical shutter enabling a precise control of the exposure time, a beam expander x5 to limit the beam divergence and polarizers before reaching the two diffraction gratings setup. Polarization control is made with a polarizer which linearly polarizes the output laser beam followed by a
P1 P2 β1 γ1 γe γ2 βe β2 n N n γg βg P1 P2 β1 γ1 γe γ2 βe β2 n N n γg βg
quarter wave plate that can be rotated to tune gradually the polarization between TE and TM mode (fig. 2).
Fig. 2: Schematic of the double diffraction interferometer and its optical environment.
The grating substrate parallelism is controlled with the help of a Fizeau interferometer.
A special system have been designed for water supply and recovery, therefore water is degassed, filtered, temperature controlled and recovered after exposure for analysis.
For the resist/Top Coat interactions studies, results from two Methacrylate based resists will be discussed. Lithographic performances of the resists with or without top coat materials have been checked with the interferometer. Secondly, specie concentration profiles have been monitored by Secondary Ion Mass Spectrometry (SIMS) in order to detect possible resist component leaching phenomenon due to the contact with water during the immersion step [8]. The SIMS tools were a Cameca IMF 6f, using a Cs+ source and a Simslab (VG Instruments), with a Ga+ source.
3. Experimental results
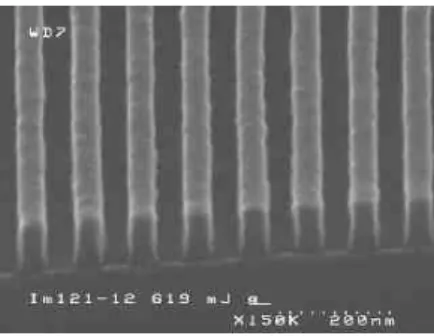
The three first designs presented in table 1 (respectively 0.32, 0.97 and 1.2 NA) have been mounted in the interferometer and validated. After compaction of the system and the setting-up of an anti-vibration table to prevent vibration issues, high contrasted lines have been obtained in all configurations. Figure 3 shows photoresist lines printed with the immersion double diffraction interferometer at NA up to 1.2 using a 193nm immersion photoresist. Though no top coat has been used to act as a barrier layer, no major profile issue can be observed with this resist. 50 nm L/S are well defined and 40nm L/S are achievable.
a) b) c)
Fig. 3: Photoresist lines at a) NA=0.32 and half-pitch of 150 nm, b) NA=0.97 and half-pitch of 50 nm, c) NA=1.2 and half-pitch of 40 nm.
The immersion double diffraction interferometer has been used to print dense contact holes for further studies on contact holes process by double exposure. Figure 4 shows 50 nm contact holes printed in standard immersion resist. It has to be outlined that for this first set of contact hole printing experiments, the resist formulation which were used has been a line and space
Shutter
λ/2
Laser
Beam expander Polarizer
resist formulation, i.e. not fully optimized to achieve such features. However, 50nm contact holes have been printed and further work will now be conducted in order to better optimize resist behavior for such CD targets.
Fig. 4: 50 nm contact holes printed
with the immersion double diffraction interferometer
Finally significant progresses have been done on diffraction gratings fabrication and we are now able to fabricate diffraction gratings with periods down to 200 nm and diffraction efficiency up to 10 % using our lab facilities. They have been tested and mounted in the interferometer as beam splitter. 55 nm half pitch lines have been demonstrated by this means (see figure 5).
Fig. 5: 55-nm-half-pitch photoresist lines printed with the immersion double diffraction interferometer with a home made grating as beam splitter
The validation of this optical element is of high interest since it will help us to switch to various applications such as high index fluids testing and contact holes printing. Indeed this interferometer is well adapted to the test of various fluids, even aggressive ones that can damage the interferometer last optical element since diffraction gratings are easy and relatively cheap to fabricate.
4. Polarization studies
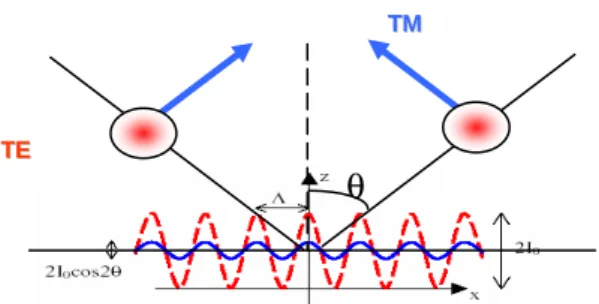
Since first industrial immersion tools will be unpolarized, it is of high interest to predict the polarization effects at high NA. Such an interferometric setup is well suited for such studies since we are able to tune easily the polarization from TE to TM mode. In this section we evaluate the image contrast in function of polarization by calculation and we confirm the predictions with experiments. Figure 6 represents the two beams interfering in the resist layer.
Fig. 6: Schematic of the interference phenomena occurring in the resist layer in TE and TM mode
The light intensity in TE and TM mode are respectively giving by the equations 3 and 4.
As the image contrast is defined by (Imax-Imin)/(Imax+Imin), contrast in TE remains equal to one
whatever the incident angle and contrast in TM drops with increasing incident angle. Fig. 7 shows the image contrast versus NA.
Figure 7: Resist image contrast versus NA
for TE and TM polarization in two beams interferometry.
In TE polarized light, the electric fields vectors will always fully interfere since they are parallel. In TM polarized light, the electric fields vectors cannot interfere when they are perpendicular (see figure 6). Therefore the contrast drops to zero at NA=1.26. However the contrast loss in resist is less than in air since the resist refractive index is higher, therefore the angle made between the interfering beams is smaller. This will also lead to the fact that at same NA the contrast will not be changed from dry to wet lithography.
In our interferometric configurations, NA of 0.32 to 1.2 are available. Polarization studies have been done with the 0.97 NA configuration. In this configuration contrast in TM polarization is expected equal to 0.4 (see figure 7). Fig 8 shows resist lines of 100 nm pitch in TE and TM polarization. We notice high contrasted lines in TE polarization whereas the
)) sin . . 4 cos( . 2 cos 1 ( . 2 0 θ λ π θ nx I ITM = + T TEE T TMM θ )) sin . . 4 cos( 1 ( . 2 0 θ λπ nx I ITE = + (3) (4)
Image contrast of TE and TM polarization in resist with index n=1.8
0 0,5 1 0 0,2 0,4 0,6 0,8 1 1,2 1,4 NA C o n tr a st TM contrast TE contrast
contrast loss is significant in TM polarization. The effect of this low contrast is a noticeable line roughness.
Figure 8: 100-nm-pitch photoresist lines in (a) TE and (b) TM polarization
5. Resists and topcoat studies
One of the objectives of our interferometer setting is to propose a first screening of immersion dedicated resist formulations, with or without top-coat, to check their lithographic capabilities, compatibility with top-coat layers and leaching behaviors.
Figures 9 to 12 present the lithographic capabilities and fluorine profiles of two 193nm line and space resists, referred as resists A and B. Resist A has been designed for immersion lithography with a top coat barrier layer approach, Resist B is a conventional ‘’dry’’ 193nm resist that has been tested in immersion.
SIMS analysis have been then conducted on the same lithographic stacks with or without contact with immersion water for 60s.
PAG concentration profile has been monitored following the negative ion containing fluorine. As a result, the variations of fluorine ion concentration as a function of the immersion step can be correlated to the leaching of the resist.
In addition to fluorine ion profiles which are presented here, resist matrix profile can also be controlled with 12C- and 16O- species, and even BARC layer can be detected looking at the
26
CN-/26C2H2- species.
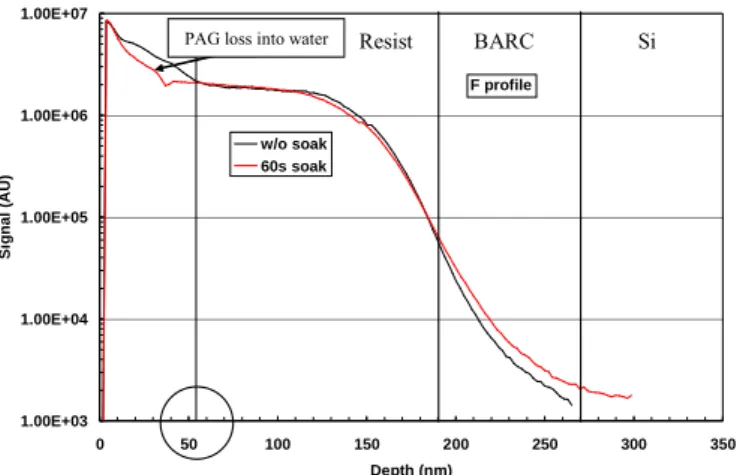
Figure 9 represents the fluorine profile, corresponding to the PAG concentration profile in Resist A without top coat. The reference profile (without soaking) shows an over concentration near the surface, that can be related to various causes such as PAG and resist solubility in the casting solvent, PAG / polymer affinities and film formation conditions during the coating step. After 60s of soaking in deionized water, the Fluorine ion profile is modified near the surface. A loss of Fluorine species is observed near the resist surface. This concentration decrease is limited to an average 50nm deep interfacial layer, corresponding to some PAG leaching from the resist to the water in absence of a top coat barrier layer. This characterization result is in good accordance with the lithographic performance of resist A without top-coat, showing some T-topping phenomenon over about 50 nm in depth (Figure 10). On the other hand, the use of a top coat layer avoids T-topping issues.
Figure 9: SIMS fluorine profiles for Resist A with or w/o a 60s soaking step in water. Resist thickness: 190 nm.
Figure 10: 55nm L/S patterns printed by immersion interferometry. Resist A. Left : without top-coat layer, T-top profiles are observed.
Right: with a top-coat acting as a barrier layer to PAG leaching. Resist thickness: 190 nm.
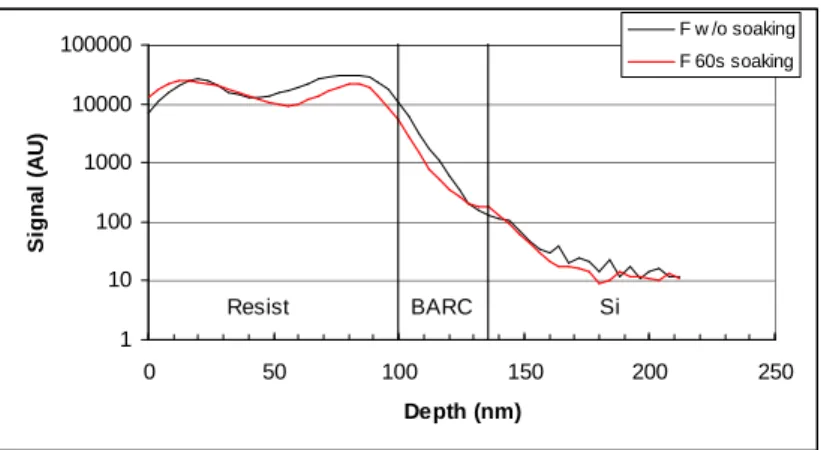
On the other hand, figures 11 and 12 represent fluorine profile for Resist B, the conventional ‘’dry’’ formulation tested in immersion. Even without top coat, no PAG loss can be observed at the resist surface after 60s soaking. This result is quite encouraging for the use of such formulation in a non top coat process.
1.00E+03 1.00E+04 1.00E+05 1.00E+06 1.00E+07 0 50 100 150 200 250 300 350 Depth (nm) S ig n a l (A U ) w/o soak 60s soak F profile -11% Resist BARC Si
PAG loss into water
54 nm 54 nm
Figure 11: SIMS fluorine profiles for Resist B with or w/o a 60s soaking step in water. Resist thickness: 100 nm.
Figure 12: SIMS fluorine profiles for Resist B with a top coat layer with or w/o a 60s soaking step in water.
Resist thickness: 100 nm.
However, due to some pattern collapse, we have not been able to obtain 50 nm L/S patterns with Resist B without coat. Figure 13 shows the good performance of Resist B with a top-coat approach. Straight profiles have been obtained.
Figure 13: 50nm L/S patterns printed by immersion interferometry. Resist B with a top-coat layer.
Resist thickness: 100 nm. 1 10 100 1000 10000 100000 0 50 100 150 200 250 Depth (nm) S ig n a l (A U ) F w /o soaking F 60s soaking Resist BARC Si 1 10 100 1000 10000 100000 0 50 100 150 200 250 Depth (nm) S ig n a l (A U ) F w/o soaking F 60s soaking T o p c o a t Resist BARC Si
6. Simulations
We have implemented a simulation model which can be used to predict the light distribution inside a photolithographic stack. This model enables us to predict the resist image created by the interference of two coherent beams in the photo-resist volume. Wavelength, polarization state, NA, refractive index immersion medium and lithographic stack can be chosen. There are no limitations in the number of layers. In particular, it is possible to use double BARC stack. Assuming a development model, the cross section of the printed lines could be predicted.
We have implemented this algorithm in a Matlab environment. The introducing parameters are:
- the numerical aperture NA, which is linked to the incident angle via n×sinθ =NA - the polarization direction
- the immersion medium, defined by its optical index at 193nm - the stack, defined by the layers optical index and thickness - the Silicon substrate
The lines profiles have been estimated assuming that the resist which is exposed below the dose to clear is remaining and the rest is removed by the developer.
6.1. TE polarization
The intensity interfering pattern is calculated inside a photoresist cross section in TE polarization and at 0.97 NA leading to 50-nm half pitch lines (see figure 14).
0 0.5 1 1.5 2 2.5
Cross section of the interferring pattern
51 71 36 0nm x in nm z i n n m -150 -100 -50 0 50 100 150 60 70 80 90 100 110 120 0 0.5 1 1.5 2 2.5
Fig.14: Simulated aerial image of two beams interference in TE polarization at 0.97 NA. One can notice that the intensity of light inside the resist is not constant in z. In the case above, we have used a BARC thickness at its optimal thickness. Even in this case, we can see depth dose variation which are in the range of 10%.
The corresponding lines profiles can be seen in figure 15. We can notice a slight linewidth variation even at optimum BARC thickness.
Cross section of the lines 51 71 36 0nm x in nm z i n n m -150 -100 -50 0 50 100 150 0 50 100 150
Fig.15: Simulated resist line profiles in TE polarization at 0.97 NA. The lines are represented in white, the BARC in light yellow and the air in orange. 6.2. TM polarization
The same stack, but with 50 nm resist and in TM polarization shows lower contrast and more variations within the resist thickness (Figure 16).
Cross section of the interferring pattern TM
51 50 36 0nm x in nm z i n n m -150 -100 -50 0 50 100 150 55 60 65 70 75 80 85 90 95 100 1 1.2 1.4 1.6 1.8 2
Fig.16: Simulated aerial image of two beams interference in TM polarization at 0.97 NA. In figure 17, the fringes at the top and at the bottom of stack have been plotted. We can notice a slightly higher contrast at the top of the resist.
a)
TM fringe contrats and top and bottom
-1500 -100 -50 0 50 100 150 0.1 0.2 0.3 0.4 0.5 0.6 0.7 0.8 0.9 1 x in nm Top Bottom b)
Cross section of the lines TM
51 50 36 0nm x in nm z i n n m -150 -100 -50 0 50 100 150 0 20 40 60 80 100 120
Fig.17: a) Intensity fringes at the top and bottom of the resist, b) Simulated resist line profiles. The lines are represented in white, the BARC in light yellow and the air in orange.
Both simulations are performed in TM polarization at 0.97 NA.
6.3. BARC thickness effect.
Different BARC thicknesses have been investigated to evaluate the impact of BARC thickness variations on resist lines profiles. The simulations have been performed in TE polarization for 70 nm thick resist (Figure 18).
a) 0 0.5 1 1.5 2 2.5 3 3.5
Cross section of the interferring pattern
51 70 24 0nm x in nm z i n n m -150 -100 -50 0 50 100 150 60 70 80 90 100 110 120
Cross section of the lines
51 70 24 0nm x in nm z i n n m -150 -100 -50 0 50 100 150 0 20 40 60 80 100 120 140 b)
Cross section of the interferring pattern
51 70 32 0nm x in nm z i n n m -150 -100 -50 0 50 100 150 60 70 80 90 100 110 120 0.5 1 1.5 2 2.5
Cross section of the lines
51 70 32 0nm x in nm z i n n m -150 -100 -50 0 50 100 150 0 50 100 150 c)
Cross section of the interferring pattern
51 70 36 0nm x in nm z i n n m -150 -100 -50 0 50 100 150 60 70 80 90 100 110 120 0 0.5 1 1.5 2 2.5
Cross section of the lines
51 70 36 0nm x in nm z i n n m -150 -100 -50 0 50 100 150 0 50 100 150
d)
Cross section of the interferring pattern
51 70 41 0nm x in nm z i n n m -150 -100 -50 0 50 100 150 60 70 80 90 100 110 120 0 0.5 1 1.5 2 2.5 3
Cross section of the lines
51 70 41 0nm x in nm z i n n m -150 -100 -50 0 50 100 150 0 20 40 60 80 100 120 140 160 e)
Cross section of the interferring pattern 51 70 52 0nm x in nm z i n n m -150 -100 -50 0 50 100 150 60 70 80 90 100 110 120 0 0.5 1 1.5 2 2.5 3 3.5
Cross section of the lines
51 70 52 0nm x in nm z i n n m -150 -100 -50 0 50 100 150 0 20 40 60 80 100 120 140 160
Fig.18: Simulated aerial image and resist line profiles of two beams interference in TE polarization at 0.97 NA for different BARC thickness
a) 24nm, b) 32 nm, c) 36 nm, d) 41 nm, e) 52 nm
It is of high interest to have access to lines profiles since we can evaluate the effect of substrate reflectivity leading to standing waves. Some experimental work is now under investigation to confirm those simulations.
Further improvements of the simulation tool are on going to evaluate the BARC reflectivity in the resist and a strategy for BARC optimization.
7. Conclusions
We have completely designed an immersion interferometer to generate resist patterns with period down to 60 nm. The great advantages of this setup compared to others already existing is that it is possible to use a basic commercial ArF excimer laser as the exposure source and that the main optical elements are home-fabricated enabling us to switch to various applications such as high index fluids testing and contact holes printing in a very simple way. Imaging at 0.32, 0.97 and 1.2 NA was demonstrated and polarization effects at oblique incidence angles have been shown. Moreover this interferometer have been used to propose a first screening of immersion dedicated resist formulations, with or without top-coat, to check their lithographic capabilities, compatibility with top-coat layers and leaching behavior. Finally we have presented a simulation model which can be used to predict the light distribution inside a photolithographic stack. Some simulations have been shown and some work in under investigation for BARC optimization purpose.
Finally we are currently working on the interferometer design to extend it to hyper high NAs, aggressive CDs and to build a monolithic interferometer with home made gratings which will be compatible with high index fluids.
References :
[1] A.Bourov, Y. Fan, F. Cropanese, N. Lafferty, L. Zavyalova, H. Kang, B.W. Smith, Proc. SPIE 5377, (2004).
[2] W. Conley et al. , ''Understanding the photoresist surface-liquid interface'', SPIE 2005, Pages 10-22, Vol.5753.
[3] R. Dammel et al., ''Leaching phenomena and their suppression in 193nm immersion lithography'', Photopol. Sci. Technol., Pages 593-602, Vol.18 (2005).
[4] A. Yen, Ph. D. dissertation, Massachussetts Institute of Technology (1991)
[5] E. H. Anderson, K. Komatsu, and H. I. Smith, J. Vac. Sci. Technol. B 6 (1) pp. 216-218 (1987)
[6] T.A. Savas, S. N. Shah, M. L. Schattenburg, J. M. Carter, and H. I. Smith, J. Vac. Sci. Technol. B 13 (6) pp. 2732-2735 (1995)
[7] A.L. Charley, A. Lagrange, O. Lartigue, J. Simon, P. Thony, P. Schiavone, to be published in JVSTB
[8]M. Maenhoudt et al., ''Opportunities and challenges in immersion lithography'', Photopol. Sci. Technol., Pages 571-577, Vol.18 (2005).