HAL Id: hal-02433855
https://hal.archives-ouvertes.fr/hal-02433855
Submitted on 9 Jan 2020HAL is a multi-disciplinary open access
archive for the deposit and dissemination of sci-entific research documents, whether they are pub-lished or not. The documents may come from teaching and research institutions in France or abroad, or from public or private research centers.
L’archive ouverte pluridisciplinaire HAL, est destinée au dépôt et à la diffusion de documents scientifiques de niveau recherche, publiés ou non, émanant des établissements d’enseignement et de recherche français ou étrangers, des laboratoires publics ou privés.
The early development of brain white matter: A review
of imaging studies in fetuses, newborns and infants
Jessica Dubois, Ghislaine Dehaene-Lambertz, Sofya Kulikova, Cyril Poupon,
Petra Hüppi, Lucie Hertz-Pannier
To cite this version:
Jessica Dubois, Ghislaine Dehaene-Lambertz, Sofya Kulikova, Cyril Poupon, Petra Hüppi, et al.. The early development of brain white matter: A review of imaging studies in fetuses, newborns and infants. Neuroscience, Elsevier - International Brain Research Organization, 2014, 276, pp.48-71. �10.1016/j.neuroscience.2013�. �hal-02433855�
The early development of brain white matter:
A review of imaging studies
in fetuses, newborns and infants
Jessica Dubois Ph.D. 1, Ghislaine Dehaene-Lambertz M.D. Ph.D. 1, Sofya Kulikova M.S. 2,3, Cyril Poupon Ph.D. 4, Petra S. Hüppi M.D. Ph.D. 5,6, Lucie Hertz-Pannier M.D. Ph.D. 2,3
Affiliations:
1: INSERM, U992, Cognitive Neuroimaging Unit, Gif-sur-Yvette, France; CEA, NeuroSpin Center, Gif-sur-Yvette, France; University Paris Sud, Orsay, France
2: INSERM, U663, Paris, France; CEA, SHFJ/NeuroSpin Centers, Gif-sur-Yvette, France; University Paris Descartes, Paris, France
3: CEA, NeuroSpin Center, UNIACT, Gif-sur-Yvette, France 4: CEA, NeuroSpin Center, UNIRS, Gif-sur-Yvette, France
5: Geneva University Hospitals, Department of Pediatrics, Division of Development and Growth, Geneva, Switzerland
6: Harvard Medical School, Children’s Hospital, Department of Neurology, Boston, MA, USA
Corresponding author:
Jessica Dubois, PhD
CEA/SAC/DSV/I2BM/NeuroSpin/Cognitive Neuroimaging Unit U992 Bât 145, point courrier 156
91191 Gif-sur-Yvette, France
Email: jessica.dubois@centraliens.net
Neuroscience 2014. 276:48-71.
Abstract
Studying how the healthy human brain develops is important to understand early pathological mechanisms and to assess the influence of fetal or perinatal events on later life. Brain development relies on complex and intermingled mechanisms especially during gestation and first post-natal months, with intense interactions between genetic, epigenetic and environmental factors. Although the baby’s brain is organized early on, it is not a miniature adult brain: regional brain changes are asynchronous and protracted, i.e. sensory-motor regions develop early and quickly, whereas associative regions develop later and slowly over decades. Concurrently, the infant/child gradually achieves new performances, but how brain maturation relates to changes in behaviour is poorly understood, requiring non-invasive in vivo imaging studies such as MRI.
Two main processes of early white matter development are reviewed: 1) establishment of connections between brain regions within functional networks, leading to adult-like organisation during the last trimester of gestation, 2) maturation (myelination) of these connections during infancy to provide efficient transfers of information. Current knowledge from post-mortem descriptions and in vivo MRI studies is summed up, focusing on T1- and T2-weighted imaging, diffusion tensor imaging, and quantitative mapping of T1/T2 relaxation times, myelin water fraction and magnetization transfer ratio.
2
Keywords
Brain development, white matter pathways, (bundles), organization, (maturation), myelination, magnetic resonance imaging MRI, diffusion tensor imaging DTI, (relaxometry, myelin water fraction MWF, fetus, preterm newborn, infant).
Table of contents
Abstract ... 1 Keywords ... 2 Table of contents ... 2 Abbreviations ... 3 I. Introduction ... 5II. The basic concepts of white matter development ... 6
1. The early organization of white matter ... 6
i. White matter organization in adults ... 6
ii. Growth of fiber connections during the last trimester of gestation ... 6
2. The maturation of white matter ... 7
i. Myelin description ... 7
ii. Myelination of white matter fibers... 7
iii. Regional asynchrony of WM myelination ... 8
iv. Functional correlates of WM myelination ... 8
III. Structural MRI techniques and developmental specificities ... 9
1. Conventional MR imaging and relaxometry ... 9
i. Physical basics ... 9
ii. Developmental specificities of T1w and T2w contrasts ... 9
iii. Mapping T1 and T2 relaxation times during WM maturation ... 10
2. Diffusion imaging ... 10
i. Physical basics and post-processing strategies ... 10
ii. DTI correlates of WM maturation ... 11
3. Myelin-related imaging parameters... 12
i. Magnetization transfer ratio ... 12
ii. Myelin water fraction ... 12
4. Practical considerations for imaging the developing brain ... 13
i. In vivo imaging of the baby brain... 13
ii. Technical constraints of conventional imaging ... 13
iii. Technical constraints of DTI... 13
IV. Imaging the early organization of white matter ... 14
1. Imaging the white matter growth ... 14
i. Increase in WM volume... 14
ii. Imaging a mix of several processes ... 14
2. Before term: imaging the growth of fiber connections ... 14
i. Post-mortem investigations with conventional MRI ... 14
ii. Post-mortem investigations with diffusion imaging ... 15
iii. In vivo investigations ... 16
3. After term: imaging the WM bundles and developing connectivity ... 16
i. Imaging the WM bundles ... 16
ii. Developing WM connectivity ... 16
V. Imaging the maturation of white matter ... 17
1. Different periods of WM maturation... 17
3
ii. After term: major changes related to myelination ... 17
2. Spatio-temporal sequence of WM maturation ... 18
i. Maturation asynchrony across WM bundles ... 18
ii. Maturation progression within a WM bundle ... 19
3. Sophisticated approaches to map WM maturation asynchrony ... 19
i. Correlations between MRI parameters ... 19
ii. Multi-parametric imaging ... 20
VI. Functional correlates of MRI biomarkers of WM maturation ... 21
1. Early WM asymmetries in highly lateralized functional networks ... 21
2. Correlations between DTI parameters and functional measurements ... 21
3. Functional correlates of MRI biomarkers in preterm newborns ... 22
i. Early impairments in WM development... 22
ii. Correlations with behavioral measures ... 23
iii. Focus on the developing visual system ... 23
VII. Conclusion ... 23
Acknowledgements ... 24
Figure 1: Anatomical images of the developing brain ... 25
Figure 2: DTI images of the developing brain ... 26
Figure 3: Tractography of the developing white matter bundles ... 27
Figure 4: Illustrations of maturation-related changes in MRI parameters ... 28
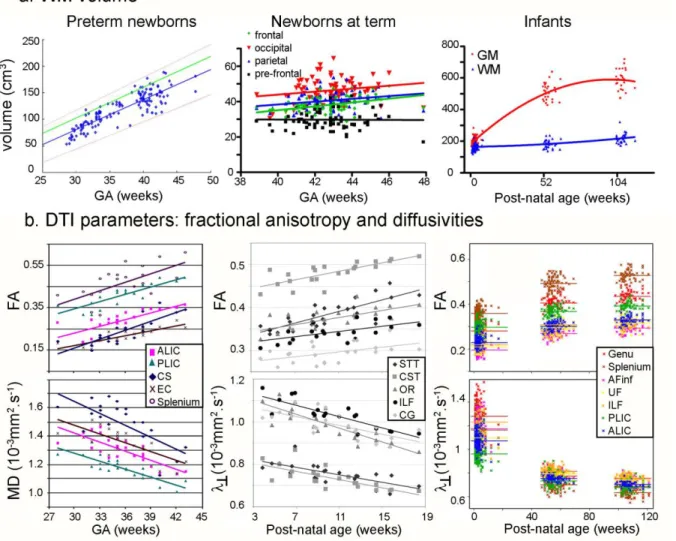
Figure 5: Age-related changes in white matter volume and DTI parameters ... 29
Figure 6: Age-related changes in quantitative parameters related to myelin ... 30
Figure 7: General time-line of white matter development ... 31
References ... 32
Abbreviations
AF arcuate fasciculus
ALIC anterior limb of the internal capsule CC corpus callosum
CG cingulum
Cl linear diffusion anisotropy CNS central nervous system Cp planar diffusion anisotropy CS centrum semiovale
CST cortico-spinal tract
DEHSI diffuse excessive high signal intensity DTI diffusion tensor imaging
DWI diffusion-weighted imaging EC external capsule
FA fractional anisotropy GA gestational age GM grey matter
ILF inferior longitudinal fasciculus MD mean diffusivity
MRI magnetic resonance imaging MTR magnetization transfer ratio MWF myelin water fraction OR optic radiations PD proton density
4 PLIC posterior limb of the internal capsule
PTA post-term age: post-natal age corrected for gestational age at birth, considering a term age of 40w
PVWM peri-ventricular white matter
R1 relaxation rate associated with T1 relaxation time (R1=1/T1) R2 relaxation rate associated with T2 relaxation time (R2=1/T2) SNR signal-to-noise ratio
STT spino-thalamic tract
TBSS tract-based spatial statistics TE echo time
TI inversion time TR repetition time
T1 longitudinal relaxation time T1w T1-weighted
T2 transverse relaxation time T2w T2-weighted UF uncinate fasciculus VLBW very-low-birth weight WM white matter 2D 2 dimensions 3D 3 dimensions // longitudinal diffusivity ┴ transverse diffusivity
5
I.
Introduction
Brain development relies on several complex and intermingled mechanisms, such as the maturation and functional specialisation of grey matter (GM) regions (cerebral cortex and central grey nuclei) and the establishment and myelination of white matter (WM) connections between the different neural regions. Typical development is the global consequence of interactions between genetic programming, epigenetic and environmental factors (e.g. external stimulations, maternal, nutritional or medical factors). Cerebral changes are particularly intense during the last weeks of gestation and the first post-natal months, as indirectly highlighted by the non-linear increase of the cranial perimeter (by about 14cm during the two first post-natal years, followed by only 7cm until adulthood). Although the baby’s brain is organized early on into functional networks, it is not an adult brain in miniature: growth and maturation are asynchronous, some regions, like the sensory ones, develop early on and quickly, whereas associative regions, like frontal ones, develop later on and slowly until the end of adolescence (Paus, et al. 2001).
Concurrently with this anatomical evolution of the brain, the infant gradually achieves new psycho-motor and cognitive skills, but how brain maturation explains the often abrupt changes of behaviour observed during development is poorly understood. Before the development of non-invasive brain imaging methods, our knowledge on human brain development was relying on (fortunately) rare post-mortem investigations, which are intrinsically limited by the lack of anatomo-functional correlations and by the uncertainty on brain normality. Using myelin staining, most of these studies described whether myelin is present or not in a given WM region at a given age: this information is however not bundle-specific and thus might be misleading at bundles crossings. Advanced post-mortem dissection techniques now enable to follow the trajectory of long-distance bundles (Maldonado, et al. 2013; Martino, et al. 2010). But absolute measurements of myelin amount are still missing, which prevents the quantitative comparison across WM regions.
Another approach to understand brain development is to study animals, but if such studies enable to test particular hypotheses, they remain largely inadequate because of the specificity of human cognitive functioning and brain development. Mammals are generally classified according to their developmental stage at birth, belonging either to species with early development or to species with immature development. Humans have a special position since brain responses are already observed in utero (Draganova, et al. 2007), while some high-level functions have a protracted development over two decades. For instance, he fiber myelination in the somatosensory, motor, frontopolar and visual neocortices is delayed in humans compared with chimpanzees, with slower myelination during childhood extending beyond late adolescence (Miller, et al. 2012).
The recent development of non-invasive techniques (magnetic resonance imaging MRI, electroencephalography EEG, magnetoencephalography MEG) has further enabled to relate maturation of cerebral structures to infants’ neurodevelopment and behaviour. In particular, several MRI techniques available on clinical scanners (section III) enable to investigate and follow longitudinally the brain development and plasticity of healthy and at-risk children (Barkovich 2000; Huppi and Dubois 2006; Neil, et al. 2002; Paus, et al. 2001; Prayer and Prayer 2003; Yoshida, et al. 2013). But when these imaging techniques are applied to babies, many difficulties arise and require adapting data acquisition and post-processing to different developmental periods (fetus, preterm or at-term newborn, infant, toddler, etc.).
With these constraints in mind, we here review the main insights revealed by recent MRI studies on the early development of white matter, which is a complex and long-lasting process that plays a crucial role during the human motor and cognitive development (section II). Two main stages can be delineated: 1) the establishment of long and short connections between
6
brain regions during the last trimester of human gestation, leading to an early adult-like organisation of neural networks, 2) the maturation of these fibers during infancy and toddlerhood to provide an efficient transfer of information between functional regions. These two processes are consecutively described in the healthy brain by summarizing current knowledge obtained from post-mortem and in vivo imaging studies (sections IV and V). Finally, the functional significance of early structural biomarkers of the developing white matter is discussed based on studies with behavioural and neurophysiologic evaluations of infants, with a specific focus on preterms without overt brain lesions (section VI).
II.
The basic concepts of white matter development
1. The early organization of white matter
i. White matter organization in adults
White matter contains a large amount of glial cells (astrocytes, oligodendrocytes and microglia, which account for around 50% of the total brain volume and nearly 90 % of brain cells), but it is mainly studied as the brain compartment of crossing paths that connect different functional regions. Long-distance fibers, generally gathered into bundles, can be classified according to their connection patterns. Commissural fibers connect the two cerebral hemispheres, mostly between homotopic regions (e.g. the corpus callosum). Projection fibers are bi-directional fibers between the thalamus and the cortex, between the cortex and the brainstem and spinal cord (e.g. the cortico-spinal tract, the optic radiations). Associative fibers regroup cortico-cortical fibers between intra-hemispheric regions (e.g. the arcuate fasciculus) and fibers of the limbic system (e.g. the fornix).
ii. Growth of fiber connections during the last trimester of gestation
The progressive organization of WM connections has been established with post-mortem studies. Once the neuron has migrated to its final localization, it develops connections with other neurons at both ends: a dendritic tree within the grey matter, and the formation of an axon running through the white matter. At the macroscopic level, the axons formation leads to the formation of long-distance bundles. This wiring occurs mostly during the second part of pregnancy, but its exact temporal progression is still poorly described in humans. It includes processes of neuronal and synaptic overproduction, followed by cellular apoptosis, axonal retraction and synaptic pruning. All these processes of overproduction/elimination are essential to sustain the functional networks plasticity (Stiles and Jernigan 2010). The early wave of migrating neurons remains in the subplate (underneath the future cortex) and is crucial to establish a first rough blueprint of the cerebral organization, both for the cortex and the white matter. On the one hand, they relay thalamo-cortical projections in the late fetal and preterm brain, amplifying sensory signals (Kanold and Luhmann 2010; Kostovic and Judas 2010), and on the other hand they send pioneering axons toward the internal capsule to guide axons from the later migrating neurons (McConnell, et al. 1989). They also guide inter-hemispheric connections through the corpus callosum between 25 and 32 weeks of gestational age (w GA) (deAzevedo, et al. 1997).
To reach their target structure, axons grow and are guided by their extremity growth cones, which are attracted or repulsed by positive or negative signals (e.g. contact signals, chemical signals, neuro-transmittors, growth factors). They follow “pioneering” axons (process of “fasciculation”). The initial connection production stage is followed by a pruning stage that aims at suppressing redundant or aberrant circuits and is dramatically sensitive to the environment (Huttenlocher and Bonnier 1991). This process may be influenced by several
7
factors: e.g. neuron survival, competition for trophic factors, electrical activity of axons, afferent inputs. In particular, in the corpus callosum, pruning is a major morphogenetic process between the end of gestation and the first and second postnatal months (Innocenti and Price 2005). In the rhesus monkey, up to 70% of callosal axons are eliminated in the four first post-natal months (LaMantia and Rakic 1990). In humans, the number of axons in the corpus callosum may be close to a maximum in the newborn brain (with no new axons being formed to cross the midline), and the process of axonal pruning is supposed to occur after birth (Kostovic and Jovanov-Milosevic 2006).
2. The maturation of white matter
Concurrently and subsequently to the organization of WM networks, fiber connections become progressively mature and functionally efficient through the myelination process that favors the conduction of the nervous impulse (Baumann and Pham-Dinh 2001; Van der Knaap and Valk 1995; Van der Knaap and Valk 1995b).
i. Myelin description
In the adult brain, the WM white color is due to the high myelin content (40 to 50% of dry weight). The myelin sheaths enwrapped around axons are complex bilamellar membranes constituted by lipoproteins (myelin basic proteins MBP, proteo-lipid proteins PLP, myelin associated glycoproteins MAG, 2’,3’-Cyclic nucleotide-3’-phosphohydrolase CNP, etc.) and lipids (cholesterol, phospholipids, glycolipids, galactocerebrosides, etc.). This “roll-cake like” structure is formed by the membrane prolongations of oligodendrocytes in the central nervous system (CNS) (Barkovich 2000).
The myelin role is to allow a fast conduction of the nerve impulse. Indeed, the action potential propagates along the axon by electrical depolarization of the nervous membrane, continuously when no myelin sheath enwraps the axon, or via saltatory conduction from a Ranvier node to the next (Ranvier nodes are the fiber places between myelin sheath segments). The conduction speed depends on the distance between nodes, on axonal diameter and on the myelin sheath thickness: from 2m.s−1 in unmyelinated CNS fibers to 120m.s−1 in myelinated fibers of the peripheral nervous system.
ii. Myelination of white matter fibers
Myelination (i.e. myelin formation around axons) is the last stage of white matter development, that begins after the process of axonal overproduction-pruning and follows premyelinating stages including the formation and maturation of oligodendrocytes (Thomas, et al. 2000). This process includes several steps (Butt and Berry 2000; Hardy and Friedrich 1996; Prayer and Prayer 2003). Oligodendrocyte precursors proliferate, migrate and form “initiator” processes, which align along axons (predominant radial orientation) and identify targeting axons (Volpe 2008). Spiral ensheathment around the axon starts with an extension of such a process that elongates and wraps around the axon. Afterward, the myelin sheath becomes more compact, through an increasing number of spiral turns that is determined by the axonal diameter (Baumann and Pham-Dinh 2001).
A single oligodendrocyte myelinates several axons (even of different diameters), suggesting that each axon participates to the regulation of its myelination (Friede 1972). In the human brain, four stages of oligodendrocyte maturation have been described: early and late progenitor cells, immature and mature oligodendrocytes. The immature oligodendrocytes (which are multipolar cells rich in a lipid called galactocerebroside) account for 30 to 40% of the entire oligodendroglia population in the preterm period (~28-37w GA).
The “myelinating” state generally refers to the initial period when pre-oligodendroglial cells increase and settle along the axons (Baumann and Pham-Dinh 2001),
8
and when the cholesterol and glycolipids concentration starts to increase (Barkovich, et al. 1988; Poduslo and Jang 1984). The following “true” myelination process corresponds to the ensheathment of oligodendroglial processes around the axons, and to the chemical maturation of the myelin sheath with rising amount of macromolecules (Barkovich, et al. 1988; Poduslo and Jang 1984). At the microscopic level, the myelination induces major changes in water molecules content and compartmentalization (Matsumae, et al. 2001) and in protein and lipid contents (Barkovich, et al. 1988; Kucharczyk, et al. 1994). Notably, a strong correlation exists between myelination and the concentration of galactocerebroside in immature and mature oligodendrocytes (Matthieu 1993).
iii. Regional asynchrony of WM myelination
Myelination occurs in the human brain from the second part of pregnancy to the end of adolescence. A peak is observed during the first post-natal year. Its progression varies across cerebral regions: it follows a caudo-rostral gradient and progresses from the center to the periphery. Post-mortem studies have detailed this sequence (Brody, et al. 1987; Flechsig 1920; Gilles, et al. 1983; Kinney, et al. 1988; Yakovlev 1962; Yakovlev and Lecours 1967), using a visual ordering from stages 0 to 4 according to staining with hematoxylin and eosin-luxol fast (“mature myelin” refers to stages 3 and 4). Some myelin is observed microscopically from 20w GA on at the level of the bulb and pons, which are myelinated at birth. Mature myelin is detected from 37-40w GA in the cerebellum and internal capsule. Between the first and third post-natal months, the posterior limb of the internal capsule, the optic radiations and the corpus callosum splenium become myelinated. Mature myelin can be found from the 6th month in the anterior limb of the internal capsule and in the corpus callosum genu, from the 15th month in the occipital pole, and from the 23rd month in the frontal and temporal lobes (for review (Baumann and Pham-Dinh 2001).
From these post-mortem studies, several rules can be outlined on the myelination progression in the brain (Kinney, et al. 1988): it occurs earlier and faster 1) in proximal pathways than in distal ones; 2) in sensory pathways (somatosensory, vision, audition) than in motor ones; 3) in projection fibers than in associative ones; 4) in central regions than in polar ones; 5) in the occipital pole than in the posterior parietal white matter and in the temporal and frontal poles. These global schemes cannot be dissociated from one another, and suggest eight sub-groups of maturation, depending on the presence/absence of myelin at birth (sub-groups A/B) and the time periods at which mature myelin is observed (sub-(sub-groups 1-4) (Kinney, et al. 1988). For example, the middle cerebellar peduncles, the optic tract and chiasm, the posterior limb of the internal capsule, the cortico-spinal tract in the midbrain and pons and the central corona radiata belong to sub-group A1; optic radiations (proximal and mid-distal), auditory radiations (proximal), the corpus callosum body and splenium belong to sub-group B1; cingulum, external capsule, the anterior limb of the internal capsule, the corpus callosum rostrum and Heschl’s gyrus belong to sub-group B2; fornix and extreme capsule belong to sub-group B4. This asynchrony in the maturation sequence is supposed to depend on the hierarchy of connections between cortical areas (Guillery 2005): the early maturation of receptive sensory areas (responsible for low-level processing) would enable a stabilization of the information used by integrative areas (involved in high-level processing) which develop later on.
iv. Functional correlates of WM myelination
Beside glial factors, neuronal maturation and electrical activity might control myelination induction (Kinney, et al. 1988). Blocking this activity in vitro inhibits myelination (Demerens, et al. 1996), and the proliferation of oligodendrocytes precursors is influenced by neighboring axonal activity (Barres and Raff 1993). Electrical activity in the mouse optic nerve influences
9
the triggering of myelination over a short time period (Demerens, et al. 1996). This nerve myelination is further delayed in mice kept in a dark environment after birth (Gyllensten and Malmfors 1963) and accelerated in rabbits whose eyelids have been opened prematurely (Tauber, et al. 1980). Astrocytes may act as an intermediary between myelination and electrical impulse activity, through the mediation of a cytokine leukemia inhibitory factor (Ishibashi, et al. 2006). Nowadays, the inhibitory role of oligodendrocytes and myelin on neuritic growth is also considered, which may partly explain the weak plasticity of the adult brain (Ng, et al. 1996).
Since myelination leads to a spectacular increase in the conduction speed of the nerve impulse (Baumann and Pham-Dinh 2001), it is assumed to improve the functional efficiency of brain networks (van der Knaap, et al. 1991). Myelination of the midbrain and spinal cord is actually coupled with behavioral improvement (Langworthy 1928; Langworthy 1928b), but fiber myelination and functional maturation are uncorrelated in different cerebral systems. For instance, the myelination of the cortico-spinal tract occurs before birth in several regions (midbrain, internal capsule, central corona radiata) while the newborn motor capacities are weak. On the other hand, the acoustic radiations have an extended myelination until 3 years of age while the infant auditory system is efficient early on.
Such discrepancy may rely on the fact that extending myelination may be necessary in a second step to compensate for brain growth and maintain similar latencies between brain regions across ages (Salami, et al. 2003). In the visual system for example, the latency of the first positive wave of response to a stimulus (P1) reaches the adult latency (~100ms) at around 4 post-natal months, whereas the distance between the retina and the calcarine fissures still increases by around 6cm until adulthood. Whereas the transfer of visual information may be efficient early on in 4-month old infants, an extending myelination may enable to further increase the conduction speed by around 0.6m.s-1 in relation with brain growth.
III.
Structural MRI techniques and developmental specificities
Several complementary MRI techniques can be used to image brain development in healthy infants. Since signal comes from the hydrogen nuclei (the “protons”) of water molecules, cerebral tissues with different water concentrations and environments demonstrate on MR images different contrasts that change with brain maturation.
1. Conventional MR imaging and relaxometry
i. Physical basics
“Conventional” MRI generally refers to images whose signal is weighted (noted “w”) by proton density or by relaxation times, which characterize how fast the water magnetization returns to equilibrium after the perturbation induced by electromagnetic waves. The longitudinal relaxation time (T1) characterizes the proton interactions with its environment (“spin-lattice” interactions), while the transverse relaxation time (T2) characterizes the interactions between protons (“spin-spin” interactions). In the developing brain, T1 weighting is generally obtained with short TR and short TE, or using inversion recovery sequences with long inversion times (TI), while T2 weighting is obtained with long repetition times (TR) and long echo times (TE). Since relaxation times depend on tissue characteristics, T1w and T2w images demonstrate high contrast between cerebral tissues in the adult brain (Figure 1).
ii. Developmental specificities of T1w and T2w contrasts
Because of brain tissues immaturity and high water content, T1w and T2w contrasts are very different in the infant brain from what is described in the adult brain, and contrasts
10
evolve with brain maturation (Figure 1). Considering the brain as a whole, successive maturational stages are described (Paus, et al. 2001): (1) the infantile pattern (0-6 months), showing a reversal of the normal adult contrasts (T1w: lower WM intensity than GM intensity; T2w: higher WM intensity than GM intensity); (2) the iso-intense pattern (8-12 months), characterized by a poor contrast between GM and WM; and (3) the early-adult pattern (>12 months) (T1w: higher WM intensity than GM intensity; T2w: lower WM intensity than GM intensity). Actually, the specific time-course of these patterns depends on brain regions because of maturation asynchrony (see section V).
As a consequence, the delineation between the grey and white matter is often not obvious on infant images, contrarily to the clear border observed on adult T1w images. T1 weighting is mostly used during the preterm and perinatal periods, but the contrast becomes poorer with age until it recovers during the second post-natal year. T2 weighting transitorily enables a better contrast between term and 4-6 months term (Leroy, et al. 2011b). The second post-natal semester is actually the most difficult period to image, with a weak delineation of the GM/WM border.
To identify myelinated WM regions from unmyelinated regions, T1w contrast is generally preferred during the first 6-8 post-natal months, and T2w contrast between 6 and 14 months because changes in white matter contrasts are observed on T1w images before T2w images (Barkovich, et al. 1992; van der Knaap and Valk 1990).
iii. Mapping T1 and T2 relaxation times during WM maturation
The changes observed on T1w and T2w contrasts can be used to understand maturation processes, but T1w and T2w signals cannot be directly compared across individuals because of the variability between exams related to technical tunings. To provide such inter-individual comparisons, either signals may be normalized for each subject in reference to a given tissue (e.g. the cortico-spinal fluid) (Leroy, et al. 2011a), or T1 and T2 relaxation times may be quantitatively measured (Figure 1) by recording signals from dedicated MRI acquisitions with different sequence parameters (e.g. different inversion times TI to compute T1, different echo times TE to compute T2).
In the developing brain, T1 and T2 decrease more strongly in WM than in GM because of myelination processes (Figure 4a) (Barkovich 2000; Prayer and Prayer 2003). At least two distinct pools of water molecules are supposed to contribute to MR signal in the white matter: water located within the myelin sheath (with relatively short T1 and T2 relaxation times) and intra-axonal, intra-cellular and interstitial water (i.e. water outside of the myelin sheath, with longer T1 and T2). Both T1 and T2 decreases parallel the decrease in water concentration, nevertheless their time courses are different, and two distinct mechanisms can be distinguished: the change in water molecules compartmentalization (Matsumae, et al. 2001), and the increase of protein and lipid contents (Barkovich, et al. 1988; Kucharczyk, et al. 1994). T1 shortening starts already during the “pre-myelinating” state, while T2 shortening correlates temporally with the chemical maturation of the myelin sheath (Barkovich, et al. 1988; Baumann and Pham-Dinh 2001; Poduslo and Jang 1984) (Figure 4c).
2. Diffusion imaging
i. Physical basics and post-processing strategies
Another recent approach to assess WM maturation is diffusion-weighted imaging (DWI) which measures the natural motion of water molecules. The diffusion in cerebral tissues is not “free” (Le Bihan 2003). Microscopic displacements may be restricted within multiple physical compartments, or hindered by cell and organelle membranes: this results in tortuous pathways around these obstacles. Imaging diffusion at the macroscopic scale thus
11
enables to explore the tissue microstructure non-invasively (Le Bihan, et al. 2001). To take into account the spatial heterogeneity of the diffusion process, the diffusion information is generally encoded in different spatial directions, and the diffusion tensor (DT) formalism is used with the assumption that a single fiber orientation is present in each voxel of the image and that the diffusion process can be represented by an ellipsoid that encodes the tensor eigenvectors and eigenvalues. The DTI technique provides maps of quantitative and complementary parameters (Figure 2): diffusion anisotropy (e.g. fractional anisotropy FA) (Beaulieu 2002), mean diffusivity (MD = one third of the tensor trace), longitudinal diffusivity (// = diffusivity along the main tensor axis) and transverse diffusivity (┴ =
diffusivity perpendicular to the main axis).
The trajectory of white matter fibers can be further reconstructed virtually in 3 dimensions (3D) using tractography algorithms that follow the direction of the main DT eigenvector from a voxel to a neighbouring voxel (Le Bihan and Johansen-Berg 2012) (Figure 3). The dissection of major WM bundles is then based either on the individual definition of regions crossed by the fibers, or through automatic classifications recently proposed for the adult brain, such as clustering (Guevara, et al. 2012; Guevara, et al. 2011) and probabilistic methods (Yendiki, et al. 2011). Recently, some alternatives to the tensor model have been proposed, such as Q-ball imaging, diffusion spectrum imaging (DSI) and high-angular resolution diffusion imaging (HARDI). These techniques enable to resolve multiple fiber orientations within a voxel, but they require long acquisition times hardly achievable in vivo in healthy unsedated infants.
ii. DTI correlates of WM maturation
DTI parameters are well suited to reveal information that is not apparent on T1w and T2w images during brain development (Figure 2) (Huppi and Dubois 2006; Neil, et al. 2002). It is generally assumed that diffusivities decrease with maturation, while anisotropy increases in the developing white matter (Huppi, et al. 1998a; Neil, et al. 1998) and decreases in the cortex during the preterm period (Ball, et al. 2013; McKinstry, et al. 2002). Transverse diffusivity decreases more in WM than in GM (Mukherjee, et al. 2002), leading to a reversed contrast between newborns and adults on transverse diffusivity maps. In WM bundles, changes are more intense for transverse than for longitudinal diffusivity (Dubois, et al. 2008b; Geng, et al. 2012; Mukherjee, et al. 2002), with even no change in longitudinal diffusivity detected after 1 year of age (Gao, et al. 2009). These parameter dynamics in WM bundles are consistent with the assumption of a cylindrically symmetric decrease in diffusion due to myelination process (Mukherjee, et al. 2002).
Fifteen years ago, it had been suggested that the age-related decrease in mean diffusivity in both grey and white matter would reflect the overall decrease in brain water content, while the increase in anisotropy in the white matter would rather rely on its microstructure (e.g. packing and myelination) (Neil, et al. 1998). Nowadays the current hypotheses on the relationships between these parameters and the maturational mechanisms are recognized as more complex in the white matter (Figure 4b).
Even in the absence of myelin, the tight organization of WM fibers inside a bundle lead to intrinsic anisotropy related to high longitudinal diffusivity contrasting with low transverse diffusivity (Beaulieu 2002). Studies in rat pups have shown that the first evidence of anisotropy precedes initial myelin (Wimberger, et al. 1995), and that this early anisotropy may be related to sodium-channel activity (Prayer, et al. 2001).
During the first stage of myelination (“pre-myelination”), when glial cell bodies and membranes proliferate, both a decrease in brain water content and an increase in membrane density are observed, which imply decreases in mean, longitudinal and transverse diffusivities. Whereas this mechanism had initially been assumed spatially isotropic (Dubois,
12
et al. 2008b), recent evidence rather suggests that the initial extension of oligodendroglial processes is anisotropic in favor of the axonal direction (Nossin-Manor, et al. 2012; Zanin, et al. 2011). This anisotropy increase has been related to the maturation of the compound action potential and the development of immature oligodendrocytes in the rabbit developing white matter (Drobyshevsky, et al. 2005).
The following “true” myelination process (with the ensheathment of oligodendroglial processes around the axons) is further accompanied by a decrease in both membranes permeability and extracellular distance between membranes, implying an increase in anisotropy, a decrease in transverse diffusivity, but no change in longitudinal diffusivity. At crossing fibers places, the situation may appear puzzling when crossing bundles follow different maturational calendars: when the first bundle gets myelinated, anisotropy first increases, but it subsequently decreases when the second crossing bundle gets mature (the reverse argument has been detailed for neurodegenerative disorders (Douaud, et al. 2011)); at the same time, diffusivities are decreasing (Figure 4b).
Therefore anisotropy and longitudinal diffusivity are rather good markers of tissue macrostructure and organization, finely characterizing compactness, crossing fibers, etc. but the interpretation of their changes may remain difficult during WM maturation. On the contrary, transverse diffusivity consistently decreases with all maturational processes (Figure 4c).
Recently, other geometrical diffusion measures (linear and planar diffusion anisotropies Cl and Cp) have been considered to model more accurately different WM microstructures in comparison with the classical cylindrical shape of a fiber bundle (Chen, et al. 2011). During maturation, these parameters may be sensitive to changing compactness since after birth Cl growth velocities are highest in central white matter while Cp growth velocities are highest in peripheral white matter.
Finally, let’s keep in mind that DTI parameters vary across bundles in the adult brain, in relation with their macroscopic geometry and compactness. Highlighting maturational effects in the developing brain thus requires either considering the developmental trajectories toward adulthood to evaluate the asymptotes of maturation, or normalizing infant measurements by the adult references (Dubois et al. 2008a).
3. Myelin-related imaging parameters
Other quantitative parameters relying on the myelin amount have been proposed to evaluate the maturation of white matter.
i. Magnetization transfer ratio
The “magnetization transfer ratio” (MTR) informs about the ratio between free water and water with restricted motion, bound to macromolecules such as proteins and lipids (McGowan 1999). Thus it is thought to reflect the myelin amount and increase during WM maturation (Kucharczyk, et al. 1994). Nevertheless, during the preterm period (26-34w GA), MTR values have been found higher in the genu and splenium of the corpus callosum (CC) than in the posterior limb of the internal capsule (PLIC) and the periventricular white matter (PVWM). Since at this stage callosal fibers are highly organized, closely packed, but non-myelinated fibers, this technique appears to be sensitive not only to myelin-associated macromolecules, but also to the macromolecular density of axonal cytoskeleton components such as microtubules and neurofilaments (Nossin-Manor, et al. 2012) (Figure 4c).
ii. Myelin water fraction
As for approaches based on “multi-component relaxation” (MCR) analyses, different pools of water molecules are modeled in each voxel (Spader, et al. 2013). These pools can be
13
distinguished from measured MR signals, on the basis of different relaxometry properties (T1 and/or T2) and of specific exchange relationships (Beaulieu, et al. 1998; Menon, et al. 1991; Whittall, et al. 1997). Such decomposition is supposed to provide valuable information on the tissue microstructure. Whereas the exact number of pools to be modelled is still debated (Deoni, et al. 2012b), a consistent pool of water related to myelin is always considered, and studies generally describe maps of “myelin water fraction” (MWF) (Figure 1). This fraction drastically increases during WM maturation (Deoni, et al. 2012a) (Figure 4c). Contrarily to relaxation times, the definition of MWF is a priori independent from the magnetic field. But its computation is highly sensitive to both the acquisition protocol and the post-processing modeling, making direct comparisons across studies hardly achievable.
4. Practical considerations for imaging the developing brain
i. In vivo imaging of the baby brain
The pre- and post-term periods are radically different, not only in terms of brain organization (see next section) but also in terms of practical possibilities to obtain MR images. Because infants after term are generally healthy, ethical and practical issues are similar to older ages. On the contrary, the main difficulty in imaging the pre-term period is to obtain images of healthy (or at least not neurologically ill) brains. Imaging fetuses in utero is not commonly done without strong medical arguments. Similarly, preterm newborns are at high-risk of neurological lesions, and their physiological stage is very unstable making them difficult to move to MRI center without good reasons.
In all cases, imaging fetuses and infants is a challenge. Data are difficult to acquire first because of the techniques’ sensitivity to motion. Without clinical indication, healthy babies cannot be sedated, then one cannot prevent a fetus to move within the womb, and quietness is difficult to obtain in infants during a long time. Thus, data acquisition should remain short, especially in preterms in whom it is difficult to maintain a stable thermal state inside the MR scanner. Acoustic noise should also remain reasonable, in order to avoid any acoustic trauma and discomfort, and to assure baby’s sleep or quiet cooperation. Second, despite short acquisition time, image spatial resolution should be higher than in adults because cerebral structures are smaller. That is why the scarce images obtained at early ages (i.e. before 5 months of gestation) have been obtained in post-mortem fetuses with very long acquisition times.
ii. Technical constraints of conventional imaging
The developing brain is changing every day, much more rapidly than the adult brain between 20 and 50 years of age, and T1w and T2w contrasts change with the brain tissues maturation. This contrast variability and the use of different MR sequences along the first post-natal year require dedicated post-processing tools for different developmental periods to segment unmyelinated and myelinated white matter from other cerebral tissues (grey matter, cerebro-spinal fluid). However it may lead to misclassification of cerebral tissues (Choe, et al. 2012; Matsuzawa, et al. 2001), and the comparison across ages remains difficult.
iii. Technical constraints of DTI
The signal-to-noise ratio (SNR) of DW images decreases with infants’ age because both T2 relaxation times and diffusivities decline during the first post-natal months (Mukherjee, et al. 2002). Actually the reliability of DTI estimation is influenced by SNR and by the number of diffusion directions. To a certain extent, acquiring more directions is equivalent to averaging (Dubois, et al. 2006a). Adapting the number of diffusion directions according to the infants’ age (with more numerous directions in older infants) is worth
14
considering to make the data reproducible across subjects. Furthermore, DTI quantification is particularly sensitive to motion artefacts, and several strategies have been proposed to reduce or correct them during the acquisition (Dubois, et al. 2006b) or in post-processing (Dubois, et al. in revision).
IV.
Imaging the early organization of white matter
1. Imaging the white matter growth
i. Increase in WM volume
With all these difficulties in mind, we can try to appreciate the WM growth by estimating its volume from T1w and T2w images acquired before and after term (Figure 5a). In normally developing fetuses in utero, the global volume of the intermediate zone and subplate (whose frontier remains difficult to delineate) increases from around 15 to 90cm3 between 21w and 31w GA, i.e. 15% per week (Scott, et al. 2011). In premature neonates, the WM volume increases from around 50cm3 at 29w GA to 170cm3 at 44w GA, as reported in age-specific
atlases (Kuklisova-Murgasova, et al. 2011). Afterwards, a longitudinal follow-up study in infants has demonstrated that WM volume increases from around 164cm3 at term birth to 183cm3 at 1 year of age (i.e. increase by 11% per year), to 218cm3 at 2 years of age (i.e.
increase by 19% per year).
Thus at these ages WM growth is relatively slow in comparison with the rapid GM growth (by 149% in the first year and 14% in the second year), leading to a decrease in the percentage of WM when normalized for the total brain volume (Gilmore, et al. 2007; Knickmeyer, et al. 2008). Subsequently the WM volume increases at a higher rate than GM volume throughout childhood (Matsuzawa, et al. 2001), and the ratio between WM and GM volumes dramatically increases during childhood and adolescence (Groeschel, et al. 2010).
ii. Imaging a mix of several processes
While WM tissue is imaged as a whole on T1w and T2w images, its volume increase actually reflects several processes that occur successively or concomitantly during development, but whose contributions are hard to separate. WM composition is changing dramatically, especially during the mid-gestation period which is marked by neuronal migration: pyramidal neurons follow radial patterns along glial fibers, from the central periventricular region to the cortical periphery, while interneurons follow tangential patterns from the ganglionic eminence. Axonal connections are also growing from central grey nuclei and from cortical regions. Besides, the vascularity is developing according to a radial organization. These coherent structural patterns are mixing, making the dissection of growing fascicles difficult. Concurrently, glial cells proliferate: oligodendrocytes play a crucial role to myelinate axonal fibers during the late pre-term and post-term periods, while the contribution of developing astrocytes and microglia is still poorly understood, notably in terms of metabolism. Overall, several mechanisms contribute to the global increase in WM volume, and more subtle MRI techniques are thus required to detail the axonal organization in the growing WM.
2. Before term: imaging the growth of fiber connections
i. Post-mortem investigations with conventional MRI
Correlation studies between histology and conventional MRI with high spatial resolution in post-mortem fetuses (Judas, et al. 2005; Rados, et al. 2006) have shown that three fiber
15
systems are recognizable as early as 12w GA: the corpus callosum, the fornix and the hemispheric stalk, which represents a massive connection between the telencephalon and the diencephalon and contains all the projection fibers of the developing internal capsule, including the thalamo-cortical fibers. During the mid-fetal period (17-24w GA), a substantial elaboration of major cerebral fiber systems is observed in the “intermediate zone” (the fetal “white matter”). In the fronto-polar and occipito-polar regions, the fiber architectonics of the fetal cerebrum displays a tangential axon strata. Below the corpus callosum, the fornix is well developed. The corpus callosum, the internal and external capsules are growing. In the central white matter, the “periventricular crossroads” are the intersections between these major fiber systems: callosal fibers (transverse direction), associative fibers (sagittal direction), thalamo-cortical/cortico-fugal fibers (radial direction).
Between 24 and 32w GA, the major events are the development of the corona radiata, from the transformation of the tangential fetal fiber-architectonic stratification. All major segments of the cerebral white matter can be recognized: corpus callosum, corona radiata, centrum semiovale, gyral white matter (which is not yet fully developed because the subplate zone remains interposed between the corona radiata and the cortex). Fibers continue to grow at the levels of the periventricular crossroads and of the ventricular part of the corpus callosum, which leads to a blurring on post-mortem images. By term birth, all major fiber systems are to be in place.
ii. Post-mortem investigations with diffusion imaging
DTI imaging is an exquisite technique to detail the developing organization of white matter and precise the developmental calendar observed on conventional images. Imaging fetuses post-mortem at 19-20w GA confirmed that limbic fibers (cingulum, fornix) develop first (entire trajectories visible at 19w GA) and association fibers last (Huang, et al. 2006). The corpus callosum, the uncinate and inferior longitudinal fasciculi become apparent between 13 and 22w GA (Huang, et al. 2009). At 20w GA, the corpus callosum formation is more advanced in the frontal lobe (genu and forceps minor) than in other regions (splenium and forceps major, body). The core regions of projection fibers are well-developed early on, but not the peripheral regions (i.e. the corona radiata), and the anterior limb of the internal capsule develops before the posterior limb.
The more elaborated technique of HARDI tractography applied to post-mortem fetuses between 19w to 42w GA (Takahashi, et al. 2012) has clarified the calendar of tract development. A few immature long-range association pathways are visible early on in the white matter (e.g. the uncinate and fronto-occipital fascicles), and short-range cortico-cortical tracts emerge prior to gyrification in regions where sulci will later develop. An early dominant radial organization of WM that gradually diminishes by term age is observed. This feature disappears first in dorsal parieto-occipital regions, second in ventral fronto-temporal regions; earlier at the depths of sulci than in the crests of gyri. At 19w GA, the ganglionic eminence presents a dominant tangential organization which gradually disappears by term. These radial and tangential patterns are related to neuronal migration as confirmed by the combination of HARDI technique with the structural analysis of conventional images in post-mortem fetuses between 21w and 24w GA (Kolasinski, et al. 2013). The radial pattern originates in dorsopallial ventricular / subventricular zone, while the tangentio-radial patterns originate in subpallial ganglionic eminence. These patterns regress in a caudo-rostral and lateral-ventral to medial-dorsal direction across this short developmental period. The post-mortem application of immunomarkers to radial glial fibers, axons, and blood vessels has enabled to decipher the histological origins of the HARDI-defined coherence (Xu, et al. 2012), suggesting that the radial coherence in the fetal white matter likely reflects a mixture of radial glial fibers (at
mid-16
gestation), penetrating blood vessels (that are consistently radial), and radial axons (among radial, tangential and oblique axons).
iii. In vivo investigations
Data acquired in vivo in preterms and fetuses have confirmed post-mortem studies. Using diffusion imaging, the early laminar organization of the cerebrum (cortical plate, subplate zone, intermediate zone, subventricular and periventricular zones, germinal matrix) has been delineated in 25-27w GA preterm newborns (Maas, et al. 2004). Imaging studies of
in utero fetuses have described that the pyramidal tract and the splenium and genu of the
corpus callosum are depicted early on and may be reconstructed in 3D using tractography algorithms between 18 and 37w GA (Bui, et al. 2006; Kasprian, et al. 2008; Pontabry, et al. 2013), as well as the Probst bundles in cases of corpus callosum agenesis (Kasprian, et al. 2013). In preterms, association tracts and subcortical projection tracts are also identified (Dudink, et al. 2007; Partridge, et al. 2004).
3. After term: imaging the WM bundles and developing connectivity
i. Imaging the WM bundles
After term birth, almost all prominent white matter tracts are identified despite low anisotropy values (Hermoye, et al. 2006). This early organization has been further mapped in 3D in infants between 1 and 4 months of age, using a dedicated protocol for acquisition and post-processing (Dubois, et al. 2008b; Dubois, et al. 2006a). Most commissural bundles (genu, body and splenium of the corpus callosum), projection bundles (cortico-spinal tract, spino-thalamic tract, optic radiations, anterior limb of the internal capsule), limbic bundles (fornix and cingulum) and associative bundles (external capsule, uncinate, arcuate, superior and inferior longitudinal fascicles) can be detected and tracked (Figure 3). In a longitudinal study using a dedicated DTI atlas, a similar organization of the major bundles has been shown between newborns and toddlers of 1 and 2 years of age (Geng, et al. 2012).
However, some associative bundles that mature later on (see section V), such as the superior longitudinal fasciculus, demonstrate large changes in fiber orientations during the first post-natal months (Zhang, et al. 2007). High-field imaging at 3T may enable the precise exploration of subtle connections within specific developing networks (e.g. the language network (Dubois, et al. in preparation). Actually one should keep in mind that DTI methodology does not enable to decipher between exact fiber directions in the place of crossing fibers, particularly when crossing bundles are maturing at different rates and over different time periods. This leads to erroneous interpretation on the presence/absence of a bundle in the developing brain. Accordingly, the dorsal pathway of the developing language network (the arcuate fasciculus) may not seem to fully connect temporal and frontal regions in newborns (Brauer, et al. 2013; Perani, et al. 2011), but this might be artefactually related to its low maturation in comparison with the crossing cortico-spinal tract (Dubois, et al. in preparation).
ii. Developing WM connectivity
Recently, the wiring pattern of cerebral connections and the maturational calendar have been reinterpreted in the framework of small-world topology (Hagmann, et al. 2010). The principal characteristics observed in adults have been found in infants demonstrating that the infant brain is neither fully connected, nor only locally connected (Fan, et al. 2011; Pandit, et al. 2013; Yap, et al. 2011). This result might appear trivial, given the anatomical results reviewed above showing that the short and main long-distance connections are already observed before term, but this approach has the advantage to have no a-priori and to place the
17
brain within a mathematical formalism. Longitudinal studies performed from birth to two years of age and based on regional grey-matter volumes (Fan, Shi et al. 2011) and on the number of fibers passing through pairs of regions (Yap, Fan et al. 2011) have been interpreted as showing an increase in integration and a decrease in functional segregation.
Behavioral and functional studies certainly support such hypotheses, but structural studies are confronted with several unsolved drawbacks. For example, the difficulties in GM/WM segmentation vary with age due to changes in T1w and T2w contrasts; weakly myelinated fibers may appear shorter because of lower anisotropy that impacts tractography reconstructions; smaller head size creates partial volume effects that might blur connectivity results in younger infants. Finally, network efficiency is sometimes indirectly inferred from diffusion metrics (Hagmann, et al. 2010), and not directly from the transfer times of the neural information, whereas the information propagation at the same latency in the infant and adults brains may not require a similar tract myelination because of the different brain sizes (Salami, et al. 2003). Fortunately, combining these structural measures with electrophysiological and/or resting-state fMRI have indeed shown a strengthening of the correlations between structural and functional connectivities (Hagmann, et al. 2010).
V.
Imaging the maturation of white matter
When the bundles are in place, a slow process of maturation begins, following a different calendar in different bundles.
1. Different periods of WM maturation
i. Before term: localized myelination
Before 36w GA, unmyelinated WM is the most prominent brain tissue according to T1w and T2w images, and an abrupt increase in myelinated WM is detected between 35 and 41w GA (Huppi, et al. 1998b). However, there is earlier evidence of myelination in specific WM regions (Counsell, et al. 2002) such as the inferior and superior cerebellar peduncles before 28w GA, the posterior limb of the internal capsule, the cortico-spinal tract around the central sulcus and the corona radiata from 36w GA on.
DTI studies of in utero fetuses (Bui, et al. 2006; Jiang, et al. 2009; Kasprian, et al. 2008; Righini, et al. 2003) and ex utero preterm newborns as young as 26w GA (Aeby, et al. 2009; Aeby, et al. 2012; Dudink, et al. 2007; Huppi, et al. 1998a; Miller, et al. 2002; Neil, et al. 1998) have found the general pattern of age-related decrease in mean diffusivity and increase in anisotropy in different WM regions (pyramidal tract, corpus callosum, frontal and occipital regions). In longitudinal imaging between 28 and 43w GA (Partridge, et al. 2004), early differences have been further identified between several projection and association pathways, with low mean diffusivity and high FA in cerebral peduncles, internal capsule and commissural tracts of the corpus callosum, suggesting an early maturation of these tracts (Figure 5b) and confirming the analyses done on T1w/T2w images.
ii. After term: major changes related to myelination
After term, WM myelination is intense in the developing brain, and quantitative MRI parameters have underlined successive maturational periods: acute changes during the first post-natal months, less rapid modifications during toddlerhood, and slower changes thereafter until young adulthood. It is particularly obvious for DTI parameters (Figure 5b): decrease in MD and increase in FA are rapid during the first post-natal year and slower during the second year (Forbes, et al. 2002; Geng, et al. 2012; Hermoye, et al. 2006; Mukherjee, et al. 2001; Sadeghi, et al. 2013). Age-related decreases in diffusivities have been modeled through
18
exponential decays from birth to childhood (Mukherjee, et al. 2001), or by a sigmoid function (Gompertz growth function, based on intuitive variables related to delay, speed, and expected asymptotic value) longitudinally from birth to 2 years of age (Sadeghi, et al. 2013).
In the same way, T1 and T2 decreases are particularly rapid over the two first years (Engelbrecht, et al. 1998; Haselgrove, et al. 2000), yielding to exponential decays with age (Figure 6a) (Leppert, et al. 2009). Conversely, the “magnetization transfer ratio” (MTR) increases exponentially (Engelbrecht, et al. 1998; van Buchem, et al. 2001) (Figure 6b). Between 3 and 60 months, the increase in “myelin water fraction” (MWF) is best modelled by a modified Gompertz function which is characterized by four distinct parameters: the developmental lag, the transitionary period and two growth rates (Figure 6c) (Dean, et al. 2013).
To summarize, for all MRI and DTI parameters, the dynamic of changes is intense between birth and two years of age, which does not match the relatively slow increase in WM volume during this developmental period. Furthermore these non-linear patterns of changes reveal considerable regional variations across and along WM bundles because of myelination asynchrony.
2. Spatio-temporal sequence of WM maturation
i. Maturation asynchrony across WM bundles
The interest of DTI studies rests in the quantification of differences across WM bundles, detailing a progression of maturation from a central-to-peripheral and a posterior-to-anterior direction (Oishi, et al. 2011). For instance, the increase in anisotropy appears greater in non-compact ones (corona radiata and peripheral white matter) than in non-compact white matter structures (corpus callosum, internal capsule, cerebral peduncle) across the first three post-natal years (McGraw, et al. 2002). Diffusivities and anisotropy show different evolutive patterns across brain regions of the preterm brain (Nossin-Manor, et al. 2012) and of the infant brain during the first two post-natal years (Geng, et al. 2012), with highest FA in the corpus callosum and lowest mean diffusivity in the posterior limb of the internal capsule.
By taking advantage of the different sensitivities of diffusivity and anisotropy to maturational processes, a model based on the parameter changes during the “pre-myelination” and the “true” myelination periods was build to describe the bundles maturational stages in infants between 4 and 18w of post-natal age in comparison with an adult group (Dubois, et al. 2008b). This model enabled to detect early spatio-temporal differences in the maturation progression of a set of bundles, from the more to the less mature bundles: 1) the cortico-spinal tract, 2) the spino-thalamic tract and the fornix, 3) the optic radiations, the arcuate and inferior longitudinal fascicles, 4) the anterior limb of the internal capsule and the cingulum. In a similar way, three distinct phases of maturation, with specific dynamics for each bundle type, have been modeled and identified in the fetal white matter between 23 and 38w GA: i) the axonal organization, ii) the myelination gliosis, and iii) the myelination, which appears early in the cortico-spinal tract, followed by the optic radiations and the corpus callosum (Zanin, et al. 2011).
Regional asynchrony in WM maturation is also observed by MTR, showing a relatively mature stage at 12.9m and 15.6m in the occipital and frontal white matter respectively, and at 17.7m and 18.7m in the splenium and genu of corpus callosum (Xydis, et al. 2006). The spatio-temporal pattern of myelination progression is also nicely demonstrated through MWF (Deoni, et al. 2012a; Deoni, et al. 2011). It rises earlier in a frontal-parietal region (projection fibers) than in an frontal region (association fibers) during childhood, following the standard caudal-to-rostral trend (Lancaster, et al. 2003). In infants between 3 and 11 months of age, MWF increases in the cerebellum, pons, and internal capsule; it further
19
increases caudo-cranially from the splenium of the corpus callosum and optic radiations (at 3-4 months); to the occipital and parietal lobes (at 3-4-6 months); and then to the genu of the corpus callosum and frontal and temporal lobes (at 6-8 months) (Deoni, et al. 2011). The spatio-temporal pattern provided over a larger age range (3 months - 60 months) is coherent with histological studies of myelination (Deoni, et al. 2012a).
ii. Maturation progression within a WM bundle
The spatial resolution of DTI also allows to studying maturation along a WM tract: maturation does not evolve at the same time and speed in different spatial locations within a bundle (Colby, et al. 2012; Partridge, et al. 2005). During the first two post-natal years, changes near cortical regions generally appear smaller than in brain central regions (Geng, et al. 2012). In preterm newborns between 28 and 43w GA, the motor tract and the somatosensory radiations of the cortico-spinal tract begin to myelinate during the late preterm period first at the level of the internal capsule (Berman, et al. 2005). Maturation further seems to proceed earlier in the motor pathway than in the sensory one at the vertex where motor fibers initiate from the cortex. From term-equivalent age (Berman, et al. 2005; Geng, et al. 2012), the anisotropy profile presents a local dip at the level of the corona radiata, which suggests the beginning and ongoing maturation of crossing pathways (fibers of the corpus callosum and superior longitudinal fasciculus).
The myelination progression in the visual pathways of infants between 6 and 17w of post-natal age has also been studied, showing two asynchronous fronts of maturation in the optic radiations: an early wave in the anterior region, initiating from the lateral geniculate nucleus, and a later catching-up wave in the posterior region, initiating from the occipital cortex (Dubois, et al. 2008c). According to the assumption that myelination proceeds from the neuron body to the periphery (McCart and Henry 1994), this pattern may result from the respective myelination of the geniculo-cortical (projection) fibers and cortico-geniculate (feedback) fibers, with a delayed maturation of the cortical retrocontrol to the thalamus relative to bottom-up fibers.
3. Sophisticated approaches to map WM maturation asynchrony
Recently, original approaches that combine MRI parameters have been proposed to measure even more precisely the maturation across WM regions.
i. Correlations between MRI parameters
The different parameters (T1, T2, DTI, MTR, MWF) capture different properties of white matter maturation (Figure 4c). Some studies have described specific correlations between them, but most have missed to take into account their major age-related dependencies.
In neonates, a strong correlation has been detected between relaxation rates R1 (1/T1) and R2 (1/T2) among different WM regions (Figure 6a) (Williams, et al. 2005) (Figure 6a). In the kitten WM, DTI mean diffusivity seems to correlate more with R2 than with R1 (Baratti, et al. 1999), whereas maps of mean diffusivity demonstrate a pattern of regional variations similar to T1 maps in preterm newborns between 26 and 45w GA (Nossin-Manor, et al. 2012).
According to the inverse correlation between MTR increase and T2 decrease in WM after term birth, it has been assumed that both changes rely on fast proton relaxation within macromolecules in myelinated tissue (Engelbrecht, et al. 1998). An inverse correlation between MTR and T1 is observed in preterm newborns near term (Nossin-Manor, et al. 2012) (Figure 6b). MTR is also positively correlated with FA in WM during the preterm period, suggesting a coupling between the increase in concentration of pre-myelination-associated macromolecules and the increase in axonal alignment and axonal density (Nossin-Manor, et al. 2012) (Figure 6b). The comparison of MWF measurements with age-related dynamics of