HAL Id: hal-00291559
https://hal.archives-ouvertes.fr/hal-00291559
Submitted on 27 Jun 2008HAL is a multi-disciplinary open access archive for the deposit and dissemination of sci-entific research documents, whether they are pub-lished or not. The documents may come from teaching and research institutions in France or abroad, or from public or private research centers.
L’archive ouverte pluridisciplinaire HAL, est destinée au dépôt et à la diffusion de documents scientifiques de niveau recherche, publiés ou non, émanant des établissements d’enseignement et de recherche français ou étrangers, des laboratoires publics ou privés.
The motility of normal and cancer cells in response to
the combined influence of substrate rigidity and
anisotropic microstructure
Tzvetelina Tzvetkova-Chevolleau, Angélique Stéphanou, David Fuard, Jacques
Ohayon, Patrick Schiavone, Philippe Tracqui
To cite this version:
Tzvetelina Tzvetkova-Chevolleau, Angélique Stéphanou, David Fuard, Jacques Ohayon, Patrick Schi-avone, et al.. The motility of normal and cancer cells in response to the combined influence of sub-strate rigidity and anisotropic microstructure. Biomaterials, Elsevier, 2008, 29 (10), pp.1541–1551. �10.1016/j.biomaterials.2007.12.016�. �hal-00291559�
The motility of normal and cancer cells in response to the combined influence of the substrate rigidity and anisotropic microstructure
Tzvetelina Tzvetkova-Chevolleau1,2*, Angélique Stéphanou2, David Fuard1, Jacques Ohayon2, Patrick Schiavone1,3, Philippe Tracqui2
1
LTM /CNRS/UMR5129, c/o CEA Grenoble, 17 rue des Martyrs, 38054 Grenoble cedex 9, France
2
Laboratoire TIMC–IMAG, Equipe DynaCell, CNRS/UMR5525, Pavillon Taillefer, Faculté de Médecine de Grenoble - 38700 La Tronche, France
3
Laboratoire TIMC–IMAG, Equipe GMCAO, CNRS/UMR5525, Pavillon Taillefer, Faculté de Médecine de Grenoble - 38700 La Tronche, France
*Corresponding author: Fax: +334 56 52 00 22
Tel: +334 56 52 00 43
E-mail address: tzvet@imag.fr
Abstract
Cell adhesion and migration are strongly influenced by extracellular matrix (ECM) architecture and rigidity, but little is known about the concomitant influence of such environmental signals to cell responses, especially when considering cells of similar origin and morphology, but exhibiting a normal or cancerous phenotype. Using micropatterned polydimethylsiloxane substrates (PDMS) with tuneable stiffness (500kPa, 750kPa, 2000kPa) and topography (lines, pillars or unpatterned), we systematically analyse the differential response of normal (3T3) and cancer (SaI/N) fibroblastic cells. Our results demonstrate that both cells exhibit differential morphology and motility responses to changes in substrate rigidiy and microtopography. 3T3 polarization and spreading are influenced by substrate microtopography and rigidity. The cells exhibit a persistent type of migration, which depends on the substrate anisotropy. In contrast, the dynamic of SaI/N spreading is strongly modified by the substrate topography but not by substrate rigidity. SaI/N morphology and migration seem to escape from extracellular cues: the cells exhibit uncorrelated migration trajectories and a large dispersion of their migration speed, which increases with substrate rigidity.
Introduction
The capacity of living cells to migrate in response to extracellular signals is crucial for many physiological processes such as embryonic development, wound healing, functionality of the immune [1, 2] and neural [3] systems. It also takes a crucial part in some pathological mechanisms such as tumour angiogenesis [4, 5]. While signals provided by the gradients of soluble chemoattractants are still considered as leading factors for orchestrating cell movements, additional guidance cues provided by physical and structural properties of extracellular matrices (ECM) have emerged over the last ten years as key parameters for guiding migration of cells. Particularly, matrix rigidity has been shown to strongly affect cell dynamics and physiological functions, including migration, division and apoptosis, differentiation, cytoskeleton organization, gene expression and phagocytosis [6-11]. Moreover, matrix stiffness has been shown to influence solid tumour formation and progression by an integrin-dependent regulation of the malignancy [5].
To understand the large variety of cell responses to the guidance signals provided by their surrounding substrate, many in vitro approaches using micro and nanotechnology-based tools have been developed [12]. Thus, the behaviour of different normal cells has been examined using a large variety of micropatterned substrates such as columns [13, 14], dots [15], pits [14, 16], pores [3], gratings [17] and random surface roughness [18], created by a variety of microlithography and microfabrication techniques. Thus, the use of surfaces with patterned topologies and adhesivity to organise cells morphologies has become a common strategy in tissue engineering. In contrast, methods using surface topography in addition to the stiffness of the culture substrate for organizing cell spatial distribution are quite recent [19] and remain less firmly established. Indeed, it remains largely unclear how cells sense combinations of different types of structural signals such as substrate rigidity and topography. Second, we do
not know which of these two factors may predominantly drive the cell responses. Moreover, it is still unknown if this predominance may change according to the considered cell type or if the associated transduction pathways which orchestrate the cellular response lead to major differences in the motility behaviour of cancer cells compared to normal cells.
In this study, we used PDMS substrate with variable stiffness and patterned with micrometer-scale regions to evaluate the differential behaviour of normal fibroblasts (3T3 line) and transformed fibroblasts (SaI/N) on such surfaces. Using time-lapse videomicroscopy, we systematically investigated and compared the influence of the synergetic effects of substrate rigidity and topography on the morphological changes and motile behaviour of these normal and cancer cells when submitted to the same environmental signals.
Materials and methods
Cell cultures
Mouse 3T3 fibroblasts were cultured in Dulbecco’s Modified Eagle’s Medium (DMEM) (Sigma Aldrich) with 4500 mg/l L-glucose, supplemented with 10% foetal calf serum, 200mM L-glutamine, 0.25% penicillin/streptomycin. SaI/N cells (ATCC CRL-2544) are highly malignant fibroblastic cells, derived from mouse methylcholanthrene-induced sarcoma I tumour, which grow as solid tumours when inoculated subcutaneously [20]. SaI/N cells were maintained on Iscove's Modifed Dulbecco's Medium (IMDM) supplemented with 10% foetal calf serum and 2 mM L-glutamine. All cell culture reagents and media were obtained from Invitrogen (Invitrogen Ltd, UK). Both cell types were cultured under humidified atmosphere with 5% CO2 and at 37°C. 3T3 and SaI/N cells were seeded at a density of 6500 cells/cm2 onto the PDMS substrates.
Fabrication of microstructured PDMS substrates
Two different topographic patterns, with holes and lines, were fabricated in Silicium wafers using conventional 193nm photolithographic techniques followed by an etching process. The silicon wafers were etched down to 800nm, silanized with tridecafluoro-trichlorosilane in vapour phase to facilitate the release of the elastomer from the wafers after curing. 30mg/cm2 of a viscous liquid solution of silicone, polydimethylsiloxane (PDMS) (Sylgard 184, Dow Corning, Midland, MI) and its curing agent, were spilled over the silicon mould, levelled for 30 min at room temperature and cured at 100°C until the proper material rigidity is obtained. The PDMS polymers are then peeled off from the mould.
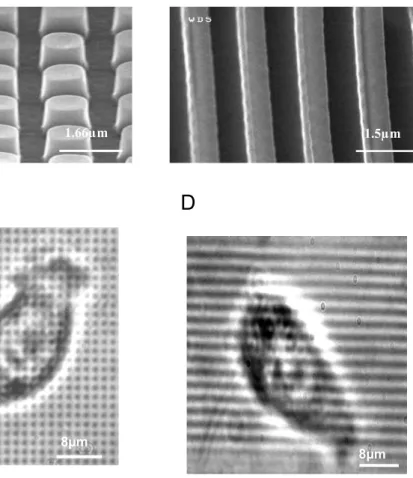
As observed with scanning electron microscopy, the replicas contain micro pillars with diameter of 1000nm, height of 800nm and centre-to-centre distance of 1600nm (Fig. 1A and C). Line patterning has been designed with lines having an equal width and inter-linear space of 750nm (Fig. 1B and D). After release from the mould, the replicas were treated with oxygen plasma (100 sccm O2, in a LAM 9400 SE reactor at 5mT for 10 min) in order to make the PDMS surface hydrophilic (water contact angle in the range of 20-30°). Since water uptake in PDMS is very limited (less than 0,01g/g [21]), the hydrophilic properties of the substrates have been maintained in water for about 18hrs before starting the experiment. Then the substrates were washed 3 times with absolute ethanol and dried. The dried substrates were washed 3 times in PBS buffer and coated with fibronectin, a natural component of the cell ECM, for one hour temperature incubation at room temperature with 3.5µg/cm² fibronectin (Sigma-Aldrich). The fibronectin solution was removed and the substrates were washed 3 times in PBS and 3 times in culture media.
Determination of PDMS Young’s modulus
The Young’s moduli of PDMS substrates with different curing agent/PDMS polymer concentration ratios were measured by stretching unpatterned test samples with a stretching device (EMKA, Technologies, Paris). Briefly, each sample was cast in the form of a strip with size 9 cm. Each strip was uniaxially deformed along its longest axis by using suspended masses. Tension was applied in order to produce a strain. Under these conditions, the stress-strain relationship is linear for the tested sample and its Young’s modulus E was calculated according to the equation:E=(FL)/(S L), where S and L are the original cross-sectional area and length of the strip respectively, and L is the change in length produced by application of the tension F. At least three samples for each type of substrate were tested. The associated mean value of the Young’s moduli are given with the standard deviation of the mean. Unpatterned PDMS substrates with Young’s modulus of 500kPa ! 35kPa were obtained with a 0.5:10 w/w mixture of curing agent/PDMS polymer baked for 180min. PDMS substrate with Young’s modulus of 750kPa ! 25kPa and 2000kPa! 100kPa were obtained using a ratio of 1:10 w/w mixture of curing agent/PDMS polymer further baked at 100°C for 15min or 180min, respectively [22].
For microstructured PDMS, we defined an homogenised Young’s moduli of the substrate by following a homogeneization theory approach considering the volume fraction Vf of PDMS within the sample. For an unpatterned PDMS substrate with Young’s modulus EPDMS, we thus defined in each case a homogenised Young’s modulus of the patterned substrate as
E=VfEPDMS. This provides a realistic first approximation of the rigidity experienced by the
cultured cells crawling over pillars or lines where bending effects are limited due to width/height ratios close to 1. For micro pillars with diameter of 1"m, height of 0.8"m and centre-to-centre distance of 1.6"m, the volume fraction is Vf#0.31, while for lines with equal
width and inter-linear space, one gets Vf=0.5. Accordingly, for unpatterned PDMS with Young’s moduli of 500kPa, 750kPa and 2000kPa, one will get pillar-patterned substrates with homogenised Young’s moduli of 155kPa, 232kPa and 620kPa, respectively, and line-patterned substrates with homogenised Young’s moduli of 250kPa, 375kPa and 1000kPa, respectively.
Scanning Electron Microscopy
SEM observations (Hitachi SEM 4000) were used to reveal the accuracy of the substrates microtopographies. Prior to SEM observation, the surfaces of the substrates were sputter-coated with a 2nm ± 1nm gold-palladium layer to make them electronically conductive and to avoid electronic charging during SEM imaging.
Time-lapse videomicroscopy
Time-lapse phase-contrast microscopy was performed by using an inverted Axiovert 135 microscope (Carl Zeiss, Jena, Germany) equipped with an incubation chamber. Cells were thus maintained during the time-lapse acquisition at a constant temperature of 37°C and constant 5% CO2 in a wet atmosphere, in DMEM medium for 3T3 fibroblasts and IMDM medium for SaI/N fibrosarcomas. Images (Fig. 2) were taken with a CDD200 Cool Snap camera (Roper Scientific) and a 20X plan neofluar objective (Carl Zeiss) was used to collect images from different areas of the PDMS substrates.
Kinetics of initial cell spreading and polarisation were recorded by imaging every two hours six different regions, with image acquisition starting from one hour to nine hours after cell
seeding. Cell tracking was started 10hrs after cell seeding and images were acquired every 10 minutes during 4 hours.
Image analysis was performed with Metavue software (Meta Imaging Series 6.1, Universal Imaging, Downingtown) and ImageJ software (National Institutes of Health, USA).
Quantification of cell area and morphology
Cells morphological changes were quantified by considering a shape factor given by the ratio between the approximated short (S) and long (L) cell axes. Cells with a S/L ratio lower than 0.75 were considered as polarised, and the time needed to reach this polarisation threshold is taken as a characteristic time of the cell polarisation. At least 150 cells were considered for each substrate.
Moreover, the value of the S/L ratio reached 9hrs after cell seeding, denoted as S9/L9, has been estimated for at least 20 cells per sample, together with the associated cell surface.
Quantitative analysis of individual cell motility
Motion of individual cells was analyzed from time-lapse recordings. The ImageJ software was used to determine the centroid position {x(tn),y(tn)} of each cell nucleus at each time point tn,
thus generating the cell migration path from the recorded N successive positions of the cell. The instantaneous cell speed (vn) and cell path orientation !n ) were first quantified from cell
migration paths by evaluating the following expressions:
Moreover, the effectiveness DE of the cell motion has been introduced as the ratio between the distance D, separating the initial and final positions of the cell, and the total length L of the cell trajectory [23]. For each cell, the value DE=D/L has thus being computed, with:
(2)
The cell motion will be considered as more effective when the cell path almost follows a straight line, which corresponds to a value DE close to 1. On the contrary, random cell displacements would lead to smaller values of DE (0"DE"#). At least 25 different cells trajectories per sample were considered in this analysis.
In addition, a more refined analysis of cell motility has been performed by considering that individual cell trajectories may follow a persistent (or correlated) random walk (PRW). This hypothesis, introduced as a generalization of Brownian motion, is indeed often used to describe individual cell motion occurring at well-defined finite speed when persistence or inertia effects are not negligible [24].
Briefly, the persistent random walk (PRW) approach provides a unified way of characterizing cell motility by a two-parameter model which explicits the correlation between the directions of motion taken by the cell within successive time intervals. Practically, the squared displacement d.d(tn, i!t) of each cell is first computed over a time period i."!t from the
distance between the successive positions
{
x(tn), y(tn)} and
{
x(tn+i!t),y(tn+i!t)}
of the cell,i.e.:
Then, the mean-squared displacement <d.d(tk)> at a given time tk = k.!t is obtained by
averaging all the distances which can be computed when considering overlapping intervals of width k covering all the cell positions, from the initial time t0 up to the final observation time
tend = N.!t [24]. Application of this iterative procedure leads to the following expression of the mean-squared displacement:
(4)
Different theoretical approaches have shown that the mean squared displacement can be characterized by only two parameters, the mean speed V and the persistence time P according to the analytical model [24].
(5)
where the persistence time P is a measure of the average time during which the cell maintains a given direction. However, this result has been established when considering an isotropic environment, and its relevance will be tested in our case when considering microstructured pillar substrates, for which anisotropy remains limited.
Thus, in the case of unpatterened and pillar-microstructured susbstrates, a non-linear least square fitting procedure has been used to identify from equations (4) and (5) the parameter set
(Vi, Pi) which provides the best fit to each cell trajectory (Fig. 3). In addition, the cell
population fraction that fails to be described by the PRW model, has been quantified. In order to avoid larger values of k (i.e. small number of intervals) leading to a biased averaging value in equation (2), only values of k<2N/3 are taken for the fitting procedure
Statistics
All results are reported as mean ! standard deviations of the mean. Analysis of the variances was performed using a two-way ANOVA test for independent samples developed by Vassar Colleges, USA, ©Richard Lowry 2001- 2007 (http://faculty.vassar.edu/lowry/anova2u.html). Statistical significance was set at P < 0.05.
Results
The response of the considered two mouse cell lines with fibroblastic phenotype to combined influence of substrate topography and rigidity has been analysed with respect to the dynamics of cell spreading and morphological changes as well as the cell motility behaviour, including migration speed, orientation and effectiveness. For the sake of clarity, we will consistently use the terms soft, rigid, and very rigid for the designation of each type of substrates, patterned or unpatterned, made from PDMS materials with 500kPa, 750kPa and 2000kPa Young’s modulus respectively.
Morphological responses
For each cell line, the progressive elongation (polarization) of the cells during and after spreading has been characterized by the fraction fss of cells within the population that reaches
a steady-state level of polarization lower than the shape factor criterion retained to defined a polarised shape (S/L"$%&') and the time tss taken by these cells to reach this steady-sate level.
For clarity, we do not report the overall set of curves showing the progressive increase of the fraction of cells becoming polarised with time. Instead, we summarize in Table 1 the values of the two parameters fss and tss for all the combinations of surfaces and rigidity we considered.
Polarization kinetics
In the case of 3T3 cells, the results presented in Table 1 show that the time of polarisation tss
significantly depends on the substrate properties. Whatever the substrate topography, the polarisation is faster on softer substrates (tss=3hrs), and increases with the substrate rigidity
(tss=7-9hrs). In all cases however, a large fraction of the 3T3 cells (80%-90%) reaches the
defined polarisation threshold.
In contrast, only a limited fraction of the cancer SaI/N cell population reaches a shape factor lower than the polarisation threshold, since about half of the cell population satisfies this condition (Table 1). Moreover, while the fraction of polarised 3T3 cells was rather insensitive to the substrate rigidity, the number of polarised SaI/N cells increases significantly with substrate rigidity and for all topographies: values of fss are going from 40% to 55% for pillar
and line microstructures, which is quite similar to the range of values (from 37% to 55 %) obtained with unpatterned substrates (Table 1).
Interestingly, the time tss needed by SaI/N cells to reach these fss values is strongly modified
by the substrate topography, but unaffected by the substrate rigidity. The reverse property has been observed with normal 3T3 cells, the values of tss being affected by the substrate rigidity
and not by the substrate topography (Table 1). In the case of SaI/N cells, and by comparison with the unpatterned substrate case, it is particularly noticeable that the line microstructures tend to increase the kinetic of polarisation (tss = 3hrs), while the pillar microstructures tend to
Cell morphologies
In order to correlate the above results with the projected surface of the cells on each substrate, we compiled in Figure 4 the mean cell surfaces and shape factors measured nine hours after cell seeding, when the cell population has reached the polarized steady-state level. The polarisation process of the 3T3 cells, as measured by the S9/L9 ratio is not significantly influenced by the modification in the substrate rigidity but is significantly influenced by the topographic changes in the substrates (p<0.005 for all topographic comparisons). Otherwise 3T3 cell surface is sensitive to rigidity changes (p<0.001), going from 700µm² on soft substrates down to 100µm² on very rigid substrate, No such effect exists with SaI/N cells, those final polarization and surfaces of SaI/N cells are both poorly affected by the substrate topography (p>0.05) and rigidity (p>0.05).
Figure 4 also shows that data for 3T3 cells all belong to the left part of the graph, which means that 3T3 cells are far more elongated than SaI/N cells for all considered substrates: the S9/L9 ratio is close to 0.1 and even reaches a lower value of 0.077 on very rigid substrates with line topography (Fig. 4). Unpatterned and pillar substrates give rise to a less pronounced cell response with a twice higher S9/L9 ratio of 0.15.
Motility responses
Migration speeds
To examine the influence of both substrate rigidity and topography on cells motile behaviour, we first computed using equation (1) the histogram of cell speed distribution within each type of cells and for the observation period of four hours. Figure 5 presents the set of histograms
we obtained for the overall combinations of rigidities and topographies we considered. The range of possible cell speed values between 0 and 2 "m/min was divided into successive interval Ip of 0.2 "m/min width. For each interval Ip, the corresponding bar height indicates
the percentage of cells within the population that have migrated with a speed falling within the rage of values defined by Ip. Thus, a percentage value of 100% means that all the cells
have reached the considered range of speed values at least once during their migration.
The left column in Figure 5 shows the distributions of migration speed computed for 3T3 cells. For unpatterned as well as for patterned surface, 80% of 3T3 cells exhibits a maximum migration speed lower than 0.6µm/min. Only a small fraction of the remaining cells (less then 20%) develops a maximum migration speed larger than1.4µm/min.
In contrast, SaI/N cells develop up to three times higher speeds (around 1.2 µm/min) than those observed for normal cells and independently on the topography. Only 35% of the cells develop small speeds in the range of 2-5 µm/min.
Moreover, figure 5 (right column) shows that the histograms computed for SaI/N tend to flatten out, which indicates a larger dispersion, and thus a weakest regulation, of the cell migration speed.
Interestingly, this dispersion is almost twice higher on very rigid substrates (Fig. 5, dark gray bars) when compared to the soft rigid substrates (Fig. 5, dark gray bars) for all types of substrate patterning. This indicates a clear influence of the substrate rigidity on the regulation of the cell migratory behaviour, since this modification of the histogram amplitude cannot be attributed to an intrinsic dispersion of the cell motility characteristics. A closer examination of the histograms of SaI/N cells also shows that the highest dispersion of cell speed is obtained with pillar microstructured substrates (middle figure, right column, Fig. 5), while lines
topographies tend to channel the dispersion toward lowest migration speed (upper figure, right column, Fig. 5). Such influences have not been observed with normal 3T3 fibroblastic cells.
Displacement effectiveness
Evaluation of the cell displacement effectiveness from equations (2) reveals that this parameter is not significantly sensitive to the substrate topography, nor to the substrate rigidity. Figure 6 presents the histogram established for soft substrates (Fig.6), but similar histograms were obtained for rigid and very rigid substrates (data not shown). Let us remark that the effectiveness criterion does not automatically reflect the substrate anisotropy. Thus, line microstructures substrates will not systematically lead to the largest effectiveness value. Indeed, this value will decrease despite strong anisotropy if cells are moving back and forth along the lines. Considering again Figure 6, one can then notice that unpatterned or pillar substrates (which exhibit none or slight anisotropy or no anisotropy, respectively) can sustain migration paths as effective as line microstructured substrates. This remark still holds for SaI/N cells, but the displacement effectiveness of 3T3 cells is twice more efficient than for SaI/N cells ranging from 50% (unpatterned) to 60% (pillar), while SaI/N cells effectiveness reaches at 25% on soft substrate (Fig. 6).
PRW migration
The previous analysis does not take into account the potential correlation existing between the successive speeds and direction taken by the considered cell. We thus refine our quantitative characterization of the motile behaviour of the two fibroblastic cell types in the framework of persistent (or correlated) random walk motions, as defined in the Materials and Methods section.
First, we found that the PRW model can successfully describe the migration of both 3T3 cells and SaI/N cells, not only on unpatterned substrates, but also on pillars microstructured substrates, i.e. on weakly anisotropic surfaces. More precisely, we found a percentage of cells following a PRW-motion which is close to 90% for 3T3 cells, whatever the rigidity of the substrate (data not shown). A large fraction of 3T3 cells (~ 80%) have a speed V within the range of [0.1-0.5] "m/min. The PWR model can still be considered as relevant for describing SaI/N cells migration, but now only about 55% of these cancer cells follow a PRW motion, with a large dispersion of the values of V which is similar to the one reported in Figure 5.
Taking benefit of the two-parameter description of the overall cell trajectory provided by the PRW model (Equ. (5)), we further examine the persistence of the cell motion, i.e. the tendency for a cell to keep the same orientation of motion. We thus consider as a threshold value for the persistence time P the value P*=80min, which corresponds to 1/3 of the observation period. Accordingly, a cell path for which the fitting procedure gives rise to an identified value of P larger than P* will be qualified as strongly persistent. Figure 7 presents the compiled results we obtained from the analysis of the time-lapse sequences of 3T3 and SaI/N cells migrating on unpatterned and pillar microstructured substrates using this persistence threshold. Interestingly, it appears that the percentage of 3T3 cells with strongly persistent motion depends on both substrate rigidity and topography (Fig.7). With unpatterned substrate increasing substrate rigidity decreases the percentage of cells with strongly persistent motion, from roughly 32% to 12%. In contrast, almost the same percentage of 3T3 (~40%) cells keeps a strongly persistent motion when cell migration takes place on pillar microstructured substrates. On the contrary, the percentage of SaI/N cells with strongly persistent motion remains always below 10%, whatever the substrate topography and rigidity (Fig. 7).
Displacement orientation
To gain further insights into the direction of migration taken by the cells relative to the substrate anisotropy, we use equation (1) to compute the direction of motion taken by each cell between two consecutive sampled positions. Results have been compiled in Figure 8, where the substrate directions given by the lines correspond to a direction angle of 90° (left column), while the pillars have been aligned perpendicularly (0° and 90° directions).
As expected, no preferential direction appears to be followed by the cells on unpatterned substrates. In contrast, the line topography clearly induces a significant oriented cell response, with cell migration in the direction of the lines. The sensitivity of this environmental cue is higher for 3T3 cells. Similarly, 3T3 cells also appear to orient at 90° and probably at 0° of the pillar position (Fig. 9). Thus, 3T3 cells migration over a network of pillars preferentially occurs along the horizontal and vertical directions given by the pillars spatial arrangement. Such an orientation is not observed for SaI/N cells.
The case of pillar substrates has to be analysed more carefully, since such substrate may appear as an intermediate topography between fully isotropic (unpatterned) environment and fully anisotropic line-type of substrate. In order to confirm the results obtained from figure 8 we compile for this particular substrates the so-called “wind roses” of cells trajectories, in which all cell trajectories start from the point (0,0). This macroscopic method confirmed the existence of two preferential migration directions, from the overall set of compiled trajectories of 3T3 cells (Fig 9). Those directions correspond to approximately 0 and 90° according to the pillar orientation. No such preferential directions of migration were observed for SaI/N cells cultured on pillar surface (data not shown).
Discussion
Extensive studies have demonstrated that micropatterned surfaces provide physical cues that guide the migration of several cell types, including endothelial cells, fibroblasts or neurites [25, 26]. However, rather few studies are dealing with systematic analysis of the combined effects of topography and rigidity on cell behaviour [19, 27].
In this study, we used PDMS substrates with tuneable stiffness and specifically designed topographies to systematically investigate the concomitant effects of substrate topography and mechanical stiffness on the behaviour of normal fibroblasts (3T3) and transformed (SaI/N) fibroblasts isolated from fibrosarcoma. To our knowledge, this is the first time that cancer cell migration over microstructured substrate has been reported and compared to the behaviour of normal cells of same phenotype and species.
By applying the same environmental signals to these normal and cancer fibroblastic cells, we first established that the dynamic of cell spreading and progressive acquisition of an elongated morphology differ significantly between normal and cancer cells. Normal 3T3 cells reach more rapidly a polarised shape and keep a larger surface on soft substrates, whatever are the substrate topographies. In contrast, the polarisation kinetics and cell surface of transformed SaI/N fibroblastic cells appeared insensitive to variation in substrates stiffness. However, polarisation kinetics of SaI/N cells were affected by the substrate topography, those being faster on line substrates and delayed on pillar substrates when compared to unpatterned environment.
From extensive analysis of time-lapse videomicroscopy sequences, we then highlighted different motility responses of 3T3 and SaI/N to the physical cues provided by the different PDMS substrates. Particularly the percentage of 3T3 cells exhibiting a strongly persistent displacement on unpatterned substrates is almost divided by three when the PDMS rigidity
becomes four times higher. The migration of 3T3 cells over micropillars substrate appears to be predominately governed by the directional cues given by the pillars alignments, this physical signals being sufficient to sustain the persistent motion of cells, even when the substrate rigidity is increased.
As a whole, the motile behaviour of SaI/N cells appears highly disorganized as demonstrated by the various cell parameters we analysed: the computed displacement effectiveness of the SaI/N cells is at least twice lower than the one computed for 3T3 cells and only roughly half of the SaI/N cells follow a correlated (persistent) random walk motion, either on unpatterned or pillar substrates.
Such differences may be explained by the different migration modes exhibited by normal 3T3 and cancer SaI/N cells as revealed by a close examination of their migration on micropatterned substrates. Increased spreading surface and polarisation of 3T3 cells suggest that these cells form and develop stable focal adhesions which favour the amoeboid type of migration that is clearly identified on time-lapse sequences (supplementary data 1). In agreement with the well admitted five-steps scenario of cell translocation [28], we can clearly observe the cell polarisation and cytoplasm membrane protrusion at the front, formation of strong adhesions with the substrate, cell body translocation and detachment of the rear part of the cell. The last step involves the recycling of adhesion receptors, which is not visible in our experimental conditions. This migrating mode is characterized by the development of important traction forces that can result in some cases in the sudden release of the cell adhesions that propels the cell forward. In contrast, (supplementary data 2), SaI/N cells, which keep a relatively round shape and limited spreading surface, seem to develop weaker types of adhesions with the PDMS substrates. This altered amoeboid migration mode, with reduced translocation phase, leads to higher cell speeds in this case.
A possible explanation for the oriented cell displacement of 3T3 cells could be proposed by considering that the substrate micropattern determines the spatial distribution of the fibronectin coating and its subsequent clustering with the cell integrin receptors. Such a spatial distribution of extracellular matrix (ECM) proteins has been recently shown to play an essential role in the control of cell spreading, migration dynamic and displacement orientation by influencing the formation of focal adhesions [29]. Reciprocally, focal adhesions are known to serve as membrane sensing entities [30] that control locally and globally adhesion-mediated cell signaling through Rho and Rac small GTPases [31], a family of proteins that are well known regulators of the actin cytoskeleton. Thus the geometry and patterns of the adhesive sites imposed by the substrate topography most probably drive directional cell migration by modulating Rho and Rac signalling pathways and thus, cell polarity, adhesion and traction forces [32]. In our experiments, we observe preferential cell displacements along horizontal and vertical directions of the pillars substrate. Since pillar spacing along the diagonals is roughly 1.4 times larger than along the horizontal and vertical axes, the favoured cell displacements at direction of 0° and 90° that we observed in our experiments could be linked to a denser spatial distribution of integrin ligands along those directions.
Closer comparison of our results in the light of reported data is limited by the variability of the experimental set-ups that have been used and by the associated huge heterogeneity that has been observed in the cell responses [33]. Nevertheless, some aspects deserve to be discussed. First, our results on the cell polarisation on lines and pillars are consistent with the results reported on microgroove topography [34] and on columnar microstructures fabricated by polymer demixing [35] or on three-dimensional sharp-tip microtopography [13]. In each case a clear relationship between the morphological parameters of normal cells and the substrate topography appears (e.g. lines topography constrains the cells to polarise and pillar
topography favours cell spreading). Secondly, our results on cell motility are also consistent with the results obtained by Kaiser et al (2006) [34], who reported that 3T3 cells speeds are poorly affected by topographic changes of the extracellular environment. To our knowledge, no data is currently available on the speed of fibrosarcoma or other cancer cell types on micropatterned structures, which prevents further discussion.
Conclusions
This work provides for the first time a comparison of the synergetic influences of substrate rigidity and topography on normal and cancer cells behaviour. Our results highlight that a precise tuning between substrate micro-patterning and rigidity would allow for the control of cell morphodynamic parameters, such as cell surface, polarisation or speed. These can be readily incorporated into the design of microstructured substrates with tunable stiffness which can be utilized to direct cell response and associated mechanotransduction pathways. Specifically, the different morphological and dynamical behaviours of normal and cancer cells we observed in response to the rigidity and topography of the substrate may have strong insights in suggesting strategies for grading the metastatic phenotype of adherent cells, using calibrated micro-structured substrates. In addition, such microtechnologies may help the development and screening of new generation of drugs aiming at inhibiting cancer progression by discriminating cell sensitivity to the extracellular matrix topography and rigidity.
Acknowledgments
The mouse 3T3 fibroblasts cell line was kindly provided by Marc Block (Albert Bonniot Institute, Grenoble, France).
REFERENCES
[1] Thery M and Bornens M. Cell shape and cell division. Curr Opin Cell Biol 2006;18:648-657.
[2] Ingber DE. Mechanobiology and diseases of mechanotransduction. Ann Med 2003;35:564-577.
[3] Sapelkin AV, Bayliss SC, Unal B and Charalambou A. Interaction of B50 rat hippocampal cells with stain-etched porous silicon. Biomaterials 2006;27:842-846. [4] Tranqui L and Tracqui P. Mechanical signalling and angiogenesis. The integration of
cell-extracellular matrix couplings. C R Acad Sci III 2000;323:31-47.
[5] Huang S and Ingber DE. Cell tension, matrix mechanics, and cancer development. Cancer Cell 2005;8:175-176.
[6] Pelham RJ, Jr. and Wang Y. Cell locomotion and focal adhesions are regulated by substrate flexibility. Proc Natl Acad Sci U S A 1997;94:13661-13665.
[7] Ghosh K, Pan Z, Guan E, Ge S, Liu Y, Nakamura T, Ren XD, Rafailovich M and Clark RA. Cell adaptation to a physiologically relevant ECM mimic with different viscoelastic properties. Biomaterials 2007;28:671-679.
[8] Collin O, Tracqui P, Stephanou A, Usson Y, Clement-Lacroix J and Planus E.
Spatiotemporal dynamics of actin-rich adhesion microdomains: influence of substrate flexibility. J Cell Sci 2006;119:1914-1925.
[9] Stephanou A, Meskaoui G, Vailhe B and Tracqui P. The rigidity in fibrin gels as a contributing factor to the dynamics of in vitro vascular cord formation. Microvasc Res 2007;73:182-190.
[10] Fereol S, Fodil R, Labat B, Galiacy S, Laurent VM, Louis B, Isabey D and Planus E. Sensitivity of alveolar macrophages to substrate mechanical and adhesive properties. Cell Motil Cytoskeleton 2006;63:321-340.
[11] Yeung T, Georges PC, Flanagan LA, Marg B, Ortiz M, Funaki M, Zahir N, Ming W, Weaver V and Janmey PA. Effects of substrate stiffness on cell morphology,
cytoskeletal structure, and adhesion. Cell Motil Cytoskeleton 2005;60:24-34. [12] Sniadecki NJ, Desai RA, Ruiz SA and Chen CS. Nanotechnology for cell-substrate
interactions. Ann Biomed Eng 2006;34:59-74.
[13] Choi CH, Hagvall SH, Wu BM, Dunn JC, Beygui RE and CJ CJK. Cell interaction with three-dimensional sharp-tip nanotopography. Biomaterials 2007;28:1672-1679. [14] Charest JL, Garcia AJ and King WP. Myoblast alignment and differentiation on cell culture substrates with microscale topography and model chemistries. Biomaterials 2007;28:2202-2210.
[15] Wood MA, Wilkinson CD and Curtis AS. The effects of colloidal nanotopography on initial fibroblast adhesion and morphology. IEEE Trans Nanobioscience 2006;5:20-31. [16] Saez A, Ghibaudo M, Buguin A, Silberzan P and Ladoux B. Rigidity-driven growth
and migration of epithelial cells on microstructured anisotropic substrates. Proc Natl Acad Sci U S A 2007;104:8281-8286.
[17] Yim EK, Reano RM, Pang SW, Yee AF, Chen CS and Leong KW. Nanopattern-induced changes in morphology and motility of smooth muscle cells. Biomaterials 2005;26:5405-5413.
[18] Miller DC, Thapa A, Haberstroh KM and Webster TJ. Endothelial and vascular smooth muscle cell function on poly(lactic-co-glycolic acid) with nano-structured surface features. Biomaterials 2004;25:53-61.
[19] Semler EJ, Ranucci CS and Moghe PV. Tissue assembly guided via substrate
biophysics: applications to hepatocellular engineering. Adv Biochem Eng Biotechnol 2006;102:1-46.
[20] Baskar S, Glimcher L, Nabavi N, Jones RT and Ostrand-Rosenberg S. Major histocompatibility complex class II+B7-1+ tumor cells are potent vaccines for stimulating tumor rejection in tumor-bearing mice. J Exp Med 1995;181:619-629. [21] Lue SJ, Wei Yang S and Shin Chang Y. Sorption of organic solvents in poly(dimethyl
siloxane) membrane. II. Effect of sorption on the polymer crystals upon cooling. Journal of macromolecular science. Physics 2006;45:417-430.
[22] Fuard D, Tzvetkova-Chevolleau T, Decossas S, Tracqui P and Schiavone P. Optimization of Poly-Di-Methyl-Siloxane (PDMS) substrates for studying cellular adhesion and motility. (accepted in Microelectronics Engineering) 2007.
[23] Costa Lda F, Cintra LC and Schubert D. An integrated approach to the characterization of cell movement. Cytometry A 2005;68:92-100.
[24] DiMilla PA, Quinn JA, Albelda SM and Lauffenburger DA. Measurement of individual cell migration parameters for human tissue cells. AIChE Journal 1992;38:1092-1104.
[25] Jiang X, Bruzewicz DA, Wong AP, Piel M and Whitesides GM. Directing cell migration with asymmetric micropatterns. Proc Natl Acad Sci U S A 2005;102:975-978.
[26] Gustavsson P, Johansson F, Kanje M, Wallman L and Linsmeier CE. Neurite guidance on protein micropatterns generated by a piezoelectric microdispenser. Biomaterials 2007;28:1141-1151.
[27] Li S, Guan JL and Chien S. Biochemistry and biomechanics of cell motility. Annu Rev Biomed Eng 2005;7:105-150.
[28] Sheetz MP, Felsenfeld DP and Galbraith CG. Cell migration: regulation of force on extracellular-matrix-integrin complexes. Trends Cell Biol 1998;8:51-54.
[29] Cavalcanti-Adam EA, Volberg T, Micoulet A, Kessler H, Geiger B and Spatz JP. Cell spreading and focal adhesion dynamics are regulated by spacing of integrin ligands. Biophys J 2007;92:2964-2974.
[30] Geiger B and Bershadsky A. Assembly and mechanosensory function of focal contacts. Curr Opin Cell Biol 2001;13:584-592.
[31] Schwartz MA and Shattil SJ. Signaling networks linking integrins and rho family GTPases. Trends Biochem Sci 2000;25:388-391.
[32] Thery M, Pepin A, Dressaire E, Chen Y and Bornens M. Cell distribution of stress fibres in response to the geometry of the adhesive environment. Cell Motil
Cytoskeleton 2006;63:341-355.
[33] Peyton SR and Putnam AJ. Extracellular matrix rigidity governs smooth muscle cell motility in a biphasic fashion. J Cell Physiol 2005;204:198-209.
[34] Kaiser JP, Reinmann A and Bruinink A. The effect of topographic characteristics on cell migration velocity. Biomaterials 2006;27:5230-5241.
[35] Dalby MJ, Riehle MO, Johnstone HJ, Affrossman S and Curtis AS. Polymer-demixed nanotopography: control of fibroblast spreading and proliferation. Tissue Eng
LEGENDS
Fig. 1. Scanning electron microscopy images of micropatterned substrates with pillars (A) and lines (B). Contrast light microscopy images of 3T3 cells cultured on micropillars (C) and lines(D) respectively.
Fig. 2. Light microscopy images of the 3T3 fibroblast s(A,C,E) and SaI/N fibrosarcoma (B,D,F) cells observed on the three different types of substrates: unpatterned, pillars and lines respectively.
Fig. 3. Illustration of the fitting procedure used to check the relevance of the PRW model of migration and to identify the two model parameters. The mean squared displacement <d.d> (solid points) of 3T3 cell cultured on 2000kPa PDMS substrate, was computed as a function of the number of intervals with increasing width (see equ. (2)). Solid lines correspond to the best least-squared fit to the computed mean squared displacements in the limit td < (2/3)tend.
Fig. 4. Topography and rigidity effects on the cell surface and polarisation (presented by S9/L9
ratio) for 3T3-fibroblast and SaI/N-fibrosarcoma. The data present the results obtained from the topographied 500 and 2000kPa rigid substrates.
Fig. 5. Distribution of cells per speed intervals: 3T3 cells (left column), SaI/N cells (right column). Each bar represents the number of cells which have develop at least once the related cell speed during its migration. For each cell type, the distributions computed for two
different substrate rigidities (soft and very rigid) have been compared.
Fig. 6. Mean cell displacement effectiveness on soft substrates with different topographies. 3T3-fibroblasts (in yellow) and SaI/N-fibrosarcoma (in gray).
Fig. 7. Percentage of cells showing persistence time P* larger than 80 min in the 3T3 and SaI/N populations (n> 30) on unpatterned and pillars topographies for soft and rigid PDMS substrates.
Fig. 8. Distributions of the angular directions of the 3T3 and SaI/N cells trajectories on unpatterned (A) and linear substrates (B).
Fig. 9. Compilation of 30 trajectories exhibited by 3T3 cells migrating on rigid pillar substrates. The dominant directions of migration followed by the cells are highlighted by dotted lines. The pillar network orientation is indicated by the arrows.
Table 1
Fraction of the 3T3 and SaI/N (with grey background) cells having reached a steady-state below the polarisation threshold S/L ! "#$% and corresponding time tss to reach this steady-state. Values are percentage standard deviations of the mean.
Unpatterned topography Pillar topography Lines topography 83% 4%(3h) 90% 4%(3h) 90% 1%(3h) Soft 37% 1%(5h) 40% 2%(7h) 40% 1%(3h) 78% 3%(8h) 84% 3%(7h) 86% 6% (4h) Rigid 50% 2% (5h) 47% 4%(7h) 40% 1%(3h) 83% 2%(9h) 83% 7% (9h) 85% 3% (7h) Very rigid 55% 1% (5h) 56% 4%(7h) 54% 8% (3h) Table
Fig. 1.
1.66µm 1.5µmA
B
8µm 8µmC
D
FigureFig. 2.
U
n
p
a
tte
r
n
e
d
P
il
la
r
s
Li
n
e
s
20µm 20µm 20µm 20µm 20µm 20µm FigureFig. 3.
Fig. 4.
Fig. 5.
Cell speed (µm/min) Cell speed (µm/min)
Fig. 6.
Fig. 7.
Fig. 8.
Fig. 9.