HAL Id: hal-01383415
https://hal.archives-ouvertes.fr/hal-01383415
Submitted on 18 Oct 2016
HAL is a multi-disciplinary open access
archive for the deposit and dissemination of
sci-entific research documents, whether they are
pub-lished or not. The documents may come from
teaching and research institutions in France or
abroad, or from public or private research centers.
L’archive ouverte pluridisciplinaire HAL, est
destinée au dépôt et à la diffusion de documents
scientifiques de niveau recherche, publiés ou non,
émanant des établissements d’enseignement et de
recherche français ou étrangers, des laboratoires
publics ou privés.
indicators for dynamic systems computed using a digital
human model
Pauline Maurice, Vincent Padois, Yvan Measson, Philippe Bidaud
To cite this version:
Pauline Maurice, Vincent Padois, Yvan Measson, Philippe Bidaud. Experimental assessment of the
quality of ergonomic indicators for dynamic systems computed using a digital human model.
Interna-tional Journal of Human Factors Modelling and Simulation, Inderscience, 2016, 5 (3), pp.190 - 209.
�10.1504/IJHFMS.2016.10000531�. �hal-01383415�
Experimental assessment of the quality of ergonomic
indicators for dynamic systems computed using a
digital human model
P. MAURICE*a,b, V. PADOISa, Y. MEASSONb, and P. BIDAUDa,c
a
Sorbonne Universités, UPMC Univ Paris 06, CNRS, UMR 7222, Institut des Systèmes Intelligents et de Robotique (ISIR), F-75005, Paris, France b
CEA, LIST, Interactive Robotics Laboratory, Gif-sur-Yvette, F-91191, France c
ONERA, 91123 Palaiseau, France
Abstract
The growing number of musculoskeletal disorders in industry could be addressed by the use of collaborative robots, which allow the joint manipulation of objects by both a robot and a person. Designing these robots requires to assess the ergonomic benefit they offer. Current methods use a posteriori assessment, i.e. observation of a worker performing the task, and require a physical mock-up of the robot. Moreover, they exclude dynamic phenomena because their measurements require heavy instrumentation. However, collaborative robots are not static objects, but dynamic systems which motion influences and is influenced by the physical interaction with the worker. Plus, the worker him/herself is also a dynamic system, on which dynamic phenomena have ergonomic consequences, even without the presence of a collaborative robot. In order to perform more thorough assessments of the ergonomic performances of dynamic systems, it is proposed to use a dynamic digital human model (DHM) for the evaluation, associated with a dedicated ergonomic metric. This paper presents preliminary results on three ergonomic indicators formulated to meet the requirements of ergonomic evaluations of dynamic systems. They evaluate respectively the position of the worker, his physical effort and the energy spent during the task. The same manual task is performed by seven human subjects under different time, load and geometric constraints. Each performance is recorded and replayed with a dynamic DHM in a dynamic simulation framework, in order to calculate the values of the indicators. All three indicators are strongly affected by the geometric parameters in a way that is consistent with ergonomic guidelines. Besides, a linear correlation between the values of the indicators and the strenuousness perceived by the subjects is observed. Moreover, the results show that the relevance of an indicator is strongly affected by the task features, especially its duration. Future work will be directed towards automatic selection of relevant indicators for a given task.
Keywords: Ergonomics, Digital Human Model, Dynamic Motion Simulation, Motion Capture and Replay. 1. Introduction
Though working conditions have improved in de-veloped countries, work-related musculoskeletal dis-orders (MSDs) remain a major health problem. In 2005, MSDs represented 59% of the occupational diseases and affected over 35% of industrial workers in Europe (Schneider and Irastorza, 2010). In the US, the total cost of MSD has been estimated around $45 to 54 billion per year (National Research Council and Institute of Medicine, 2001). Hence decreasing MSD is a high-stakes socioeconomic issue.
The causes of MSDs are often multi-factorial and include different kinds of factors: personal, organi-zational, psychosocial and biomechanical (Schneider and Irastorza, 2010). However, the major risk factors are often biomechanical: most MSDs at least partly result from strenuous biomechanical demands caused
by physical work (Luttmann et al., 2003). Replacing men by robots to accomplish hard tasks might then be considered an option to decrease the prevalence of MSDs. But despite the growing robotization in industry, many tasks cannot be fully automatized because of their unpredictability or their technicality. A solution is to assist the worker with a collabora-tive robot, rather than replacing him. A collaboracollabora-tive robot enables the joint manipulation of objects with the worker and thereby provides a variety of benefits, such as strength amplification, inertia masking and guidance via virtual surfaces and path (Colgate et al., 2003). To ensure that the use of these devices do de-crease the risk of MSDs, an ergonomic assessment of the robot-worker system must be performed through-out the design process. Standard ergonomic methods are based on the observation of a worker performing
the task (Li and Buckle, 1999), and require a physical mock-up of the robot. Given that this assessment aims at guiding the design of the robot, it means a new prototype every time a mechanical parameter of the robot is changed, which is a significant limitation in terms of cost and time. Besides, these evaluations usually exclude dynamic phenomena that yet affect the risk of MSDs, because their measurements require heavy instrumentation of the worker. An alternative is to carry out the assessment within a digital world, where modifications are simpler, and many physical quantities can be accessed at lower cost.
Several tools exist that offer the possibility to perform ergonomic evaluations of a workplace in a virtual environment by simulating the worker with a digital human model (DHM): e.g. Delmia1, Jack (Raschke,
2004), Ramsis (Seidl, 2004), Sammie (Porter et al., 2004). The manikin is animated through motion capture data, direct or inverse kinematics, or pre-defined postures and behaviors. Various ergonomic assessment methods are included in these software products. The first class of methods estimates the level of risk depending on the exposure to the main MSD factors. The most widely known are RULA (Rapid Upper Limb Assessment), REBA (Rapid En-tire Body Assessment), OWAS (Owako Working Posture Analysis System), the OCRA index (Occu-pational Repetitive Action), or the OSHA checklist (Li and Buckle, 1999; David, 2005). The second class of methods consists of equations or tables that give psycho-physiological limits not to exceed in order to minimize the MSD risk during manual handling operations. The most famous are the NIOSH equation (Waters et al., 1993) and the Snook and Ciriello tables (Snook and Ciriello, 1991), which determine a maximum acceptable load weight depending on the task features.
Though a wide variety of methods are available, they are not suitable for the design of collaborative robots. Such robots must be optimized considering the whole activity and the whole human body. But the tasks which may be addressed by these robots are various and often complex, whereas the existing assessment methods are specific either to a type of activity and/or to a body part. So the evaluation of the entire activity will very likely require the use of several methods, the results of which are mostly not homogeneous and therefore cannot be compared. Moreover, what might be the main drawback of these observational methods is that they are static, meaning that dynamic phenomena are not taken into account. Yet it has been established that fast motions increase the risk of MSDs - even when there is no interaction with a robot - because of the efforts they generate in biolog-ical tissues. In collaborative robotics, evaluating the dynamic stages of the activity is even more important because, though designed to be so, the robot is never
perfectly backdrivable. Some phenomena can be hard to compensate, even with a dedicated control law. In this case manipulating the robot requires extra efforts from the worker. For instance, collaborative robots providing strength amplification usually are powerful thus heavy: they are highly inertial so leaving dy-namic stages out of the assessment can lead to an underestimation of the risk.
Beyond these methods associated with macroscopic human body modelling, some DHM tools provide very accurate biomechanical models including mus-cles, tendons, and bones, e.g. AnyBody (Damsgaard et al., 2006), OpenSim (Delp et al., 2007). They can calculate quantities such as muscle force or tendon length, which are closely linked to MSD (Luttmann et al., 2003), and sometimes even include dynamic ef-fects. But such models usually require to tune biome-chanical parameters, which cannot be properly done without subject specific knowledge of the human body. Besides, these tools provide a measurement for each muscle, tendon, etc. In order to represent the whole body situation these local scores have to be combined in a way that is left to the user to determine. This last criticism also applies to simpler models which provide local measurements such as forces in joints.
The work presented in this paper aims at devel-oping a DHM-based ergonomic assessment method fitted for collaborative robots design. This requires the development of both a dedicated ergonomic met-ric (what to measure) and a measuring tool (how to measure) which are suitable for evaluating the ergonomic performances of dynamic systems. Note that though this work targets collaborative robots, its scope is broader and actually addresses the more general issue of assessing ergonomic performances in dynamic situations. This paper focuses on the for-mulation of ergonomic indicators and their use with a dynamic DHM. In section 2 three indicators are defined in order to meet the requirements of collab-orative robotics. An experimental validation is con-ducted to ensure that they are ergonomically consis-tent: the influence of various work conditions on the indicators values is studied. The protocol is described in section 3. The results are presented in section 4 and discussed in section 5. Section 6 concludes on the relevance of these indicators and the associated DHM and proposes some perspectives about their use within a global assessment method.
2. Definition of indicators
Ergonomic indicators should account for the main MSD risk factors which are strong postural demands, high intensity forces, long exposure duration and highly repetitive exertions. The repetitiveness as well as the effect of static work (i.e. maintaining a posture
without moving) are omitted in this work. Indeed, though repetitiveness and postural change can easily be extracted from the simulation, their biomechanical impacts on the human body are hard to quantify precisely. It requires to understand how these time-frequency factors affect the human physical capaci-ties, which is closely related to the open problem of fatigue modeling and is out of scope here. It should nevertheless be noted that the purpose here is not the assessment of the absolute level of risk for the worker, but the comparison of assistive devices which are not expected to dramatically affect the work rate. The instantaneous postural risk includes two phe-nomena: the proximity to joint limits and the effort needed to maintain the posture. In reality muscular effort is not due solely to gravity, but also to the dynamic forces associated with the motion, and to the external force caused by the interaction with an object. The former are hardly ever taken into account in existing methods, while the accuracy with which the latter is considered varies much from a method to another. In order to accurately evaluate the effect of an external force on the musculoskeletal system, the repartition of the effort among the whole musculoskeletal system which depends on the posture -must be computed. In this work a DHM is used to simulate the worker, so unlike with a real human, the actuation forces (joint torques or muscle forces, de-pending on the level of detail of the model) can easily be accessed without requiring heavy instrumentation. A simple rigid-body model with hinge joints actu-ation2 is chosen (because as stated previously very
detailed models are quite difficult to use), so these forces correspond to joint torques. Since the DHM is animated within a dynamic simulation, the joint torques result from the inverse dynamical model of the manikin. They include all three effects: gravity, dynamics, and external force. Despite their various origins, these three phenomena all have the same consequence on the musculoskeletal system, so they are considered together in the risk assessment. On the contrary, the effect of the proximity to joint limits is of a different kind. Though the combination of several MSD factors increases the risk, the way they interact is not well-established. So it is preferred here to evaluate them separately rather than trying to mix them together.
Since disorders may appear as soon as the demands exceed the worker’s capacities, a way to estimate the risk is to compare each demand with its limit value. Since DHM ergonomic assessments - like most er-gonomic studies - are at a population level and not at a personal level, average capacities for joint range of motion and maximal joint torques are used (Holzbaur et al., 2005; Chaffin et al., 2006). The influence of
joint angles and velocities on maximal joint torques is currently omitted, though models of this phenomenon can be found in the literature (Chaffin et al., 2006). However the influence of force-induced fatigue is included. Instead of being constant throughout the task, the torque capacity of joint i (i representing successively each hinge joint of the human body model) is affected by the force exertion according to the following evolution law (Ma et al., 2009):
τimax(t) = τimax(0) e−k
∫t
0
τi(u)
τ maxi (0)du (1)
where k is a fatigue rate assigned to 1 min−1, τmax
i (0) is the nominal torque capacity of joint i
(before any effort), and τmax
i (t) and τi(t) are
respec-tively the torque capacity and the torque exerted by joint i at time t.
For both the joint angles and torques, the resulting normalized demands on every joint are added to form a score representing the whole body situation. This instantaneous score is time-integrated to provide a score representing the whole activity, taking into ac-count the duration factor. The resulting indicators are Iq for the joint positions and Iτfor the joint torques:
Iq = 1 N N ∑ i=1 ∫ T 0 ( qi(t)− qneutrali qmax i − q neutral i )2 dt (2) Iτ= 1 N N ∑ i=1 ∫ T 0 ( τi(t) τmax i (t) )2 dt (3)
where N is the total number of joints in the body model, T is the duration of the task, qi(t) and τi(t)
are the angle and the torque of joint i at time t, qmax i
is the joint angle capacity (joint limit), qneutral
i is the
neutral position of the joint, and τmax
i (t) is the joint
torque capacity at time t defined in equation 1. The joints neutral positions qneutral
i are defined
accord-ing to the REBA comfort zones, by takaccord-ing the joint angles associated with a minimum score in the REBA evaluation. The resulting posture is standing upright, arms along the torso, elbows flexed at 80°. This so-called (in this work) ”neutral ergonomic posture” is defined by considering only the stress due to the proximity to joint limits: the effort needed to maintain the posture is not taken into account, since such effort is accounted for in the torque indicator.
In the literature, fatigue caused by physical work is often determined through metabolic energy expendi-ture (Garg et al., 1978). Metabolic energy expendiexpendi-ture computation is included in some DHM software (e.g. Jack, EMA (Fritzsche et al., 2011)), but it is restricted to specific tasks for which tables are available (or it requires a very detailed biomechanical model of the human body). Here, the torque indicator Iτ (Eq. 3)
2Note that this rigid-body model necessarily leaves aside the
effects of additional MSDs factors such as temperature and vibra-tions.
already indirectly represents energy consumption, in particular in static postures. In order to directly take into account the energy consumption during motion, another indicator based on joint power is added:
Ip= 1 N N ∑ i=1 ∫ T 0 | ˙qi(t) τi(t)| dt (4)
where ˙qi(t) is the velocity of joint i at time t. Though
it does not strictly correspond to metabolic energy expenditure, the association of Iτand Ipgives an idea
of the macroscopic energetic consumption. 3. Validation of indicators
An experimental validation is carried out to ensure that the above-defined indicators correctly account for the relative exposure level to MSD risks in dy-namic situations (i.e. in tasks including motion). Hu-man subjects perform a Hu-manual task in various con-ditions while their movements and external forces are recorded. Each case is replayed with a dynamic DHM, in order to compute the corresponding indi-cators values. Their variations are qualitatively in-vestigated to highlight their dependence on the task conditions.
3.1. Experimental protocol
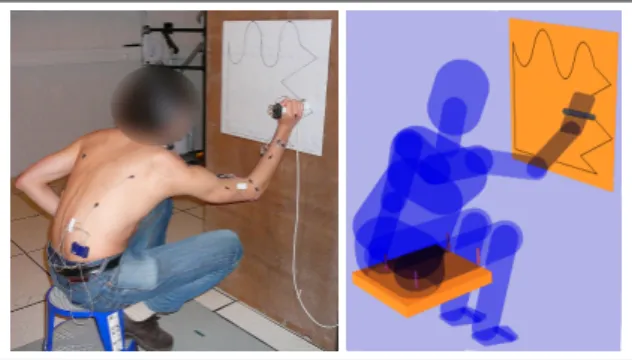
a) Task description: A generic manual task is performed3. A seated subject moves a tool along a displayed path while pushing on the work surface with it. The tool is a 200 g and 15 cm long handle held with the whole right hand. The path is a 50 cm square. Two sides are replaced respectively with a sinusoidal line and a sawtooth line, to accentuate the joints dy-namics (see Fig. 2). Its size is chosen so that the task demands wide joint clearance yet remains feasible by a seated subject. Performing the task means following the entire path once. The subject is instructed not to use his left arm nor his legs.
b) Parameters: Four parameters vary throughout the experiment: the orientation of the work surface, the position of the seat relative to the work area, the allotted time and the magnitude of the force to be applied.
Table 1: Values of the parameters describing the position of the seat. H stands for Horizontal and V for Vertical: they refer to the orientation of the work plane.
Height Distance Orientation
low: 38 cm (H) close: 20 cm 45° right
(V) close: 45 cm
medium: 52 cm (H) far: 45 cm 45° left
(V) far: 75 cm
high: 66 cm 0° (face on)
The work surface is either horizontal or vertical. The various positions of the worker’s seat are described in Fig. 1 and Table 1. The close and medium values are chosen to match ergonomic guidelines for seated work (Chaffin et al., 2006). All combinations are tested except horizontal - close - high because the legs do not fit under or in front of the table, and 45° right is only done for close - medium for reachability reasons.
From the right work plane distance height From above orientation work plane distance
From the left work plane distance height From behind work plane orientation height path path path path
Figure 1: Definition of the parameters describing the posi-tion of the worker’s seat for the horizontal (top) and vertical (bottom) work planes. The distance parameter is measured from the center of the subject’s seat to the border of the path closest to the subject.
The allotted time and the magnitude of the force define three varieties of the original task, described in Table 2 as neutral, force and velocity. The force magnitude in the ”force” task is slightly lower than the maximal force capacity, calculated for this par-ticular movement according to (AFNOR, 2008). The subject is provided with an audio feedback of the exerted force: low-pitched, high-pitched or no sound when the force is respectively too weak, too strong or within the imposed range. The allotted time is displayed through a progress bar on a screen, and the subjects are instructed to move the tool as regularly
3It should be noted that the present experiment does not include
interaction with a robot or other dynamic systems. However, as mentioned in section 1, the proposed method addresses any situ-ation including dynamic phenomena, starting with tasks requiring motion of the worker.
as possible along the path.
All three tasks - neutral, force and velocity - are performed in random order for both orientations of the work plane and for each seat position. Breaks are regularly allowed to prevent fatigue. The task (following the path once) is short enough and the breaks long enough so that force capacities are fully recovered at the beginning of each new task (i.e. the fatigue model of Eq. 1 is used only within one task but not across tasks).
Table 2: Values of the time and force constraints.
Task Allotted Mean hand Force
kind time velocity magnitude
neutral 30 s 0.085 m.s−1 none
velocity 5 s 0.5 m.s−1 none
force 30 s 0.085 m.s−1 18 N± 1.96 N
c) Subjects: Seven healthy subjects (5 males and 2 females) ranging from 23 to 28 years old perform the experiment for the horizontal work plane, and three of them also for the vertical work plane. Table 3 describes their physical features.
Their movements are recorded with a CodaMotion4
motion capture device. The subjects are equipped with markers on their torso, right arm and hand, and on the tool. The seat is set on a force platform to measure the ground contact forces. The contact forces with the work surface are measured through a force sensor embedded in the tool.
During the experiment, the subjects give each gesture a mark between 0 and 10, depending on how strenu-ous the task is perceived.
Table 3: Physical features of the human subjects: stature and body mass index (bmi).
Stature (m) Min Max Mean Std dev
Horizontal plane 1.53 1.83 1.71 0.11
Vertical plane 1.53 1.79 1.63 0.12
BMI (kg.m−2)
Min Max Mean Std dev
Horizontal plane 20.9 33.3 24.5 3.9
Vertical plane 21.8 33.3 25.6 5.4
3.2. Indicators calculation
a) Simulation framework: Once recorded and fil-tered, the data are imported in the XDE simulation framework developed by CEA-LIST5. It allows for
dynamic simulation and provides a DHM (see Fig. 2) which can be animated through several customizable ways.
The model consists of 20 joints and 45 degrees of freedom. Each DoF is a hinge joint controlled by a sole actuator. This hinge joint representation is a simplified model, therefore the joint torques of the model do not strictly correspond to the efforts in real
human joints (for instance, the dynamics of muscles activation is not rendered). However, it should be noted that the proposed indicators are not dependent on the human body model used for the simulation: they can equally be used with a more detailed model if available. The human model is automatically scaled according to the stature and mass of the subject. Each body segment is further manually modified to match the subject morphology.
Figure 2: Left: A human subject performs the task while his motion is recorded. Right: The motion is replayed with a virtual manikin within a dynamic simulation framework. b) Manikin control: The motion is replayed by solving an optimization problem to determine the actuation variables (joint accelerations, joint torques and ground contact forces) which allow to follow the markers trajectories at best, while respecting physical and biomechanical constraints. The LQP controller framework developed by Salini (Salini et al., 2011) is used. Mathematical formulation of the problem is given in equation 5. argmin X ∑ i ωiTi(X) s.t. M (q) ˙ν + C(q, ν) + g(q) = S τ−∑ j JcTj(q)wcj GX ⪯ h (5) where τ is the joint torques, wcthe contact forces, q the generalized coordinates of the system (i.e. vector of joint positions), ν the generalized velocity con-catenating the floating-base twist and the joint ve-locities ˙q, andX = (τT, wcT, ˙νT)T. The equality constraint is the equation of motion: M is the inertia matrix of the system, C the vector of centrifugal and Coriolis forces, g the vector of gravity forces, S the actuation selection matrix, and JT
c the Jacobian
of contacts. The inequality constraint includes the bounds on the joint positions, velocities, and torques (all formulated with the problem variables τ and ¨q), and the contact existence conditions for each contact point, according to the Coulomb friction model:
Ccjwcj ≤ 0 ∀j
Jcj(q) ˙ν + ˙Jcj(ν, q)ν = 0 ∀j
(6)
4www.codamotion.com 5www.kalisteo.fr/lsi/en/aucune/a-propos-de-xde
where cj is the jth contact point, Ccj the corre-sponding linearized friction cone, and wcjthe contact wrench. Note that the values of the contact forces in-suring the balance of the system (here the interaction between the seat and the DHM’s thighs) do not need to be known beforehand: they are automatically com-puted in the optimization, in order to be compatible with the system dynamics and the effort exerted by the hand on the tool (which needs to be given as an input of the optimization) .
The objective function is a weighted sum of tasks Ti - defined as functions of the optimization
vari-ables - representing the squared error between a de-sired acceleration or wrench and the system acceler-ation/wrench (ωiare the weighting coefficients). The
solution is then a compromise between the different tasks, based on their relative importance. The follow-ing tasks are defined (tasks can be defined both in joint and in operational spaces):
• Operational space acceleration task ∥¨Xi− ¨X∗i∥ = ∥Jiν + ˙˙ Jiν− ¨X∗i∥
2
• Joint space acceleration task ∥¨q − ¨q∗∥2
• Operational space wrench task ∥wi− w∗i∥
2
• Joint torque task ∥τ − τ∗∥2
where ¨Xiis the Cartesian acceleration of body i, and withe wrench associated with body i. The superscript
∗ refers to the desired acceleration/force, which are
defined by a proportional derivative control. For in-stance, the desired operational acceleration is:
¨ X∗i = ¨X goal i + K Xi v ( ˙X goal i − ˙Xi) + KpXi(X goal i − Xi) (7) where KXi
p and KvXiare the proportional and
deriva-tive gains for the considered task (they are parameters set by the user). The superscriptgoalrefers to the tar-get value for the body or joint. Though the tasks need to be described in terms of the optimization variables (joint accelerations, joint torques and contact forces) for the problem to be solved, position or velocity can also be controlled with the proposed task model. For instance, an operational space position task (put body i at a given Cartesian position, with null velocity and acceleration) is defined by setting ¨Xgoaland ˙Xgoalto zero. Similarly, the desired joint acceleration is:
¨
q∗= ¨qgoal+ Kvq( ˙qgoal− ˙q) + K q
p(qgoal− X) (8) where Kp
pand Kvpare the proportional and derivative
gains for the considered task.
In this work, the operational space acceleration tasks are defined from the markers trajectories. The weights are chosen accordingly to the technique by Demircan (Demircan et al., 2010), though here
weighted instead of hierarchical control is used. The markers associated with limbs extremities and the pelvis are given the biggest weight, then the weight decreases when the body is further away from the extremities. Contrarily to inverse dynamics methods, the contact forces with the seat are not imposed here, but result from the optimization problem. So the only Cartesian force task is the contact force with the tool. The desired value is given by the force sensor mea-surement. Low weight joint position tasks are added for the body parts that are not controlled through the markers positions, so that there is no unwanted motion. Finally there is a joint force task which aims at minimizing the joint torques to prevent useless effort. Its weight is very small since it must not hinder the other tasks.
4. Results
The following results depict the variations of the indicators depending on the task features. Values are averaged on all subjects since the indicators are not meant to be subject specific. For the sake of clarity, the values in each figure are normalized by the min-imum and maxmin-imum values of the addressed case. Note that unless explicitly stated, the duration of the task is not normalized for the computation of the indicators.
4.1. Position Indicator
A linear correlation is observed between the posi-tion indicator values and the strenuousness perceived by the subjects when considering tasks of similar duration. The Pearson’s correlation coefficients are respectively 0.86 (p=0.015), 0.89 (p<0.01) and 0.87 (p<0.01) for the neutral, force and velocity tasks con-sidered separately, and 0.84 (p<0.01) for the neutral and the force tasks considered together. However this coefficient drops to 0.54 (p<0.01) when the velocity task, which is approximately 6 times shorter than the others, is added. This suggests that the proposed position indicator is only relevant to compare tasks of similar duration.
Comparison within a same task:
• Seat distance and orientation: The indicator is higher (t-test, p = 0.003) when the subject sits further away from the work area (see Fig. 3), because he has to deviate much from the ”neutral ergonomic posture” to reach the path. What actually matters is the distance from the path to the right hand, which handles the tool. This explains why the left orienta-tion seems better than the face one (see Fig. 1), and why the right orientation, though associated with a close position, is roughly equivalent to the far cases. • Seat height: In close position, the best seat height according to the indicator is the medium one when the work plane is horizontal, and the high one when it is vertical. These results are ergonomically consistent: in the horizontal case, the medium height was
cho-sen in accordance with ergonomic guidelines; in the vertical case, the high height requires less work with the arm raised, a position discouraged by ergonomic guidelines.
• Work plane orientation: For a same position of the seat, the indicator values are significantly higher (t-test, p < 0.01) in the vertical case than in the hori-zontal one (see Fig. 3). The center of the path is set higher in the vertical case, so it requires the subject to work with the arm raised. Besides the imposed tool orientation (axis normal to the work plane) and whole hand grasp lead to unusual arm angles when the work plane is vertical (elbow higher than shoulder).
Seat distance and orientation
Seat height Work plane orientation
Fr - Fc Cl - Fc Cl - Rg Cl - Lf Fr - Lf Lw Md Hg Lw Md Hg Vertical Horizontal Lf : Left Fc : Face Rg : Right Fr : Far Cl : Close Lw : Low Md : Medium Hg : High Min Max 2.3 5 4.8 2.5 3.5 3.5 4 1 1.8 4.4 4.8 7 5.3 7.3 5.7 3.4 3.4 6.3 6 6.7 3.4 7.3 6.3 4.3 Strenuousness
Figure 3: Variations of Iqdepending on the position of the subject’s seat and the work plane orientation (neutral task). The numbers correspond to the strenuousness perceived (between 0 and 10) by the subjects.
Fr - Fc Cl - Fc Cl - Rg Cl - Lf Fr - Lf Lw Md Hg Lw Md Hg Min Max Lw Md Hg
Artificial Velocity Neutral Force
Seat distance and orientation Seat height Task 7 5.3 7.3 5.7 3.4 3.4 6.3 6 6.7 3.4 7.3 6.3 4.3 9.5 6.7 10 7.7 5.3 5.7 8.3 8 8.7 4.3 9.7 8 6 Lf : Left Fc : Face Rg : Right Fr : Far Cl : Close Lw : Low Md : Medium Hg : High Strenuousness
Figure 4: Variations of Iq depending on the position of the subject’s seat and the kind of task: neutral, force or artificial velocity (vertical work plane). The numbers cor-respond to the perceived strenuousness. The strenuousness is not displayed for the artificial velocity task since this task has not been performed by human subjects, therefore its strenuousness has not been evaluated (and normalizing the perceived strenuousness would be meaningless).
Comparison between different tasks: As stated be-fore, the position indicator does not seem suitable to compare tasks which duration differ significantly. Therefore, in this section, the durations of the tasks are artificially equalled so that the results of the three tasks can be compared. To this purpose, an artificial velocity task is created by replaying the whole gesture with the DHM six times consecutively (the real veloc-ity tasks is six times shorter than the neutral and force
tasks). Note that this artificial velocity tasks is an approximation since the simulated gesture is identical the six times, whereas a real subject would probably show variations in his/her gesture. The artificial ve-locity task results in the smallest values of the position indicator (see Fig. 4). Actually, the allotted time for one loop on the path is so short that the path has to be smoothed, thus requiring less extreme joints angles. On the other hand the difference between the neutral and force tasks is not statistically significant. Despite the force exertion, the subjects do not modify their posture much, either because it is already strongly constrained by the imposed hand trajectory and seat position, or because the demanded external force is small enough not to require any change in the posture. 4.2. Torque Indicator
A good correlation between the torque indicator values and the perceived strenuousness is observed within a same task (Pearson’s coefficient equals re-spectively 0.81 (p<0.01), 0.84 (p<0.01), and 0.85 (p<0.01) for the neutral, force, and velocity tasks) or when the neutral and force tasks are considered together (Pearson’s coefficient equals 0.81 (p<0.01)). But the correlation coefficient drops to 0.59 (p<0.01) when all three tasks are considered together. Simi-larly to the position indicator, the proposed torque indicator is not suitable to compare tasks of different durations.
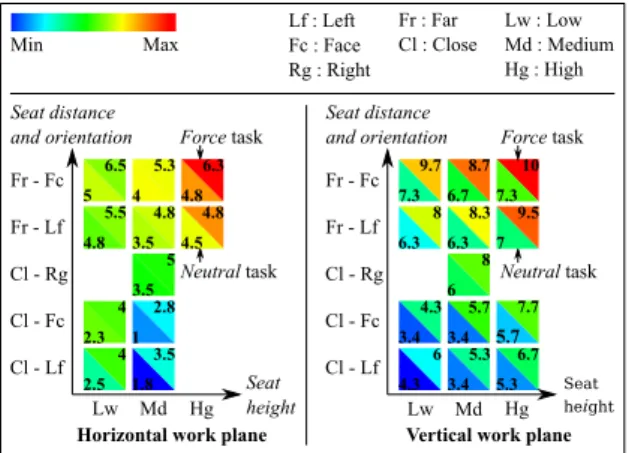
Comparison within a same task: The torque indica-tor is highly affected by the position of the subject rel-ative to the work area, because of the effect of gravity on his body segments (see Fig. 5). The further away the seat is from the work plane, the more the subject must deviate from an upright position, needing higher joint torques to maintain this posture.
Min Max Lf : Left Fc : Face Rg : Right Fr : Far Cl : Close Lw : Low Md : Medium Hg : High
Horizontal work plane
Seat height Seat distance and orientation Lw Md Hg Fr - Fc Cl - Fc Cl - Rg Cl - Lf Fr - Lf Force task Neutral task 4 6.5 5.5 4 5.3 5 4.8 2.8 3.5 4.8 6.3 2.3 5 4.8 2.5 4 3.5 3.5 1 1.8 4.5 4.8 Lw Md Seat distance and orientation Hg Fr - Fc Cl - Fc Cl - Rg Cl - Lf Fr - Lf Seat height Force task
Vertical work plane
7 5.3 7.3 5.7 3.4 3.4 6.3 6 6.7 3.4 7.3 6.3 4.3 9.5 6.7 10 7.7 5.3 5.7 8.3 8 8.7 4.3 9.7 8 6 Neutral task
Figure 5: Variations of Iτ depending on the external force and the seat position. Left: horizontal work plane. Right: vertical work plane. The numbers correspond to the per-ceived strenuousness.
Comparison between different tasks: In this sec-tion, the artificial velocity task (where the motion is replayed six times consecutively with the DHM) is considered instead of the real velocity task, in order to compare tasks of similar durations. Indeed, as men-7
tioned above, the torque indicator seems suitable only to compare tasks of similar durations.
• External force: When the work plane is vertical the torque indicator of the force task is significantly higher (p = 0.002) than the one of the neutral task, whereas they are not significantly different (p = 0.28) in the horizontal case. This can be explained by the fact that in the horizontal case, gravity helps pushing downwards on the workplane. In the neutral task subjects need to exert an upward torque to counter the effect of gravity and maintain their arm, whereas in the force task, the arm weight is useful to ease the downward pushing effort and therefore does not need to be compensated in the same way. This phe-nomenon does not exist for the vertical workplane, since the direction of gravity and of the pushing force are orthogonal. Fr - Fc Cl - Fc Cl - Rg Cl - Lf Fr - Lf Lw Md Hg Lw Md Hg Min Max Lw Md Hg
Artificial Velocity Neutral Force
Seat distance and orientation Seat height Task 7 5.3 7.3 5.7 3.4 3.4 6.3 6 6.7 3.4 7.3 6.3 4.3 9.5 6.7 10 7.7 5.3 5.7 8.3 8 8.7 4.3 9.7 8 6 Lf : Left Fc : Face Rg : Right Fr : Far Cl : Close Lw : Low Md : Medium Hg : High Strenuousness
Figure 6: Variations of Iτ depending on the seat position for all three tasks velocity, neutral and force (vertical work plane). The numbers correspond to the perceived strenuous-ness. The strenuousness is not displayed for the artificial velocity task since this task has not been performed by human subjects, therefore its strenuousness has not been evaluated (and normalizing the perceived strenuousness would be meaningless).
• Speed of motion: The torque indicator of the ar-tificial velocity task is significantly higher (p = 0.019) than the one of the neutral task, because the faster dy-namics of the movement induces higher joint torques (see Fig. 6). However, according to the torque in-dicator, this increase in the joint torques is not as important as the one due to the external load in the force task.
4.3. Power Indicator
Contrarily to the two previous indicators, the correla-tion between the power indicator and the strenuous-ness is fairly good when all three tasks are considered together (Pearson’s coefficient equals 0.75 (p=0.04)), and does not improve when each task is considered separately (Pearson’s coefficients equal respectively 0.71 (p=0.04), 0.86 (p=0.02) and 0.70 (p=0.03) for the neutral, force and velocity tasks). This suggests that the power indicator is suitable to compare tasks of different duration.
Comparison between different tasks: In this
sec-tion, the real velocity task (where the motion is re-played only once) is considered, since there is no need to equal the tasks durations with the power indicator. • Speed of motion: Though the velocity task lasts much less than the two others, its power indicator is only slightly lower (see Fig. 7). This is explained by the fact that the joint velocities are much higher in the velocity task, resulting in a much higher instantaneous joint power compared to the neutral and force tasks. The kinetic energy spent during the whole task is therefore about the same in all three tasks, but in the velocity task it results from a high power during a short time, whereas in the neutral and force tasks, it results from a lower power during a longer time.
• External force: Contrarily to the torque indica-tor (see Fig. 5 left), the power indicaindica-tor of the force task is often lower than the one of the neutral task, especially when the seat is far. This result is quite unexpected because a same allotted time and a very similar posture (see section 4.1.) should lead to same joint velocities for both tasks, and therefore Iτand Ip
should have similar variations.
This difference is probably due to the fact that the allotted time is not strictly respected (note that the task duration is not normalized in the indicators com-putation). Because the time constraint is not displayed on the path itself, the subject tends to move slightly slower in the force task to better control the force magnitude (especially when his/her posture makes it hard to control). The joint velocities are then slightly smaller, and so is the joint power, given that the joint torques are not very different in the neutral and force tasks for the horizontal plane (see section 4.2.).
Fr - Fc Cl - Fc Cl - Rg Cl - Lf Fr - Lf Lw Md Hg Lw Md Hg Min Max Lw Md Hg
Velocity Neutral Force
Seat distance and orientation Seat height Task Lf : Left Fc : Face Rg : Right Fr : Far Cl : Close Lw : Low Md : Medium Hg : High Strenuousness 2.3 5.3 4.5 2.3 4 4 2.5 1 1.8 4 5 4 6.5 5.5 4 5.3 5 4.8 2.8 3.5 4.8 6.3 2.3 5 4.8 2.5 4 3.5 3.5 1 1.8 4.5 4.8
Figure 7: Variations of Ipdepending on the seat position for all three tasks velocity, neutral and force (horizontal work plane only). The numbers correspond to the perceived strenuousness.
5. Discussion
According to the previous results, the proposed indi-cators account quite correctly for the way a task is performed. Their main variations are ergonomically, or at least physically, consistent, and the few unex-pected results seem to come from ill-adapted choices in the task definition (external force magnitude and direction, display of the time constraint) rather than
from the indicators themselves.
However, all the indicators are not equivalent de-pending on the task features (i.e. on what is com-pared). According to the correlation with the stren-uousness, the position and torque indicators do not seem suitable to compare tasks of different durations. On the contrary, this remark does not apply to the power indicator. On the other hand, when consid-ering tasks of similar duration, the position and the torque indicators generally account more accurately for the strenuousness perceived by the worker than the power indicator. Therefore, previously to carrying out a comparison, it is necessary to select the relevant, i.e. the most discriminating, indicators for the given conditions.
In most cases there may be several relevant indica-tors. When addressing the position of the seat, the variations of the position and the torque indicators are mainly similar (the closer, the better) and they both show a good correlation with the strenuousness, so one could be tempted to keep only one of them for their study. However these indicators are not redun-dant and sometimes bring antagonistic conclusions: for the best seat distance (close - left), the best seat height is the high one according to the position indi-cator whereas it is the low one according to the torque indicator (see Fig. 3 and 5 right). This opposition may explain the disagreement between subjects’ prefer-ence - i.e. perceived strenuousness - (low seat) and the position indicator recommendations (high seat) in the close cases. Indeed, the strenuousness sum-marizes different kinds of demands (posture, static effort, dynamic effort...) in one value and is therefore an ”aggregated” indicator. Whereas the ergonomic indicators proposed in this work consider different kinds of demands separately. More generally, the design of a workstation or a collaborative robot -usually results from trade-offs. So this work does not mix several kinds of demands within a sole indica-tor, because considering antagonistic effects within a same task is easier this way. Several indicators can be used in a multi-criteria optimization in order to design a robot which is as good as possible regarding every MSD risk factors.
Finally, it should be noted that the indicators pro-posed in this work leave out some important phenom-ena related to MSD. In particular the co-contraction of antagonistic muscles, which occurs mainly in tasks requiring high precision (Gribble et al., 2003), is not modelled. Consequences of this omission can be observed in the linear relation between the strenuous-ness and the torque indicator: the y-intercept is bigger in the force task (2.8) than in the neutral task (1.8). The increase in the joint torques during the force task is underestimated in the simulation because it only takes into account the external load (the manikin is not preoccupied with precision), whereas the human subjects must accurately control the force they apply
on the work plane, which requires an additional effort due to co-contraction.
The omission of the co-contraction phenomenon is not due to the indicator formula, but to the repre-sentation of the human body, in which each joint is controlled by a unique actuator. However this phe-nomenon could be modelled without changing the body model, by using a variable impedance in the manikin control (i.e. adapting the gains Kp and Kd
in equations 7 and 8). A higher stiffness allows a more accurate gesture and corresponds to a higher effort. But this has not been implemented since it requires a control law performing trade-offs between the precision and the exertion, which is out of scope here. Nevertheless, the indicators proposed in this work are not intended for medical purpose (e.g. real exposure level to MSD risk factors) but for guiding the design of assistive devices, so this evaluation, though incomplete, is still a first step in the right direction.
6. Conclusion
Three ergonomic indicators adapted to the needs of collaborative robotics have been proposed. They con-sider the position and the effort of the worker, and the energy he spends performing a task. An experimental validation has been carried out on seven subjects, in order to study the influence of several task features (geometric, force and time constraints) on the indi-cators values. The subjects’ movements have been recorded with a motion capture system, and replayed with a dynamic DHM to compute the indicators. The indicators show a linear correlation with the strenu-ousness perceived by the subjects, and their variations are consistent with ergonomic guidelines and physi-cal considerations.
Those results suggest that the proposed indicators could be used to compare collaborative robots in the design process. However, each indicator provides different information, so their relevance is highly dependant on the task considered. Further work will be directed towards the development of a method for selecting the relevant set of indicators depending on the task features, in order to perform a multi-objective optimization.
References
AFNOR , 2008. NF EN 1005 Safety of machinery -Human physical performance. Association francaise de normalisation.
Chaffin DB, Andersson GBJ, and Martin BJ, 2006. Occupational biomechanics. Wiley, 4th edition. Colgate JE, Peshkin M, and Klostermeyer SH, 2003. Intelligent assist devices in industrial applications: a review. In: Proceedings of the IEEE/RSJ International Conference on Intelligent Robots and Systems, 2516-2521.
Damsgaard M, Rasmussen J, Christensen ST, Surma E, and de Zee M, 2006. Analysis of musculoskeletal systems in the AnyBody Modeling System. Simulation Modelling Practice and Theory, 14(8), 1100-1111. David GC, 2005. Ergonomic methods for assessing ex-posure to risk factors for work-related musculoskeletal disorders. Occupational Medicine, 55(3), 190-199. Delp SL, Anderson FC, Arnold AS, Loan P, Habib A, John CT, Guendelman E, and Thelen DG, 2007. Opensim: open-source software to create and analyze dynamic simulations of movement. IEEE Transactions on Biomedical Engineering, 54(11), 1940-1950. Demircan E, Besier T, Menon S, and Khatib O, 2010. Human motion reconstruction and synthesis of human skills. In: Advances in Robot Kinematics: Motion in Man and Machine, 283-292. Springer.
Fritzsche L, Jendrusch R, Leidholdt W, Bauer S, Jäckel T, and Pirger A, 2011. Introducing ema (editor for manual work activities)–a new tool for enhancing ac-curacy and efficiency of human simulations in digital production planning. In: Digital Human Modeling, 272–281. Springer.
Garg A, Chaffin DB, and Herrin GD, 1978. Prediction of metabolic rates for manual materials handling jobs. The American Industrial Hygiene Association Journal, 39(8), 661-674.
Gribble PL, Mullin LI, Cothros N, and Mattar A, 2003. Role of cocontraction in arm movement accuracy. Jour-nal of Neurophysiology, 89(5), 2396-2405.
Holzbaur KRS, Murray WM, and Delp SL, 2005. A model of the upper extremity for simulating muscu-loskeletal surgery and analyzing neuromuscular con-trol. Annals of biomedical engineering, 33(6), 829-840. Li G and Buckle P, 1999. Current techniques for assess-ing physical exposure to work-related musculoskeletal risks, with emphasis on posture-based methods. Er-gonomics, 42(5), 674-695.
Luttmann A, Jäger M, Griefahn B, Caffier G, Liebers F, and Steinberg U, 2003. Preventing Musculoskeletal
Disorders in the Workplace. World Health Organiza-tion. Protecting Workers’ Health Series, 5.
Ma L, Zhang W, Chablat D, Bennis F, and Guillaume F, 2009. Multi-objective optimisation method for posture prediction and analysis with consideration of fatigue effect and its application case. Computers & Industrial Engineering, 57(4), 1235-1246.
National Research Council and Institute of Medicine , 2001. Musculoskeletal Disorders and the Workplace: Low Back and Upper Extremities. National Academy Press.
Porter J.M., Case K., Marshall R., and Freer M., 2004. Sammie: A computer-aided ergonomics design tool. In: Working postures and movements – Tools for evalua-tion and engineering, 431–437. CRC Press.
Raschke U., 2004. The jack human simulation tool. In: Working postures and movements – Tools for evalua-tion and engineering, 431–437. CRC Press.
Salini J, Padois V, and Bidaud P, 2011. Synthesis of Complex Humanoid Whole-Body Behavior: a Focus on Sequencing and Tasks Transitions. In: Proceedings of the IEEE International Conference on Robotics and Automation, 1283-1290.
Schneider E and Irastorza X, 2010. OSH in figures: Workrelated musculoskeletal disorders in the EU -Facts and figures. European Agency for Safety and Health at Work.
Seidl A., 2004. The ramsis and anthropos human
simulation tools. In: Working postures and movements – Tools for evaluation and engineering, 454–462. CRC Press.
Snook SH and Ciriello VM, 1991. The design of
manual handling tasks: revised tables of maximum ac-ceptable weights and forces. Ergonomics, 34(9), 1197-1213.
Waters TR, Putz-Anderson V, Garg A, and Fine LJ, 1993. Revised NIOSH equation for the design and evaluation of manual lifting tasks. Ergonomics, 36(7), 749-776.