HAL Id: tel-02570752
https://tel.archives-ouvertes.fr/tel-02570752
Submitted on 12 May 2020
HAL is a multi-disciplinary open access
archive for the deposit and dissemination of sci-entific research documents, whether they are pub-lished or not. The documents may come from teaching and research institutions in France or abroad, or from public or private research centers.
L’archive ouverte pluridisciplinaire HAL, est destinée au dépôt et à la diffusion de documents scientifiques de niveau recherche, publiés ou non, émanant des établissements d’enseignement et de recherche français ou étrangers, des laboratoires publics ou privés.
performance and energy of a heterogeneous SoC
memory system
Amal Ben Ameur
To cite this version:
Amal Ben Ameur. Transactional simulation approach for modelling performance and energy of a heterogeneous SoC memory system. Embedded Systems. Université Côte d’Azur, 2019. English. �NNT : 2019AZUR4048�. �tel-02570752�
Approche de simulation transactionnelle
pour la modélisation des performances et de
l'énergie d'un système mémoire pour SoC
hétérogènes
Amal BEN AMEUR
Laboratoire d’Electronique, Antennes et Télécommunications
UCA, UMR CNRS 7248
Présentée en vue de l’obtention du grade de docteur en Informatique d’Université Côte d’Azur
Dirigée par : François Verdier Co-encadrée par : Michel Auguin Soutenue le : 28/06/2019
Devant le jury, composé de :
Pascal Benoit, Maître de conférence, LIRMM David Navarro, Maître de conférence, ECL Arnaud Tisserand, Directeur de Recherche, CNRS
François Verdier, Professeur, Université Côte d’Azur
Michel Auguin, Directeur de Recherche, CNRS Valerio Frascolla, Directeur de Recherche et Innovation, Intel Deutschland GmbH
Patricia Guitton-ouhamou, Architecte Logiciel, Renault Sophia Antipolis
performances et de l'énergie d'un système mémoire pour SoC
hétérogènes
Jury :
Rapporteurs :
Pascal Benoit
Maitre de Conférence, LIRMM
David Navarro
Maitre de Conférence, ECL
Examinateurs :
Arnaud Tisserand
Directeur de Recherche, CNRS
Valerio Frascolla
Directeur de Recherche et Innovation, Intel Deutschland
GmbH
Invitée :
Patricia Guitton-ouhamou
Architecte Logiciel, Renault Sophia Antipolis
Directeur de thèse :
François Verdier
Professeur, Université Côte d’Azur
Co-directeur de thèse :
Les appareils mobiles, à chaque nouvelle version des normes et suivant les demandes continues de nouveaux services par les utilisateurs, doivent prendre en charge de plus en plus de fonctionnalités, qui deviennent également de plus en plus exigeantes du point de vue informatique. Par conséquent, être en mesure de répondre aux nouvelles exigences tout en fournissant des puces à faible consommation d’énergie est aujourd’hui le défi le plus important pour les concepteurs de systèmes pour appareils mobiles.
Pour relever ce défi, de nouvelles approches de modélisation de la performance et de la puissance au niveau système ont été proposées, permettant d'explorer les architectures matérielles/ logicielles (HW / SW) dès les toutes premières étapes d'un flot de conception de systèmes sur puce (SoC). Cependant, les solutions existantes prennent en charge de manière limitée l'optimisation de la puissance du système de mémoire (y compris la mémoire SDRAM), qui peut occuper plus de 70% de la surface d'une puce et consommer plus de 30% de l'énergie totale. Dans nos travaux, nous proposons un cadre de simulation basé sur SystemC-TLM au niveau Electronic System Level (ESL), capable de prendre en charge l’exploration commune d’une architecture SoC et de sa configuration mémoire. Ce nouveau cadre permet d’optimiser la consommation d’énergie des SoC tout en faisant correspondre les performances requises en termes de puissance et de performances, de bande passante mémoire et de temps de latence.
Mots-clés—efficacité énergétique, système de mémoire, Electronic System Level, conception du système,
Mobile devices, at each new release of the standards and following users’ continuous requests of new services, have to support more and more features, which are also becoming more and more demanding from the computational point of view. As a consequence, being able to fulfil new requirements and at the same time to provide power efficient chips is nowadays the most important challenge for mobile devices system designers.
To tackle this challenge, novel system level performance and power modeling approaches have been proposed allowing hardware/software (HW/SW) architectures to be explored right at the very first steps of a System-on-Chip (SoC) design flow. However, existing solutions have limited support for the power optimization of the memory system (including SDRAM) that may occupy more than 70% of a chip area and consume more than 30% of the total energy. In our work, we propose a SystemC-TLM-based simulation framework at Electronic System Level (ESL), which is able to support the joint exploration of a SoC architecture and its memory configuration. This new framework helps in optimizing the SoC energy consumption while matching the required performance in terms of power and performance, as well as of memory bandwidth and latency.
Keywords—power efficiency, memory system, Electronic System Level, system design, HW/SW
This PHD is a CIFRE PHD project with Intel. It started at Intel Mobile Communications Sophia Antipolis, and then finished at Intel Munich.
For reasons of confidentiality and security measures, we will be limited on describing Intel environment and detailed information. Thus, the Chapter III represents a compact version of the work actually done.
I. Introduction ... 1
1. Context ... 1
2. Contributions ... 3
3. Structure of the Dissertation ... 3
II. Power-aware architectures modeling: Background & State of the Art ... 5
1. System-on-Chip Design flow: Level of abstraction ... 6
1.1. Electronic System Level (ESL) ... 8
1.2. Register Transfer Level (RTL) ... 10
1.3. Synthesis and Chip Fabrication ... 11
2. Power modeling: power consumption and power management techniques ... 12
2.1. Power Consumption of System-on-Chip ... 12
2.2. Clock Gating and Power Gating ... 13
2.3. Dynamic Voltage and Frequency Scaling ... 13
2.4. Unified Power Format (UPF) ... 15
2.5. ESL power and performance assessment frameworks ... 17
3. Model Driven Engineering approaches ... 19
4. PwClkARCH library ... 20
4.1. Description of the library structure ... 21
4.2. Methodology behind PwClkARCH ... 24
5. Study of the memory system at ESL level ... 28
5.1. Memory and storage ... 28
5.2. Memory requirements: Energy efficiency and performance ... 29
5.3. Technology trends: Emerging Non-volatile memory ... 34
6. Conclusion ... 37
1.2. Intel Munich pre-silicon simulation environment ... 41
2. Task Graph ... 42
3. Adding Power Intent to the simulation environment ... 46
4. Conclusion ... 49
IV. Model Driven Engineering for PwClkARCH-based design: Graphical and textual user interfaces for code generation ... 50
1. The Model Driven Engineering approach ... 50
2. PwClkARCH’ Metamodel... 51
3. Code generation ... 54
4. Graphical workbench ... 55
4.1. Main Interface ... 57
4.2. Power and clock states tables ' interface ... 58
5. UPF-like Integration ... 60
6. Conclusion ... 62
V. Exploration of memory technology based on simulation at TLM level ... 64
1. DRAMPower tool ... 65
2. Memory exploration flow ... 68
3.1. Sensitivity of results to the number of transactions processed by DRAMPower ... 71
3.2. DRAM device power evaluation ... 72
3.3. DRAM controller power estimation ... 74
3.4. Mean memory access time estimation ... 75
3. Conclusion ... 76
VI. Simulation results ... 77
1. Clock Gating application ... 77
3.2. Interleaving of memory accesses ... 87
3.3. Applying DVFS ... 89
4. Conclusion ... 92
VII. General conclusions and perspectives ... 94
1. Conclusion ... 94
2. Perspectives ... 95
3. Publications of the author related to this thesis ... 96
Acronyms ... 99
Appendix ... 101
Figure 1. (a) The maximum receiving rate of smartphones; (b) Receiving rates of smartphones VS. stable
communication duration ... 1
Figure 2. Technology trends according to the Moore's law [8] ... 6
Figure 3. Design process abstraction levels ... 7
Figure 4. SystemC-TLM Transaction background ... 10
Figure 5. Line of code Comparison [14] ... 11
Figure 6. Energy (dynamic and leakage) vs Voltage [19] ... 14
Figure 7. Dynamic voltage and frequency scaling (DVFS) architecture... 14
Figure 8. Example of UPF-based power aware design (Source: Magic Blue Smoke) ... 16
Figure 9. Low-Power systems design flow [22] ... 17
Figure 10. PwClkARCH structure ... 21
Figure 11. OPPT, ClkST, and PST tables structure ... 23
Figure 12. Power Management Unit (PMU) structure ... 24
Figure 13. Overall approach of PwClkARCH based methodology ... 25
Figure 14. Power consumption curves examples ... 27
Figure 15. Errors Report File example ... 27
Figure 16. High-level overview of DRAM-based memory system ... 29
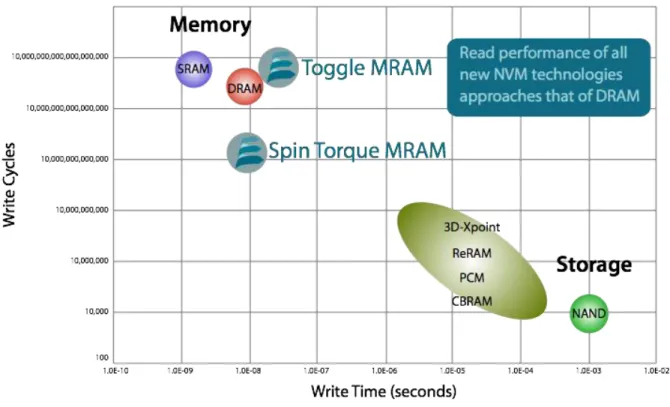
Figure 17. DRAM vs NVM write performance. Source: Everspin Technologies ... 30
Figure 18. DRAM and STT-MRAM capacity growth in years [65] ... 35
Figure 19. STT MRAM cell structure (spintec inMRAM 2015 by Dieny.B) ... 36
Figure 20. Principle of spin-torque-transfer STT-MRAM [66] ... 36
Figure 21. Emerging memories performances (Y. De Charantenay, (Yole) InMRAM 2015) ... 36
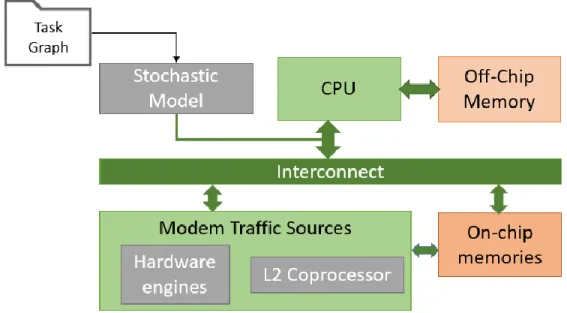
Figure 22. Simplified representation of a cellular modem performance model ... 39
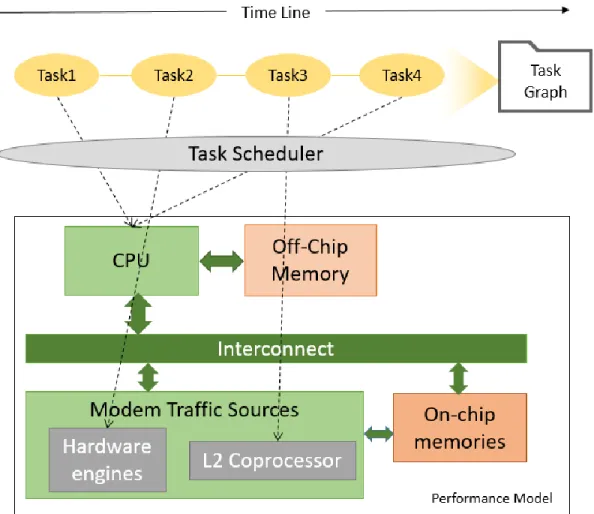
Figure 23. Platform level blocks mapped into simulation tasks ... 40
Figure 24. Simplified representation of a cellular modem performance model 2 ... 42
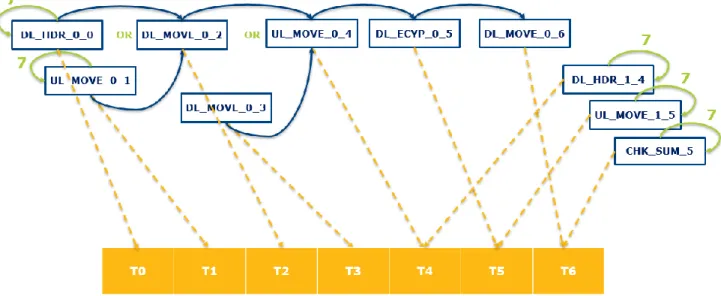
Figure 25. Example of a task graph for communication application ... 43
Figure 26. Specification of the task DL_HDR_0_0 within a configuration file ... 44
Figure 27. General parameters of a task-graph node ... 45
Figure 28. Example of output log for deadline examination ... 46
Figure 29. L2 Coprocessor power model definition using PwClkARCH ... 47
Figure 30. Main function and variable members of tg_constructor ... 48
Figure 34. Model to Text Transformation schema ... 54
Figure 35. Main Interface of the graphical entry tool... 58
Figure 36. Example of Tables Views ... 59
Figure 37. XML representations of CLKST, PST and OPPT ... 59
Figure 38. Power Model Example ... 60
Figure 39. UPF-like input file ... 61
Figure 40. XML output syntax ... 62
Figure 41. UPF-like generation flow ... 62
Figure 42. Steps of the graphical tool development ... 63
Figure 43. The expected trend in power consumption for logic and memory circuits in portable consumer devices, as reported by the 2011 edition of ITRS ... 64
Figure 44. Overview of general SDRAM controller [38] ... 65
Figure 45. Average power consumption in mW for MRAM and DRAM... 67
Figure 46. Normalized energy consumption of DRAM system and MRAM system adopted different techniques [64] ... 67
Figure 47. DCT Power model example ... 69
Figure 48. Functional behavior of the DCT platform ... 69
Figure 49. connection of DRAMPower with the DCT Platform ... 70
Figure 50. Connection of DRAMPower with a SystemC-TLM model augmented with PwClkARCH ... 71
Figure 51. Accuracy of energy estimation and the simulation time evolution vs Number of transactions 72 Figure 52. Example of power evaluation of groups of N transactions ... 73
Figure 53. Example of two successive windows of N transactions ... 75
Figure 54. Example of DRAM operations generation ... 75
Figure 55. Framework representation with Intel platform ... 76
Figure 56. Clock frequency variation per Tile (x=time [ns], y=Frequency [Hz]) ... 78
Figure 57. Total dynamic power consumption of all Tiles with (x=time [ns], y=Pdyn [mW]) ... 79
Figure 58. Total dynamic power consumption of all Tiles with different clock frequency values (x=time [ns], y=Pdyn [mW]) ... 79
Figure 59. Clock frequency variation of Tile1 with three configurations ... 80
Figure 60. Overall energy (x=time [ns], y=energy [mJ]) ... 80
Figure 61. Clock frequency variation per Tile (x=time [ns], y=Frequency [Hz]) ... 81
Figure 64. Execution time (a) and energy consumption (b) of the DCT platform with bank-interleaving enabled ... 88 Figure 65. Execution time (a) and energy consumption (b) of the DCT platform when applying DVFS, with bank-interleaving disabled ... 90 Figure 66. Execution time (a) and energy consumption (b) of the DCT platform when applying DVFS, with bank-interleaving enabled ... 92
Ten years ago, I decided, let’s do Computer Sciences. That was the beginning of a new chapter in my life!
Today, I'm finishing my education journey in Computer Science field.
Writing this PhD has been a truly challenging experience for me and it would not have been possible to do without the support and guidance that I received from many people.
I would like to first say a very big Thank you to my supervisors Pr. Michel Auguin and Pr. François Verdier for all the support, advices and encouragement they gave me during my PHD but also earlier during my two internships with them. Without their guidance and constant feedbacks, this PhD would not have been achievable. Mr. Michel Auguin, despite his retirement, continued to correct the report and work with us, for which I’m truly grateful. I really needed the good mood and the positivity of my supervisors to overcome the obstacles that I faced during the thesis. THANK YOU!
Additionally, I would like to express my very great appreciation to Intel Company for funding my PhD. My sincere gratitude also goes to my manager Juergen English for his encouragement and supervisory role. I also wish to acknowledge the help provided by Valerio Frascolla in writing the conference papers, as well as his guidance in many of my decisions. Many thanks to Patricia Guitton, Didier Martinot, Ralph Hasholzner, Raimar Thudt, and Vikas Patil for their collaboration and help. It was a good experience working with them. I learned a lot from them. I also want to thank my colleagues from Intel Munich, with whom I shared many of my lunch and coffee outings during my travels!
I am deeply grateful to all members of the jury, Mr. Pascal Benoit, Mr. David Navarro and Mr. Arnaud Tisserand for agreeing to read the manuscript and to participate in the defense of this thesis.
I would also like to thank all my friends, you know who you are, for the time we spent together to lower the burden of the thesis and continue to work with a very good mood.
I would also like to thank all my colleagues of the LEAT for sharing a lot of fun with them and, setting a positive work environment.
Last but not least, my biggest thanks goes to my family: my mother Mariem and my Father Nabil, my sisters Rihab and Abir, and my sister's husband Zied. You are my source of life!
1
I. Introduction
1. Context
The innovation pace of the wireless communication world is breathtaking, not only due to the fierce competition, but also due to the yearly cadence with which standards bodies deliver a new set of functionalities and services to be supported. In this very dynamic context, optimizing products and differentiate against the competitors is key for all those who want to be successful in a make-or-break market.
With the advances in semiconductor technology that have continuously reduced the technological nodes, the problem of power and circuit heat dissipation have tended to worsen at the same time. Such problem can lead to a degradation of the performance of a system, or even endanger its correct functionality. An interesting study on the impact of power consumption on the communication performance of a smartphone is published in [1]. Thereby, it is shown that the reception rate of a 5G smartphone is directly dependent on the proportion of power allocated to the baseband processor (PBP). Results show that Rmax (the maximum
receiving rate of smartphones) can be improved using two ways: applying the latest semiconductor technology to chips (as presented in the part (a) of the Figure 1), and increasing β the proportion of PBP with
respect to the total power consumption of the whole chip (Pchip
comp). However, the power allocated to the
baseband processor results from the global power budget authorized of the whole smartphone and the
Figure 1. (a) The maximum receiving rate of smartphones; (b) Receiving rates of smartphones VS. stable communication duration
2 amount of power consumed by the application processor and the memory system (in this case, βmax= 34
percent). Thus, reducing the power consumption of the application processor and the memory system makes it possible to increase the reception speed of the smartphone. Consequently, mastering power and performance in order to have the best compromises with the complete system of all hardware blocks is obvious.
In our work, the focus is at platform level, where memory system power optimization, a key optimization in the design of mobile terminals, is taken into consideration. We start with a survey of some broad used memory technology, then we introduce some powerful power-modeling tools and finally describe the System-on-Chip (SoC) modeling approach proposed to simulate SystemC-Transaction Level Modeling (TLM) based platform for power and performance assessment.
The problem of power management in terminals has been broadly discussed in literature [2], [3] and has mainly identified processor power consumption as the most important contributor to the overall system power consumption. However, recent analyses show that the power consumption caused by the memory subsystem represents a significant part of the total power. In [4] authors report that about 35% of the total energy of a Samsung Galaxy S3 I9300 is due to data movements in the memory system on video-playback applications. As a consequence, one can say that the memory hierarchy of a mobile phone platform, and more in general in the overall memory system, do require a higher attention when power optimizations are to be looked for.
The memory system is composed of a controller, potentially some caches, and different kinds of memories, e.g. on-chip RAM and a generic external memory that is used as the main memory of the processor, which could be implemented via Double Data Rate (DDR) DRAM, which is known to be the traditional main memory, or using other more recent technologies like the Low Power DDRx (LPDDRx) family. Memory system performance and power consumption do not depend only on memory design but also on workload (e.g. the cellular protocol stack executed on the communication processor (CP)), the kind of memory controller in use and on the overall system configuration. The interactions between the memory system and the different components of the mobile SoC need to be accurately considered, to achieve a satisfactory estimation of power consumption. Thus, evaluating its power management strategies and performance efficiency requires an approach that includes an appropriate model of the memory, a realistic controller, a high-precision power model, and a representative workload of real use cases. All of the above requires a full system simulation framework able to represent the impact of the different mutual interactions between all the components in the platform and the memory system. Hence, designers of memory system would need easy-to-use and high-precision power models that estimate power and energy consumption of the different operations and state transitions of the memory system. Among those, we use DRAMPower [5] which is an
3 open source Dynamic Random Access Memory (DRAM) power and energy tool for estimating the power consumption of different DRAM operations at the cycle-accurate level.
The PwClkARCH library (discussed in details in Chapter II, Section 4) presents a framework that helps designers to model the impact of the SoC activities on power consumption by means of Virtual Prototyping (VP), describing the SoC using SystemC-TLM. The library also allows for exploration of different power management strategies, like Dynamic Frequency Scaling (DFS), Dynamic Voltage Frequency Scaling (DVFS), Power Gating and Clock gating. The PwClkARCH library by itself is still not sufficient to give a precise view on main memory power consumption, especially at the refinement level of each operation. In fact, it is such information that is needed to properly explore different configurations and compare different designs of memory systems. Therefore, we need to make work together the PwClkARCH library with a DRAM functional simulator able to evaluate the power consumption as well.
Our approach is to be used at a very early stage of the SoC design flow, as it focuses on a pre-silicon simulation environment at a high level, before the split between SW and HW implementation has been defined. Joint optimization of, e.g., cellular protocol stack SW architecture, mobile SoC HW architecture as well as HW/SW partitioning is enabled by this approach. In fact, our work allows to analyze the impact of different architecture options on mobile SoC power consumption as well as on the performance of cellular protocol stack SW, controlled in power, executed on the CP.
2. Contributions
In this thesis, we propose a framework for power modeling and management at ESL level able to support both CMOS common hardware block and DRAM block. This framework is based on SystemC-TLM, PwClkARCH library which is implemented by the LEAT laboratory and DRAMPower simulator which is an open source tool. Using the framework, designers can explore the architecture of their device or product by measuring the performance and the energy consumption during each simulation. They can then choose the appropriate technology and DRAM configuration for their use case. Our methodology takes into account the interactions between the DRAM and the other blocks, and the memory power model is accurate enough to consider the operations of the DRAM to calculate the power dissipation.
3. Structure of the Dissertation
Chapter II presents the state of the art of this project. We start by defining the level of abstraction used during our work, we introduce PwClkARCH library and we give a survey of the memory system in relation with power consumption (memory requirements and trends).
In Chapter III, we describe the Intel environment used in our work which constitutes the target of our project. This environment is a pre-silicon simulation environment for Intel modem devices.
4 In Chapter IV, we explain our work on PwClkARCH using Model Driven Engineering approach to facilitate the use of the library with graphical and textual user interfaces.
Chapter V illustrates our contribution around ESL-level memory technology exploration based on power consumption.
The Chapter VI is dedicated for the simulations results. We show our plots and we give our analysis based on the state of the art and the use cases we used.
5
II. Power-aware architectures modeling:
Background & State of the Art
Following Moore’s law, the SoC complexity increases constantly due to the continuous addition of new features that require the integration of a growing number of processing cores and IPs in a single chip (Figure 2). This have a significant impact on implementing new computing paradigms and enhancing computing possibilities. The period between 2000 and 2010 experienced a constant improvement of wireless devices connectivity capabilities, which in turn helped smartphones to offer more and more better services at each new generation. In parallel, connected IoT (Internet of Things) devices and sensors also experienced a proliferation. Between 2006 and 2014 the average number of IPs embedded in a SoC increased from 30 to 120, whereas integrated processor cores increased from 1 to 20 [6]. As a consequence, the SoC design becomes harder along with the underlying power consumption becomes more and more important. In order to face this issue, several means exist in the industry for power estimation and management, but they are still based on low-level CAD (Computer-aided design) tools, take time and require a rather detailed software model of the hardware architecture blocks. In fact, even if cycle-accurate tools give quite accurate power estimates, they require a high amount of simulations imposing to move up to higher abstraction level to address efficiently the first steps of the design flow. Thus, Transaction Level Modeling (TLM) appears as the most effective approach to assess designs with rapid power estimation tools.
Moreover, memory system consumes more than 30% of the overall phones energy when executing applications [7]. Designers prefer to have high memory bandwidth to address the bandwidth needs of new chips and devices. There are several memory options either in terms of technology (DDR, LPDDR, NVM, etc.) or in terms of on-chip/off-chip choices. The possible combinations are numerous, and we have to choose a good tradeoff between bandwidth, power efficiency, cost and reliability. This task is not obvious and need to be addressed at the very beginning of the design flow.
The power estimation existing tools, industrial or academic, are numerous, but unfortunately they treat the memory system separately, that is, without considering the impact of the requests coming from the rest of the system to the memory or the inverse. In the industrial world, they usually use real-world measurements to generate or use the memory device datasheet to estimate memory consumption, and at the higher level, they consider powerful memories of large sizes and high bandwidth to not block or degrade performance. This leads to big problems later in the design cycle. So, treat these problems early in the design flow and define the adequate memory system answering the needs of the product in terms of performance and power consumption is very important.
6 All this presents the general context of the thesis, which can be divided into two points of interest: the first is the energy consumption analysis and control, and the second is the memory system design. One can imagine then many working hypotheses which vary widely according to the needs of the designer. Already, when we say energy consumption we actually refer to two different aspects: estimation and management. Our work is to develop a framework to help designers for exploring different memory system architectures, in terms of technology and configurations, according to their energy consumption (and when possible by also applying some power management techniques), and also their performance at the beginning of the design flow (ESL level).
This chapter is dedicated to the presentation of basic concepts necessary to the understanding of our research works.
Figure 2. Technology trends according to the Moore's law [8]
1. System-on-Chip Design flow: Level of abstraction
Several design steps are required to implement a system on chip. Current SoCs consist generally of several processors, memories and peripherals. The Figure 3 represents the design process abstraction levels that describe the process of SoC realization from design concept to fabrication. From top to down, the simulation speed decreases and the design becomes more complex as we add in each level certain details. The problem
7 in focus is to find the best tradeoff between simulation speed and accuracy in order to properly model platforms and IPs correctly so as to mimic the system’s behavior and allowing overall system verification.
Figure 3. Design process abstraction levels
Efficient computer architecture simulators are available supporting the actual execution of software, including the operating system. For example, Gem5 simulator [9] is a modular platform for system-level architecture and processor microarchitecture. It contains CPU models, GPU models, event-driven memory system including caches and DRAM controller models, and many other features. Gem5 is written primarily in C++. The goal of Gem5 is to model a system with heterogeneous applications running on a set of heterogeneous processing engines, using heterogeneous memories and interconnect. Gem5 provides also a complete platform for research in future energy-efficient systems by enabling DVFS on the Linux kernel for run-time power management. Such simulators are mainly CPU-centric and GPU-centric. They are not well adapted for modelling complex SoCs including communication processors and specific IPs that can generate heavy traffic to and from the memory sub-system, concurrently with the CPU/GPU sub-system, inducing then interferences between execution of all these processes. Note that Gem5 has been connected with SystemC in [10] in order to address the full simulation of MPSoCs. As in our work we consider a task
8 graph-based modelling of the software part, a CPU/GPU cycle accurate simulator such as Gem5 is not required in this case. This task-graph methodology captures the control flow of the application and provides only the execution workload of each task to the underlying architecture simulation models. Thus, each model simulates the execution latency and the power consumption for an application-task rather than executing real instructions or operations of the software. Therefore, we are able to explore the power and the performance earlier in the design phases of system development process, as task-graph methodology does not require detailed implementation neither of the application, nor of the architecture.
1.1. Electronic System Level (ESL)
Electronic system level (ESL) design and verification is an electronic design methodology focusing on higher abstraction level in a design flow to make as early as possible effective architecture decisions by prototyping, debugging and analyzing complex systems before the RTL (Register Transfer Level) stage. At this stage, VP techniques are used, as they represent in convenient way simulation models of the entire system architecture and the verification environment. VPs consist generally of transaction-level (TL) models, where the simulation speed and the accuracy of the models are balanced. VP are very useful for architecture explorations, performance and power simulations, as well as for preparing system test cases for system verification.
The traditional power management techniques at RTL level or place and route (P&R) are not suitable anymore to perform efficient design space explorations for complex systems, because their simulations are very time consuming due to the multitude of blocks and signals to consider in a SoC. Moreover, to reduce the model complexity, they target power optimization in individual blocks without considering a global view of the system. These tools are efficient at IP-level. However, the speed of design is very important to keep the time-to-market short and to develop competitive products. For that reason, high-level power management on ESL level is desired as it gives ability to the designer to take efficient design decisions at an early design stage.
1.1.1. SystemC
SystemC [11] is basically the standard for ESL design. It is a C++ class-based library for system and hardware design defined by the Open SystemC Initiative (OSCI) that has been merged with Accellera [12]. From December 2005, SystemC has been known also as IEEE-1666 after its standardization from IEEE standards association. Since SystemC is based on C++, it supports all the C++ data types and provides also SystemC data types generally preceded by ‘sc’ like sc_int or sc_signal.
Design components are defined as modules in SystemC. They are classes that inherit from the sc_module base class. Modules may contain methods, ports and channels for connectivity. In SystemC, there are two
9 kinds of processes namely SC_METHOD and SC_THREAD. SC_METHODs are like functions in C++ or Verilog and they don’t consume time i.e. simulated time. However, SC_THREADs can consume time by using the wait() function, either for specific time, or for events.
Connecting ports in SystemC is an operation that is basically divided into four steps: declare the port and the channel, instantiate the port and the channel, bind the port to the channel using bind() method and finally use the port. Events and sensitivity give SystemC the power to implement hardware prototypes in terms of concurrency and consuming time. Simulated time is managed by the SystemC kernel using sc_time datatype.
SystemC simulator has two phases: elaboration and simulation. The former is the phase where design is setup: objects like modules, ports, exports and channels are instantiated. The latter is used to run the resulting system model.
Since 2011, SystemC standard integrates TLM-2.0 transactional modeling which allows functional validation based on SoC simulation.
1.1.2. Transaction Level Modeling (TLM)
The idea behind TLM is to model each component only if it has something to do. The individual components communicate by sending messages requesting data be transferred between each other. The exchange of messages is called a transaction, and the approach is called Transaction Level Modeling (TLM).
The Open SystemC Initiative (OSCI) TLM 2.0 [13] offers a standardized approach to use TLM. It explicitly addresses VP thanks to which SystemC models can easily be organized and communicating within a system. Consider the system as a set of SystemC modules, each has one or more sockets through which the SystemC modules may read and write data. The activity of each module is modeled by a number of parallel threads which communicate with the threads in other modules by passing data through the sockets. This communication is known as a transaction and the data passed as a payload. A module's threads may act as either initiators or targets (Figure 4). An initiator is responsible for creating a payload and calling the transport function to send it. A target receives payloads from the transport function for processing and response. Initiator calls are made through initiator sockets, target calls received through target sockets. A module may implement both target and initiator sockets, allowing its threads to both generate and receive traffic.
10
Figure 4. SystemC-TLM Transaction background
The models in the SystemC-TLM Library have been developed in partnership with major IP (Intellectual Property) providers, among which Intel, ARM, Cadence, ST Microelectronics, and Synopsys, giving the designer access to IP vendor reference models and ensuring their correct behavior. Those models are typical of the IP needed by designers to build platforms, debug hardware and software and verify the design before moving to the RTL implementation flow. For instance, Intel uses the SystemC-TLM standard and develops on top of it a productivity layer. The resulting library is Intel property, but it is interoperable with standard SystemC-TLM coding style.
The SystemC-TLM2 standard [13] focuses on use cases such as software performance analysis, hardware architecture analysis but does not provide any intrinsic features for power analysis.
1.2. Register Transfer Level (RTL)
Digital electronic circuits have been mainly designed at the Register Transfer Level (RTL) since the late 1980s. This level expresses the scheduling of operations and data transfers in clock cycle. For the structural aspect, these operations are projected on elementary material resources (registers, arithmetic operators, etc.). Indeed, at this level of description, data transfers and logical operations between the registers are described via signals. An RTL design is usually captured using a hardware description language (HDL) such as Verilog and VHDL. Such languages benefit from many years of development and constant improvements so that the design of a system is almost automatically synthesized down to circuit layout ready for fabrication, provided that efficient command scripts are used in the design flow.
The complexity of hardware design has induced very slow simulations and time-consuming implementation of RTL models. In [14], authors perform test to measure performance increase of design by comparing TLM and RTL level modeling. Figure 5 represents their results of line code comparison. Tiers are general terms of displaying embedded system components, which communicate together, for example, 2-tiers means there
11 are two components communicating together. Without going into details, results show that the amount of lines needed to model system by using TLM is less than that of using RTL. This is explained by the fact that TLM is used for hiding hardware aspects that are not important at system level and so gain effort, number of code lines, and also time in the simulation.
Figure 5. Line of code Comparison [14]
1.3. Synthesis and Chip Fabrication
The transitions between the abstraction levels of the design are achieved through the synthesis processes. The high-level synthesis known as HLS is the transition between ESL level and behavioral RTL level. HLS tools generate a custom architecture (memory banks, data path: registers, multiplexers and buses) that implements a high-level specification [15].
Then, there is an RTL synthesis that target technology cell library to obtain the structural RTL which is the logic synthesis. In this phase, RTL specification of the design is transformed to logic gates implementation, using synthesis tools like Design Compiler from Synopsys or RTL compiler from Cadence.
Finally, we have the layout synthesis or what we call place and route process to obtain a physical representation. Cadence proposes many solutions at different levels like Stratus for high level synthesis, Genus for RTL synthesis and the Encounter® technology.
12
2. Power modeling: power consumption and power management techniques
2.1. Power Consumption of System-on-Chip
The total power consumed P in the CMOS technology consists basically of two factors: dynamic or switching power and static or leakage power. Dynamic power is due to the charging and discharging of capacitances associated to each transistor whose state toggles. So, the dynamic power (Pdynamic) is the power consumed when the device is active and so the signals are changing values. Static power (Pstatic) is due primarily to gate and channel leakage in each transistor. It represents the power consumed when the device is powered up but the signals are not changing values. Note that in this work, we neglect the short-circuit power which represents the power dissipated by an instantaneous short-circuit connection between the supply voltage and the ground at the time the gate switches state. In the literature, this component has been neglected in comparison to the switching power [16].
The energy consumption of a system E can be defined as the summation of both spatial and temporal power consumption of circuits.
𝐸 = ∫ 𝑃𝑑𝑡0𝑡 (in Joule)
P = Pdynamic + Pstatic
Pdynamic= a*C*V2*Fclock (in Watt) (1)
Pstatic= V*Ileakage (in Watt) (2)
a is the switching activity
C is the capacitance
V is the supply voltage
Fclock is the clock frequency Ileakage is the leakage current
t is the execution time of an application
Most of these parameters are technology dependent and may come either from technical datasheets or simulation results at low design stage or from physical measurements on real circuits.
Today, the power reduction is one of the most important design goals of battery-powered devices. Developers are concentrating on reducing power consumption and on gaining better control on power dissipation of their products in order to satisfy the customers’ requests.
Designers are used to make tradeoffs between power and performance. Increasing the frequency often will increase the energy consumption since voltage must be adapted to support the frequency change.
13 Alternatively, the supply voltage can potentially be reduced resulting in lower performance but significantly reducing energy consumption because the quadratic dependence of power on voltage. Designers handle that using several techniques to reduce the power by controlling voltage and frequency values. Some of these techniques are introduced below.
There exist several power management techniques reducing the dynamic power or/and the static power of SoCs. Power management techniques may be applied at various levels of the design flow and so with different granularities. Although each design stage offers an opportunity to save power, higher levels of abstraction have greater impact. In DAC 2012, Shawn McCloud, vice president of marketing at Calypto said: “Today, many optimizations are made at the gate level and lower. But the real impact on power occurs when you move up to the architectural level. You can look at the options for resource sharing and the tradeoffs between parallelism and operating at lower frequency".
According to [17], the best three techniques for reducing energy consumption are Clock Gating, Power Gating and Dynamic Voltage and Frequency Scaling.
2.2. Clock Gating and Power Gating
Clock Gating is one of the most efficient techniques for reducing power consumption in particular the dynamic power. It is based on disabling the clock of the design components when they do not execute any computation. This leads to power savings in the clock tree. Power gating nonetheless, is the most efficient way to reduce leakage power. If a block is not used in some time intervals, it is powered down in these periods.
The basic strategy of both techniques is to provide two power modes: a low power mode and an active mode. The goal is to switch between these modes at the appropriate time and in the appropriate manner to maximize power savings while minimizing the impact to performance.
2.3. Dynamic Voltage and Frequency Scaling
Dynamic Voltage and Frequency Scaling (DVFS) is a very popular technique to reduce the dynamic power. DVFS allows the voltage and the clock frequency to be decreased and increased dynamically according to the processing demand. DVFS works on two fundamental concepts: first, processing units have some “IDLE” time after performing required tasks (at full speed); second, dynamic power consumed by digital circuits is proportional to V2. The interdependence between voltage and operating frequency should be
managed in a good way. The optimal combination between leakage and switching power has to be found as shown in Figure 6.
14 Figure 7 presents a typical DVFS architecture. Both clock generator and voltage generator are managed by a controller. The controller is responsible of deciding when and how the clock frequency and voltage will change. The control method is usually defined, at least in part, by the software, although it can be coded in the hardware. More generally, the complete control algorithm can be implemented in the software [18].
Figure 6. Energy (dynamic and leakage) vs Voltage [19]
Figure 7. Dynamic voltage and frequency scaling (DVFS) architecture
Next, we present some of the TLM-based power management existing tools and frameworks. We start by introducing the Unified Power Format (UPF) standard which is almost the only standard that exists and recognized by most of design tool providers.
15
2.4. Unified Power Format (UPF)
UPF has offered a clear design flow utilizing the power management techniques and enabled RTL power-aware verification. The UPF committee was formed by the Accellera organization. The first approved version 1.0 was published in 2007. UPF was used to partition a design into power domains and to apply different power management strategies to control logic values when the domains are being switched off and on (Figure 8). UPF is a Tool Control language (TCL) based syntax. It defines the main features of a power management architecture separately from the functional specification. From version to version, some refinements were included, and several commands were added to remove ambiguities or to fix errors identified in previous versions.
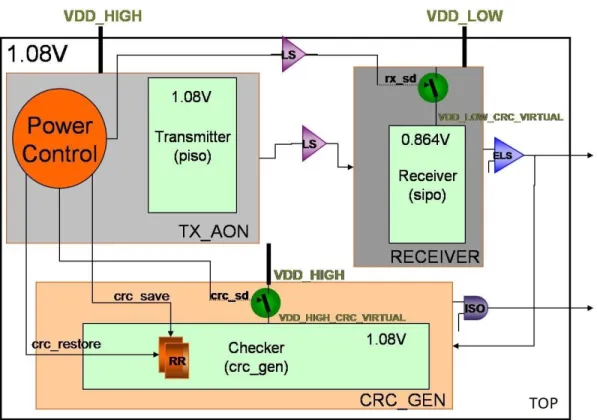
A power domain is a collection of design elements that share a primary supply set. According to UPF terminology, a supply set associates multiple supply nets (such as power and ground much like an electrical plug) as a complete power source for one or more design elements. A supply net so represents the power and the ground rails in the design. UPF allows the creation of a hierarchical structure of power domains. For example, in Figure 8, TOP is a top-level power domain that includes TX_AON, CRC_GEN and RECEIVER power domains. These power domains are created with the following piece of TCL code:
create_power_domain TOP
create_power_domain TX_AON -elements {transmitter power_controller} create_power_domain RECIEVER -elements receiver
create_power_domain CRC_GEN -elements checker
Power management strategies are implemented through Power State Table where lines correspond to specific system power modes. A system power mode is a legal combination of specific power-domain states. The set of power-oriented components (power domains, supply nets, …) added to a system to control its power consumption is called a power intent.
16
Figure 8. Example of UPF-based power aware design (Source: Magic Blue Smoke)
However, this standard has a scalability issue as it becomes very complex with complex design. As the trend of designing SoCs is to use abstract models above RTL, UPF follows the trend and was updated to version 3.0 [20]. This version boasts support for ESL power modeling and analysis in VP applications. Compared with previous releases of UPF, UPF 3.0 introduces mainly the capability of capturing power states associated with IPs, supply nets and power domains. A power state is a combination of voltage values (and frequency values) of supply nets and logical expressions attached to signals controlling power suppliers. A “functional state” or simstate in UPF (e.g. RUN or DEEP SLEEP) can be associated to a power state to precise the simulation behavior of the cells in this state. Logical expressions can be captured as well to express conditions on transitions between power states. A logical expression can refer to states of supply nets and/or power states of power domains and/or some control conditions issued from the HDL design. At system level, power models as introduced in UPF 3.0 are used in tools such as Platform Architect MCO from Synopsys [21]. But for us even UPF 3.0 does not cover all the needs to support an easy performance/power system design space exploration (DSE) where power/performance tradeoffs are to be investigated, and global power management strategies are to be defined and validated. Moreover, UPF is inflexible and demanding on the tool chain and requires simulators as well as debug environments (Figure 9). As a result, many companies have created their own solutions for power related design. Next, we will present some of these solutions.
17
Figure 9. Low-Power systems design flow [22]
2.5. ESL power and performance assessment frameworks
2.5.1. Synopsys Platform Architect
Synopsys Platform Architect (Synopsys PA) MCO (Multicore Optimization Technology) is a SystemC TLM standard-based graphical framework for ESL design, and early power and performance analysis of a multicore SoC architecture [23]. In Synopsys PA the application is modeled as a task-graph. Where each node represents an application task which is instantiated from basic blocks of a Generic Task Library (GTL). The edges in the task-graph represent the dependencies between the nodes. The task nodes use communication token samples for activation and synchronization purposes. Tasks read their input ports, consume or process the input tokens and generate output tokens. The behavior and execution time of each task for actual processing of the incoming tokens is specified by some generic functions, such as for data processing and memory access, which are connected to each task node during instantiation of the corresponding node. The application model, under the control of a default task manager, can be simulated stand-alone to analyze the application behavior and memory traces. The architecture model components are instantiated from a library containing Virtual Processing Unit (VPU) task-driven traffic generators, memory blocks and interconnect subsystems. The mapped task graph on a given architecture can be simulated to analyze the overall power and performance of the system. As in UPF, power consumption in PA framework is described as a high-level state machine. Each state is associated with a certain power consumption and triggered by events detected in the virtual prototype.
18
2.5.2. Intel CoFluent Studio
Intel CoFluent Studio [24] is a commercial model-driven tool for design and exploration of complex embedded systems in the early phases of the design process. In CoFluent the application is modeled, using a GUI tool, as a network of function blocks or process communicating with each other through communication elements such as events, shared variables or message queues. Once the application is modeled, a timed SystemC-TLM model of the application can be automatically generated. The simulation of this timed model can be used for analysis of the application model. Similarly, using the same GUI tool, the system architecture model is also created by connecting different generic architecture resources, such as processors, interrupts, interconnect and memory blocks. The architecture resources are characterized by high level performance attributes. The mapping relation of application model with the architecture model is expressed by creating mapping models of the system. In the mapping models, each function or process in application model is mapped on one of the processing resources in the architecture model. Similarly, the communication path between the processes in the application model is also mapped on the interconnect subsystem in the architecture model. The shared variables and message queues in the application model are mapped on the architecture memory blocks. The SystemC-TLM generated code of the whole system allows the analysis of the power, cost, resources load, memory footprint and dynamic behavior of the application on the architecture. Thus, Intel CoFluent itself doesn’t include any power analysis features.
2.5.3. Intel Docea Power Simulator
Intel Docea Power Simulator (IDPS) [25] is a software solution for creating power and thermal virtual prototypes of SoCs at system level. Intel Docea Power Analytics (IDPA) [26] is used to collect and structure all the data needed for power analysis in a database. The tool is post-processing power analysis in the way that, from VCD files generated from SystemC-TLM simulation according to the power model defined in the tool, it generates power values needed for analysis. The connection between the two simulators requires to insert specific code in the HDL design model to transmit the relevant events and data from the HDL design to trigger power state transitions in the power model. The power model of the system is a hierarchical set of component power models. A component power model is defined as a Power State Machine (PSM) composed of one or more power states. The user provides power equations, static and dynamic, for each power state. A timed succession of power states defines a static scenario, which helps study power and thermal behaviors. Intel Docea Power Simulator is thus a help for measuring the total power and temperature, but not at all for defining the power optimization strategy.
2.5.4. Mentor Graphics® Vista™ platform
Mentor also invests in new generation tools at ESL level that help model performance and power at the early design exploration stage. The Mentor Graphics® Vista™ platform [27] enables modeling power and performance information at TLM level while maintaining accuracy.
19 In Vista™ platform power models are attached to each IP and assigned to each transaction type that the IP can receive or emit. These power models are dependent from voltage and clock frequency of the IP whose values are defined as parameters of the model.
2.5.5. Comparison of ESL-based tools from EDA providers for power analysis
The table below illustrates that apart Intel CoFluent Studio, the tools mentioned above provides power estimation facilities but are not able to model an explicit power management strategy, i.e. the decision issued from the software part (e.g. the operating system) that set up the power states of power domains according to the functional state of the system.
Simulation model Power Estimation Power Management
Platform Architect MCO
SystemC-TLM YES NO
Intel CoFluent Studio SystemC-TLM NO NO
Intel Docea Power Simulator
Internal simulator with possible connection with SystemC-TLM YES NO Mentor Graphics® Vista™ SystemC-TLM YES NO
3. Model Driven Engineering approaches
There are also a lot of academic work on the implementation of tools for high-level modeling of energy consumption using SystemC. Without being limited to a few, we cite the work [28], in which a mode/phase-based model is used at IP level where the mode (respectively the phase) informs the power model attached to the IP about the current power state (e.g. ON) (resp. the current functional state, e.g. IDLE).
A Model-Driven Engineering (MDE) approach has been also considered in several works to support the analysis and the exploration of system architectures including both hardware and software. For example, in [29] the application, the architecture and non-functional aspects such as power consumption are modeled using a multi-view approach. But in this framework dedicated for design space exploration no effort is done to connect it with traditional ESL design flow such as the generation of SystemC-TLM code for simulation. In [30], authors develop a MDE approach for estimating power of a hardware architecture. In this work power estimators based on power states are attached to each hardware components and the energy per component is estimated by counting their periods of activity during a system level simulation. As this approach focuses only on power estimation, it is of limited interest for the exploration and the validation of a real power management strategy applied to a functional model. An interchange format XFG with
energy-20 based annotations is proposed in [31] to support the analysis of energy-aware real-time systems which can be described according to a variety of specification formalisms, each one adapted to a different discipline (e.g. mechanics, software). A formal semantics is defined for XFG in [31] but there is no information provided on the way to use the energy annotations in an analysis or exploration process. The approach developed in [32] proposes a UML profile targeting the design space exploration of embedded systems at a high level of abstraction. A Finite Power State Machine is associated with each CPU in the architecture to model both the power consumption and the operating performance points (OPPs) available for that CPU. A Power Policy Manager is also introduced to select the OPP according to some performance criteria. The framework allows fast abstract simulation for evaluating performance and power. But, as mentioned earlier, the use of power states to model power consumption is not really convenient for verifying that a power/clock intent and the power management strategy are consistent with a functional architecture.
Model Driven Engineering-based (MDE) approaches have been considered for design space exploration of low-power SoCs. In [33] the UML MARTE profile is extended such that Power Finite State Machine (PFSM) can be attached to hardware components. To estimate the system power consumption, power configurations need to be bound manually to the application operational modes. Authors of [34] consider stereotypes to a UML metamodel to associate power-oriented data, a PFSM and a scheduler with HW components. Such ESL specification is far from the low power UPF-style specification which means that a significant effort must be made to provide a specification conformed to the input format of EDA tools.
Systems Modeling Language (SysML) is a graphical modeling language for specifying, analyzing and verifying complex systems. It is defined as an extension of the Unified Modeling Language (UML) using UML’s profile procedure [35]. Unlike UML, SysML is not limited to software systems, it is able to model in addition to software, hardware, information, processes and facilities. SysML is considered for example in [31] for capturing non-functional properties such as power consumption models.
4. PwClkARCH library
A recently proposed power modeling library called PwClkARCH implements the high-level modeling approach proposed in [36], and [37] by the laboratory of Electronics, Antennas and Telecommunications (LEAT), which will be explained in details in Section 4.2., so to assist SoC designers with a system level SystemC-TLM framework, inspired from the UPF standard. PwClkARCH is a library of C++/SystemC-TLM classes (Figure 10) allowing a SystemC-C++/SystemC-TLM architecture to be structured in power domains and clock domains (power/clock intent) such that a power management strategy could be applied to evaluate its impact on power consumption and on performance.
21
Figure 10. PwClkARCH structure
4.1. Description of the library structure
Before describing the methodology on which the PwClkARCH is based, we should define the aspects/semantics included in this library. Most of them are UPF based semantics that have been abstracted to TLM level. In UPF, a list of components called design elements (DEs) from the HDL design are assigned to a power domain. In this approach, a design element object is defined as a reference or a pointer to the corresponding module in the SystemC-TLM design model. Then a specification of a power/clock intent is built above these DEs thus reinforcing the separation of concerns between HDL design and power/clock intent. The DE class contains the generic power model of a component which is basically the sum of consumptions due to static power (Pstat= VIleakage) and dynamic power (Pdyn= αCV2F). The power model of
each instance of a DE is particularized with the values of parameters (e.g. capacitance C) specified with the associated module in the SystemC-TLM model.
A Power Domain (PD) is defined as a subset of system components that receive power from the same Supply Net (SN). SN represents the supply source and can be used to power up the different PD elements. Thus, each PD can be controlled individually. It can be put in different states of operation called Power States (PSs). Concepts of voltage domain and power domain are merged like in UPF, so that a power domain can be either power-gated or voltage-scaled or non-scaled according to its attached supply nets. According to the UPF standard, hierarchical organization of power domains is permitted. Thus, two types of power
22 domains are included in the library. A power domain of type “container” has at least another power domain of type “nested”. But also, this “nested” power domain can also be of type “container” when it includes other power domain(s).
Correspondingly, a Clock Domain (CD) is a set of system components that have at all times one single clock source on which division operations can be performed but which lead always to synchronous signals or a constant phase at the level of the CD elements. Unlike the Power Domains hierarchy defined by UPF, PwClkARCH do not introduce a hierarchy between Clock Domains.
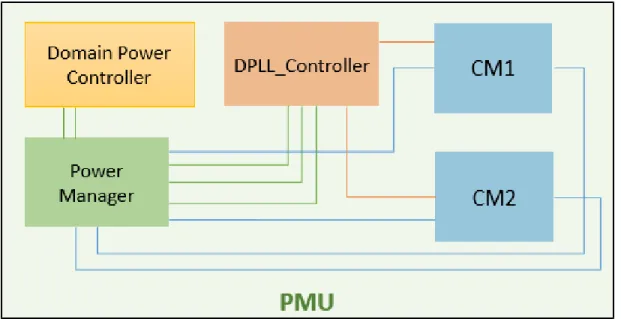
PwClkARCH associates for a Clock Domain a single Digital Phase Locked Loop (DPLL) which represents its primary clock source and a single Clock Manager (CM) which allows to control the clock distribution to its Design Elements. CM receives a generated clock (i.e. the clock frequency value) from the DPLL in the clock domain and provides individual clock frequencies to each IP blocks in the clock domain. The clock frequency provided by a CM to a IP block results from a simple division on the CM input clock. Each clock generated by a CM can also be gated individually. The CMs are controlled by a Power Manager.
Power Manager (PM) is the intelligent block in the library; meaning that it is the responsible of the power management implementation. PM receives the power requests from the CPU for example or other masters in the platform, then it interprets the request and do the necessary actions. For example, if the CPU requests that the block A go to clock gated state, the PM send a request to the CM responsible of this block to turn off the clock generated to the block A.
The Power State Table (PST) concept is taken from UPF, which constitutes the interface between the power strategy and the power architecture. PST defines a static system power management strategy by defining the power domains’ supply nets states. Columns of a PST represent the states of power domains in terms of their power supply net states, while lines represent the different system power modes. Each line corresponds to one legal combination of specific power domain states.
PwClkARCH, similarly to PST, uses the concept of Clock State Table (ClkST), which defines for each block its possible frequency values during the execution of a scenario. The columns of the ClkST represent local power modes of the hardware blocks. A local power mode sets the clock state of each block by specifying its division factor. This factor is applied by the CM on the source clock of the CD in order to generate the clock needed for a given power mode to the corresponding block. When the division factor is equal to the specific value zero, the clock gating function is applied.
The Domain Power Controller (DPC) is in charge of applying the configuration of controls from a specific row in the PST to the power domains. PM and DPC are included in the PMU (Power Management Unit) which is connected to the SystemC-TLM system bus.
23 By specifying a line entry in the PST and a line entry in the ClkST, we can define the complete state of PDs and CDs. To facilitate the control of PDs and CDs, an OPP Table (OPPT) is available in PwClkARCH where an entry (an OPP) specifies the index entries is PST and ClkST and the multiplication/division factors of the DPLLs in the system (Figure 11). The PM receives from a master on the bus (e.g. the CPU) a transaction specifying the row index in the OPP Table to be applied to the power architecture. If after a change of row index, a state transition of a power domain (a clock domain resp.) is activated by DPC (CM resp.), the state transition is acknowledged to the PM after a time penalty, which models the time for the supply voltage (DPLL resp.) to reach its new value.
Power Management Unit (PMU) contains instances of the CM, PM, DPC,… as depicted in the Figure 12, it is the only SystemC-TLM power-oriented component that must be added in the transactional model.
The observer classes are used to structure automatically the power and clock intent with monitors to evaluate at different layers (DE, power switch, supply net, and CM layers) the power consumption.
A set of generic assertions are also defined in PwClkARCH for verification purpose. For example, an error is signaled if an IP block without any wake-up facility receives a functional transaction while the IP is in clock gated state or in power gated state.
24
Figure 12. Power Management Unit (PMU) structure
4.2. Methodology behind PwClkARCH
To design high-performance and energy-efficient embedded systems, it is extremely important to address two basic issues. First issue concerns accurate estimation of power consumption of all system components during early design stages. Second issue consists in deriving power optimization solutions that do not negatively impact system performance.
PwClkARCH proposes a methodology based on the modeling of CDs and PDs that allows for clock and voltage distribution management in SystemC-TLM functional models, without any initial power considerations. The overall approach of this methodology consists of the steps shown in the Figure 13 and which will be explained later.
25
Figure 13. Overall approach of PwClkARCH based methodology
The first step is named Power and Clock Intent Specification Stage. This stage consists first in analyzing how data are exchanged between the components of the functional model to allow the designer to understand when and how often each component has been activated in the different use cases. Then, the designer splits the components in different power domains and clock domains. This is done by instantiating the appropriate objects from the PwClkARCH library: clock sources, generated clocks, power switches, and supply nets. Usually, a top-level power domain and a top-level clock domain that don’t contain any logic elements are defined.
The second step is the modeling of the PMU. This unit acts as an interface between the functional model and the power model. It is a SystemC-TLM block connected to the functional model through the PM block’ socket. This unit serves as a relay for the implementation of the power management strategy based on the exploitation of CDs and PDs states. This strategy makes it possible to control the power mode of a CD (PD resp.) adapted to the application scenario by adjusting the power modes of its components. Switching from
26 one power mode to another then corresponds to a power management request represented as a TLM transaction originating from an initiator in the SystemC-TLM system (for example, the CPU on which the embedded software executes).
At the third stage, the complete architecture including its functional model and its power management is simulated. Power consumption value updates are plotted in log files generated automatically during the simulation (Figure 14). These files are useful for analyzing and comparing different power management solutions (for example, different division/multiplication factor configurations in ClkST table) as well as for selecting the power management solution that offers a good compromise between system performance, power consumption and the complexity of the management system of this consumed power (number of CDs and PDs, size of the tables, diversity of frequencies considered for example). In order to verify that the steps of the methodology are completed successfully, a process of verification was added to the proposed system-level design flow.
This verification step is the fourth step of PwClkARCH methodology which is a perpendicular step. The purpose of this step is to check clock and voltage management properties during the simulation. Verification is based on the notion of contract. A contract is defined as a set of assumes (i.e. pre-conditions) and guarantee (i.e. post-conditions) clauses. To verify a contract in simulation, each clause is introduced in PwClkARCH as a specific assertion. This assertion is called at the level of the SystemC-TLM functional code in order to trigger an exception when a contract is violated (Figure 15). For example, a Clock Domain is valid if it contains only one DPLL and only one CM at most. Another example of contract is that during the simulation, there is no functional activity in a CD whose state is clock gated.
27
Figure 14. Power consumption curves examples

![Figure 2. Technology trends according to the Moore's law [8]](https://thumb-eu.123doks.com/thumbv2/123doknet/13055754.383332/26.918.130.793.431.801/figure-technology-trends-according-moore-s-law.webp)
![Figure 9. Low-Power systems design flow [22]](https://thumb-eu.123doks.com/thumbv2/123doknet/13055754.383332/37.918.228.733.100.468/figure-low-power-systems-design-flow.webp)
![Figure 18. DRAM and STT-MRAM capacity growth in years [65]](https://thumb-eu.123doks.com/thumbv2/123doknet/13055754.383332/55.918.130.752.483.958/figure-dram-stt-mram-capacity-growth-years.webp)