See discussions, stats, and author profiles for this publication at: https://www.researchgate.net/publication/330289806
Fat mass vs body mass index in anticipation of aerobic capacity to monitor
weight gain in sports women
Article · January 2019 DOI: 10.15406/mojwh.2019.08.00204 CITATIONS 0 READS 23 6 authors, including:
Some of the authors of this publication are also working on these related projects:
footballView project
health and wellbeingView project Mohammed Zerf
Université Abdelhamid Ibn Badis Mostaganem
95PUBLICATIONS 68CITATIONS SEE PROFILE Bengoua Ali Mostaganem University 36PUBLICATIONS 27CITATIONS SEE PROFILE
All content following this page was uploaded by Mohammed Zerf on 12 January 2019.
Submit Manuscript | http://medcraveonline.com
Introduction
Ideal body weight is a subject of study that raises more questions
than answers.1,2 However, there are methods that are more accurate
available to determine the ideal body weight.3 Where among health
care professionals, the best-known method for assessing body size is
the body mass index.4 While weight is not the best indicator in the
case of athletes due to increased bone and skeletal muscle5 as the BMI,
which is a limited perfect measure to interpret, the body fat.6 Thus, the
serious consideration of issues regarding ideal human body weight has been a topic of debate for a very long time. Hundreds of formulas and theories have been invented and put to the test, but the answer
is still debatable, Gregory L, et al.,7 & Thibaut de Saint Pol8 sets that
there are better measures to adapted the optimal ideal body weight
to the specific sport. While9 indicts; It is important for the metabolic
physician to know the ranges for BMI in terms of the weight category. However, the results obtained by most formulas are very good, the case of Heath Who postponed it as the lowest mortality rate estimated,
whereas in sports studies it is considered as body form10–13 related to
the less mass body fat.14,15 As Body weight is easily measured but
not always a good indicator of body composition changes,16 Where
its control t should be included as part of a comprehensive weight
management17 based on aerobic fitness, which is related to body
weight,18 and aerobics energy dominate.19 This study was undertaken
and aimed at the evaluation of the relationship between Body Fat VS body mass index composition contributing to a healthy aerobic fitness body weight program among 60 sportive women their age category under 22 years based on cooper test as physiological parameter to esteem VO2max, and weight-height to calculate the BMI and body fat as anthropometric measurements, to test the hypothesis which agrees that: BMI alone should not be used to determine an “ideal” fitness body.
Material and methods
Sample
The data used in this study were obtained from the database of Team 5 Physical Education Institute Laboratory OPAPS for the
academic year 2014-2015. In terms of sample-related data, 60 male femme sportive under 22 years, from the Physical Education Institute was examined in parameters (anthropometric and physiological decide for the current study) by Team 5 at the end of the physical preparation for the year 2014-2015 after the agreement with Chief of Research Team No. 5 Mr. Bengoua Ali Director of the Scientific Council, all examinations were realized for the first weeks before the enter university. Whereas to inspect the study protocol and methods, we choose the laboratory OPAPS “Institute of Physical Education of our University” who approve it by the professor’s physiologist of effort.
Testing protocol
The maximal aerobic capacity: We have chosen the maximal aerobic capacity based on the formula Test Cooper (VO2 max=22.351
d (km)-11.288 (ml/min/kg)). Where related studies20 confirm that the
Cooper 12-minute test, the 1.5-mile test, the Rockport One-Mile Fitness Walking Test and the multi-stage shuttle have a corresponding laboratory VO2 max obtained by them formulas , which its accurate
is correlated between 90- 95% approves by similar in this field.21,22
While the Cooper Institute indict that, the Cooper test provide a better picture of endurance of maximal aerobic capacity which evaluates Aerobic fitness who leads to better health and a higher quality of
life.23 Whereas the scientists in these domain24confirm that VO2max
is affected by genetics, training, gender, age, and body composition. Weight and height: Height (m) and weight (kg) were each
measured in the standing position 25 to calculate the body mass index
BMI=weight (kg) /height (m2). Where Goto Y, et al.,26 confirm that
the VO2 peak is associated with biological status after controlling for height and weight. Whereas Ideal body weight is the body weight for a
given height that is statistically associated with the greatest longevity27
which can be estimated either by reviewing the medical record for the
body weight28 and calculated mathematically by dividing weight in
kilograms by the square of height in meters.29 Whereas this formula
represents the calculi of BMI, while some authors in this field30
neglect its credibility in sportsmen, explain by overweight, which may be increased due to lean body mass, but not obese or overfat.
MOJ Womens Health. 2019;8(1):22‒25. 22
©2019 Mohammed et al. This is an open access article distributed under the terms of the Creative Commons Attribution License, which permits unrestricted use, distribution, and build upon your work non-commercially.
Fat mass vs body mass index in anticipation of
aerobic capacity to monitor weight gain in sports
women
Volume 8 Issue 1 - 2019
Zerf Mohammed, Saci Mohammed, Moulay
Idriss Mokkedes, Kamal Kohli, Houar Abelatif,
Bengoua Ali
Physical Education Institute Laboratory OPAPS, University of Mostaganem, Algeria
Correspondence: Zerf Mohammed, Physical Education Institute Laboratory OPAPS, University of Mostaganem, Mostaganem, Algeria, Tel 9936044220, Email
Received: March 30, 2017 |Published: January 09, 2019
Abstract
The objective of the current study is built in body fat as a predictor of ideal weight to promote health and fitness body weight. To test this hypothesis, we founded on the relationship between fat mass index vs index body mass composition to improve aerobic capacity as control of body weight. For the proposition, 60 women sports under 22. We’re controlled by the cooper test as physiological parameter estimated VO2 max and the weight and height to estimate BMI and body fat as anthropometric measurements. Based on our database and analyses, we confirm the hypothesis, which argued that BMI alone should not be used to determine an “ideal” body weight. Since the level of VO2 max is the best predictor of aerobic capacity and adjusted fitness body weight based on the ratio of body fat among sportswomen. However, to develop an equation more studies are required to prove this hypothesis.
Keywords: body, fat, BMI, aerobic, capacity, weight, gain, sports, women
Fat mass vs body mass index in anticipation of aerobic capacity to monitor weight gain in sports women ©2019 Mohammed et al.Copyright: 23
Citation: Mohammed Z, Mohammed S, Mokkedes MI, et al. Fat mass vs body mass index in anticipation of aerobic capacity to monitor weight gain in sports
women. MOJ Womens Health. 2019;8(1):22‒25. DOI: 10.15406/mojwh.2019.08.00204 Since BMI is not a perfect measure, it does correlate strongly with
percent body fat according to,31 we use The formula proposed by:32
body Fat=(1,2×BMI)+(0,23×age)-(10,8 ×Sex)-5,4.
Statistical analyses
Data analysis was performed using SPSS 22.0 for Windows (32-bit). Data obtained from the tests showed a normal distribution and homogeneity, presented as mean±standard deviation, Shapiro-Wilk test and Levene’s test. Regression analyses were conducted to analyse the combined of the variables chosen to study where the relationship between the variables was analysed by Pearson correlations (r).
Results
The characteristics of the study sample are presented in Table1. All the variables accept Normality based on Shapiro-Wilk test and the Variance homogeneity based on Levene’s test. While our sample range between fair and good categories according to normative
data for VO2max proposed by.33 The Mean±SD of all the variables
shows goods levels of fitness and physiological characteristics of the participants. Whereabouts our results consisted in terms vo2max,
with norms proposed by34 VO2max: 36.3±11.3 ml/kg/min, as body
%Fat our sample are sited in normal class according to Raul Garrido
Chamorro,35 for the BMI our sample range from 18.5 to 24.9 as normal
weight, Body mass index categories according to Marie (Table 1).36
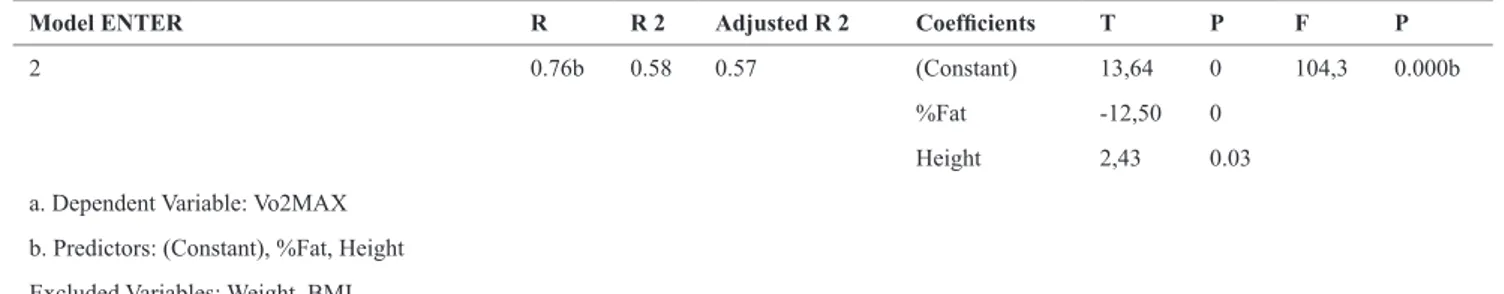
All the correlations in Table 2 are strongly significant at p≤0.05 and 0.01. Were Vo2MAX is strong positive correlate with Height in opposites of other variables tested in the current study. While Height and Weight are strongly negative correlate with percentage body Fat and BMI in opposite BMI & body fat. Through the Table 3 mode1 methods ENTER showed a strong and significant positive association between Vo2max and %Fat as Predictors aerobic fitness control body weight. Whereas the program Excluded Weight, Height, BMI from the regression. Through the Table 4 mode2 methods ENTER showed a strong and significant positive association between Vo2max and %Fat with Height as Predictors aerobic fitness control body weight. Whereas the program Excluded Weight, BMI from the regression.
Table 1 Presents the baseline characteristics of the participants physiological and anthropometric characteristics by total group
N Min Max Mean±SD Shapiro-wilk Levene's test
Stat Stat Stat Stat Stat Sig Stat Sig
Weight 60 48. 50 69.93 60.38±8.02 0.98 0.06 1.8 1.81
Height 152 172 158.71±5.26 0.99 0.17 0.27 0.29
Vo2MAX 40.96 47.39 44,54±1.99 0.99 0.47 3.16 0.37
%Fat 13 18 13,30±2,21 0.99 0.19 1.17 0.29
BMI 19.77 24.06 22.15±1.82 0.99 0.14 2.14 0.15
Table 2 Presents the correlations between the variables tested in the current study
Weight Height Vo2MAX BMI %Fat
Weight Pearson Correlation 1 0.46** -0.44** 0.75** 0.63**
Height Sig. (2-tailed) 0.46** 1 0.38** -0.24** -0.22**
Vo2MAX -0.44** 0.38** 1 -0.78** -0.70**
%Fat 0.75** -0.24** -0.78** 1 0.92**
BMI 0.63** -0.22** -0.70** 0.92** 1
**Correlation is significant at the 0.01 level (2-tailed).
Table 3 Presents the results of regression model 1 analyses relating VO2max and the variables tested in the current study
Model enter R R 2 Adjusted R2 Coefficients T P F P
1 0.74a 0.56 0.56 (Constant) 80,22 0
213,68 0.000b
%Fat -12,73 0
a. Dependent Variable: Vo2MAX. b. Predictors: (Constant), %Fat.
Excluded Variables: Weight, Height, and BMI.
Discussion
Based on the statistical applied. Our results confirm
% body Fat is the best predictor of the maximum aerobic
capacity: Our result Table 2 & 3 lines with studies37 which confirm
that age, gender factor was more effective than BMI. Think confirms15
in effects of increasing BMI on Cardio respiratory Fitness case sports
studies and total adiposity case the medical studies.38 Whereas to
estimate VO2 max,39 our rusilts confirm that it is based on age, sex,
and height, were these results are in conformity with the characteristics used in the selection of our sample (women and categories under 22 years). Confirmed in regression model 2 (Table 4). Where the
Citation: Mohammed Z, Mohammed S, Mokkedes MI, et al. Fat mass vs body mass index in anticipation of aerobic capacity to monitor weight gain in sports
women. MOJ Womens Health. 2019;8(1):22‒25. DOI: 10.15406/mojwh.2019.08.00204 relationships Vo2max & Height are the superior parameters predicting the levels of estimated vo2max (Table 2). Based on these results, we agree on one hand that further studies are needed to implement the actual findings associated with this hypothesis. In addition, we invite our metabolic physician to develop equation which takes the
account of ranges for BMI in terms of the weight category9 as new
anthropometric equations to determine change in body Weight fat-free
mass, total body water and body fat.40
The level VO2max is the best indicator of the adjusted body weight among the sportswomen: Our results are correlated with
the judgement, which agreed41 that the body mass index (BMI) is
considered to be one of the most objective anthropometric indices when its permits the correction of body weight for height. Think confirmed
in the results Table 2 & 4, which indicted body %Fat and Height are the only predictors of the levels of Vo2max. As these results, we reach
a decision on the indications which support,42 to esteem the adjusted
body weight, we need to detect the excess body weight in the form of
fat,43 recognize as a distinct disadvantage in almost every sport. From
the above, we decide on one hand, that BMI alone should not be used to determine the “ideal” body weight range. As a purpose, we invite the laboratory metabolic physician to set a range of acceptable values for body fat and body weight within each sport. While to monitor weight gain in sports women, we recommend the relation body fat & level Vo2max as the best predictor of the maximum aerobic capacity and success of the training program which depends on the individual’s
aerobic capacity levels.44
Table 4 Presents the results of regression model 2 analyses relating VO2max and the variables tested in the current study
Model ENTER R R 2 Adjusted R 2 Coefficients T P F P
2 0.76b 0.58 0.57 (Constant) 13,64 0 104,3 0.000b
%Fat -12,50 0
Height 2,43 0.03
a. Dependent Variable: Vo2MAX b. Predictors: (Constant), %Fat, Height Excluded Variables: Weight, BMI.
Conclusion
Our finds confirmed that BMI unaccompanied is cautioned in athletes. Thus, body weight may be altered significantly by changing
proportions of muscle and fat masses.45 Since that, we endorses46
that body weight and body composition should be evaluated as part of a weight control program based on lean body mass, which
is more closely associated with height than weight.47 An evidence,
which approves, that the body fat and height improved prediction
of the esteem VO2max. Based on the fitness test48 while to abstract
general principles applicable in the case of our study, we refer Body fat percentage as factor which affects VO2 max and $ cardiovascular
status among athletes.49 Moreover, as recommendation, we agree
that a better aerobic capacity will increase fat oxidation, which is
thought to improve body weight control.50 To conclude, we support
the hypothesis that BMI alone should not be used to monitor weight gain in the case of our sportive women, where the level of vo2max is the best predictor of adjusted body weight based on the ratio of body fat. However, to develop an equation more studies are needed to prove this hypothesis.
Acknowledgments
None.Conflicts of interest
The author declares there are no conflicts of interest.
References
1. Amarash Mohan. Understanding Practices of Weight Management. Online Gatha: 2016.
2. Jerome Sarris, Jon Wardle, Clinical Naturopathy, An evidence-based guide to practice. US: Elsevier Health Sciences; 2014. 944 p.
3. Brian C Leutholtz, Ignacio Ripoll. Exercise and Disease Management. 2nd ed. US: CRC Press; 2011. 256 p.
4. Peggy S Stanfield. Nutrition and Diet Therapy: Self-Instructional Approaches. 5th ed. US: Jones and Bartlett Publishers Inc; 2009. 571 p. 5. Carolyn D. Berdanier, Johanna T Dwyer, David Heber. Handbook of
Nutrition and Food. Third Edition. US: CRC Press; 2016. 1136 p. 6. Steven E. Pediatric Metabolic Syndrome: Comprehensive Clinical
Review and Related. UK: Springer Shop; 2012. 116 p.
7. Gregory L Landry, David T Bernhardt. Essentials of Primary Care Sports Medicine. US: Human Kinetics; 2003.842 p.
8. Richard N Aufmann, Joanne Lockwood. Introductory Algebra: An Applied Approach. US: Cengage Brain; 2012.
9. Michael M Rothkopf, et al. Metabolic Medicine and Surgery. US: CRC Press; 2014. 656 p.
10. Paul G Barash. Clinical Anesthesia, Clinical Anesthesia. US: Wolters Kluwer Health; 2009. 255 p.
11. L Kathleen Mahan, Sylvia Escott-Stump, Janice L Raymond. Krause’s Food & the Nutrition Care Process, Elsevier Health Sciences. US: Care Process; 2012. 1152 p.
12. Thibaut de Saint Pol. How to measure the girth and weight perfect. FR: Sciences Po; 2007.
13. Forrest O Moore, Peter M Rhee, Samuel A Tisherman. Surgical Critical Care and Emergency Surgery: Clinical Questions and Answers. US: Wiley.com; 2012. 499 p.
14. Simbeck, Cathy Mohr. The effects of a leg strengthening program on the endurance run of adolescents with intellectual disabilities. US: Pro Quest; 2008. 10 p.
15. Laxmi CC, Udaya IB, Vinutha Shankar S. Effect of body mass index on cardio respiratory fitness in young healthy males. International Journal of Scientific and Research Publications. 2014;4(2):1–4.
Fat mass vs body mass index in anticipation of aerobic capacity to monitor weight gain in sports women ©2019 Mohammed et al.Copyright: 25
Citation: Mohammed Z, Mohammed S, Mokkedes MI, et al. Fat mass vs body mass index in anticipation of aerobic capacity to monitor weight gain in sports
women. MOJ Womens Health. 2019;8(1):22‒25. DOI: 10.15406/mojwh.2019.08.00204 16. Barbara Brehm. Psychology of Health and Fitness. US: FA. Davis;
2014. 480 p.
17. James M Rippe. Lifestyle Medicine. 2nd ed. US: CRC Press; 2013.1638 p.
18. Thomas Reilly, A Mark Williams. Science and Soccer. US: Psychology Press; 2003. 585 p.
19. Thomas Reilly. The science of training–soccer a scientific approach to developing strength speed and endurance. US: Routledge; 2006. 208p. 20. John Gormley, Juliette Hussey. Exercise Therapy: Prevention and
Treatment of Disease. US: Wiley.com; 2009. 280 p.
21. Daniel Mayorga Vega, et al. Criterion-Related Validity of the Distance- and Time-Based Walk/Run Field Tests for Estimating Cardio respiratory Fitness: A Systematic Review and Meta-Analysis. PLoS One. 2016;11(3):e0151671.
22. Greg Welk, Marilu D Meredith. Fitnessgram and Activitygram Test Administration Manual. Updated 4th ed. US: Human Kinetics; 2010. 202 p.
23. Sharon A Hoeger. Principles and Labs for Fitness and Wellness. US: Cengage Learning, Inc; 2015. 882 p.
24. Wener WK Hoeger, Sharon A Hoeger. Lifetime Physical Fitness and Wellness: A Personalized Program. US: Cengage Brain.com; 2016. 196 p.
25. Linda Skidmore Roth. Mosby’s Drug Guide for Nursing Students, with 2016 Update. US: Elsevier Health Sciences; 2015. 1304 p.
26. Goto Y, et al. Body mass index and waist circumference are independent risk factors for low vital capacity among Japanese participants of a health checkup: a single-institution cross-sectional study. Environ Health Prev Med. 2015;20(2):108–115.
27. Vishwanath Sardesai. Introduction to Clinical Nutrition. 2nd ed. US: CRC Press; 2003. 565 p.
28. Edward C Feldman, Richard William Nelson. Canine and Feline Endocrinology and Reproduction. US: Elsevier Health Sciences; 2004. 1104 p.
29. Susan G Dudek. Nutrition Essentials for Nursing Practice. US: Wolters Kluwer Health; 2010. 598 p.
30. Vishwanath Sardesai. Introduction to Clinical Nutrition. 3rd ed. US: CRC Press; 2011. 704 p.
31. Lauren M Rossen, Eric Rossen. Psych 101 Series Sampler (eBook): Introductions to Key Topics in Psychology. UK: Springer Publishing Company; 2013.
32. Deurenberg P, Westrate JA, Seidell JC. Body mass index as a measure of body fatness: age- and sex-specific prediction formulas. Br J Nutr. 1991;65(2):105–114.
33. Vivian H Heyward. The Physical Fitness Specialist Certification Manual, The Cooper Institute for Aerobics Research, Dallas TX. 3rd ed. US: Advance Fitness Assessment & Exercise Prescription; 1998. 4 p. 34. Peter RJ Reaburn. Nutrition and Performance in Masters Athletes. US:
CRC Press; 2014.393 p.
35. Raul Garrido Chamorro, et al. Skinfold Sum: Reference Values for Top Athletes. Int J Morphol. 2012;30(3):803–809.
36. Marie A Boyle. Personal Nutrition. US: CengageBrain.com; 2015. 1250 p.
37. N Koutlianos, et al. Indirect estimation of VO2max in athletes by ACSM’s equation: valid or not? Hippokratia. 2013;17(2):136–140. 38. Tauseef Nabi, Nadeema Rafiq, Ouber Qayoom. Assessment of
cardiovascular fitness [VO2 max] among medical students by Queens College step test. International Journal of Biomedical and Advance Research. 2015;6(5):418–421.
39. Peter Slinger. Principles and Practice of Anesthesia for Thoracic Surgery. UK: Springer Shop; 2011. 82 p.
40. Sally B Olds, Marcia L London, Patricia W Ladewig. Maternal-newborn Nursing: A Family and Community-based Approach. US: Prentice Hall Health; 2000. 838 p.
41. Allen L, Prentice A. Encyclopedia of Human Nutrition. US: Elsevier; 2005. 2000 p.
42. Connie Henke Yarbro, Margaret Hansen Frogge, Michelle Goodman. Cancer Nursing: Principles and Practice. US: Jones & Bartlett Learning; 2005. 2200 p.
43. Anita Bean, Carol Vorderman. The Complete Guide to Sports Nutrition. US: A & C Black Publishers; 2000. 545 p.
44. William D McArdle, Frank I Katch, Victor L Katch. Exercise Physiology: Nutrition, Energy, and Human Performance. US: Wolters Kluwer Health; 2010. 250 p.
45. Dana L Duren, Richard J, et al. Body Composition Methods: Comparisons and Interpretation. J Diabetes Sci Technol. 2008;2(6):1139–1146. 46. Sandy Fritz. Sports & Exercise Massage-Elsevier on Vital Source:
Comprehensive Care for Athletics, Fitness, & Rehabilitation. US: Mosby; 2012. 496 p.
47. David Tennant. Food Chemical Risk Analysis. UK: Springer Shop; 2012. 132 p.
48. Cristian Cristian. Aquatic Exercise Association, Aquatic Fitness Professional Manual. 6th ed. US: Human Kinetics; 2010. 411 p. 49. Anjali N Shete, Smita S Bute, PR Deshmukh. A Study of VO2 Max
and Body Fat Percentage in Female Athletes. J Clin Diagn Res. 2014;8(12):BC01–BC03.
50. Simon P Allison, Vay Liang W Go. Metabolic Issues of Clinical Nutrition. Basel [u.a.]: Karger; 2004. 221 p.
View publication stats View publication stats