HAL Id: hal-00388285
https://hal.archives-ouvertes.fr/hal-00388285
Submitted on 13 Apr 2021HAL is a multi-disciplinary open access
archive for the deposit and dissemination of sci-entific research documents, whether they are pub-lished or not. The documents may come from teaching and research institutions in France or abroad, or from public or private research centers.
L’archive ouverte pluridisciplinaire HAL, est destinée au dépôt et à la diffusion de documents scientifiques de niveau recherche, publiés ou non, émanant des établissements d’enseignement et de recherche français ou étrangers, des laboratoires publics ou privés.
Pushing the ground-based limit: 14-mumag photometric
precision with the definitive Whole Earth Telescope
asteroseismic data set for the rapidly oscillating Ap star
HR1217
D.W. Kurtz, C. Cameron, M.S. Cunha, N. Dolez, G. Vauclair, E. Pallier, A.
Ulla, S.O. Kepler, A. da Costa, A. Kanaan, et al.
To cite this version:
D.W. Kurtz, C. Cameron, M.S. Cunha, N. Dolez, G. Vauclair, et al.. Pushing the ground-based limit: 14-mumag photometric precision with the definitive Whole Earth Telescope asteroseismic data set for the rapidly oscillating Ap star HR1217. Monthly Notices of the Royal Astronomical Society, Oxford University Press (OUP): Policy P - Oxford Open Option A, 2005, 358, pp.651-664. �hal-00388285�
2
0
0
5MNRAS.358.
.651K Mon. Not. R. Astron. Soc. 358, 651-664 (2005) doi: 10.111 l/j. 1365-2966.2005.08807.x
Pushing the ground-based limit: 14-|iimag photometric precision with the definitive Whole Earth Telescope asteroseismic data set for the rapidly oscillating Ap star HR 1217
D. W. Kurtz,1,2* C. Cameron,3 M. S. Cunha,4 N. Dolez,2 G. Vauclair,2 E. Pallier,2
A. Ulla,5 S. O. Kepler,6 A. da Costa,6 A. Kanaan,7 L. Fraga,7 O. Giovannini,8
M. A. Wood,9 N. Silvestri,9 S. D. Kawaler,10 R. L. Riddle,10 M. D. Reed,10’11
T. K. Watson,12 T. S. Metcalfe,13 A. Mukadam,13 R. E. Nather,13 D. E. Winget,13
A. Nitta,14 S. J. Kleinman,14 J. A. Guzik,15 P. A. Bradley,15 J. M. Matthews,3
K. Sekiguchi,16 D. J. Sullivan,17 T. Sullivan,17 R. Shobbrook,18 X. Jiang,19 P. V. Birch,20
B. N. Ashoka,21 S. Seetha,21 Y. Girish,21 S. Joshi,22 P. Moskalik,23 S. Zola,24’25
D. O’Donoghue,26 G. Handler,26 M. Mueller,27 J. M. Gonzalez Perez,28
J.-E. Solheim,28 F. Johannessen28 and L. Bigot29
1 Centre for Astrophysics, University of Central Lancashire, Preston PR1 2HE
2Observatoire Midi-Pyrénées, CNRS/UMR5572, 14 av. E. Belin, 31400 Toulouse, France
3 Department of Physics and Astronomy, University of British Columbia, 6224 Agricultural Road, Vancouver, BC V6T1Z1, Canada
^Centro de Astrofísica da Universidade do Porto, Rua das Estrelas, 4150-762 Porto, Portugal Instituto Superior da Maia, Lugar de Vüarinho, 4470 Castelo da Maia, Portugal
^Departamento de Física Aplicada, Universidade de Vigo, 36200 Vigo, Spain
6Instituto de Física, UFRGS, CP 15051, 91501-970 Porto Alegre, RS, Brazil I Universidade Federal de Santa Catarina, Florianópolis, SC, Brazil
^Departamento de Física e Química, Universidade de Caxias do Sul, 95001-970 Caxias do Sul, RS, Brazil
9 Department of Physics & Space Sciences and SARA Observatory, Florida Institute of Technology, Melbourne, FL 32901, USA
^Department of Physics and Astronomy, Iowa State University, Ames, IA 50011, USA
II Visiting Astronomer, CTIO, National Optical Astronomy Observatories, USA 12Southwestern University, 1001 E. University Avenue, Georgetown, TX 78626, USA
12 McDonald Observatory, and Department of Astronomy, University of Texas, Austin, TX 78712, USA uApache Point Observatory, PO Box 59, Sunspot, NM 88349, USA
l5X-2, MS T-085, Los Alamos National Laboratory, Los Alamos, NM 87545 USA
16 Subaru Observatojy, National Astronomical Observatory of Japan, 650 North A’ohoku Place, Hilo, HI 96720, USA 11 School of Chemical and Physical Sciences, Victoria University of Wellington, PO Box 600, Wellington, New Zealand
^Research School of Astronomy & Astrophysics, Australian National University, Cotter Road, Weston, ACT 2611, Australia
19 National Astronomical Observatories and Joint Laboratory of Optical Astronomy, Chinese Academy of Sciences, Beijing, 100012, China 20Perth Observatory, Walnut Rd, Bickley, Western Australia 6076, Australia
21 Indian Space Research Organization, Vimanapura PO, Bangalore 560017, India 22State Observatory, Manora Peak, Naini Tal 263 129, India
23Nicolaus Copernicus Astronomical Center, ul. Bartycka 18, 00-716 Warsaw, Poland 24 Crocow Pedagogical University, ul. Podchorzych 2, Cracow, Poland
25Astronomical Observatory, Jagiellonian University, ul. Orla 171, 30-244 Cracow, Poland 26South African Astronomical Observatory, PO Box 9, Observatory 7935, South Africa 21 Department of Astronomy, University of Cape Town, Rondebosch 7701, South Africa
^Department of Physics, University ofTroms0, N-9037 Troms0, Norway
29Niels Bohr Institute, Juliane Maries Vej 30, 2100 Copenhagen, Denmark
Accepted 2005 January 7. Received 2005 January 7; in original form 2004 September 13
ABSTRACT
HR 1217 is one of the best-studied rapidly oscillating Ap (roAp) stars, with a frequency spectrum of alternating even- and odd-f modes that are distorted by the presence of a strong, global magnetic field. Several recent theoretical studies have found that within the observable
^E-mail: dwkurtz@uclan.ac.uk © 2005 RAS
2
0
0
5MNRAS.358.
.651K 652 D. W. Kurtz et al. (the WET collaboration)
atmospheres of roAp stars the pulsation modes are magneto-acoustic with significant frequency perturbations that are cyclic with increasing frequency. To test these theories a Whole Earth Telescope extended coverage campaign obtained 342 h of Johnson B data at 10-s time resolution for the roAp star HR 1217 over 35 d with a 36 per cent duty cycle in 2000 November-December. The precision of the derived amplitudes is 14 qmag, making this one of the highest precision ground-based photometric studies ever undertaken. Substantial support has been found for the new theories of the interaction of pulsation with the strong magnetic field. In particular, the frequency jump expected as the magnetic and acoustic components cycle through 2tt rad in phase has been found. Additionally, comparison of the new 2000 data with an earlier 1986 multisite study shows clear amplitude modulation for some modes between 1986 and 2000. The unique geometry of the roAp stars allows their pulsation modes to be viewed from varying aspect with rotation, yielding mode identification information in the rotational sidelobes that is available for no other type of pulsating star. Those rotational sidelobes in HR 1217 confirm that two of the modes are dipolar, or close to dipolar; based on the frequency spacings and Hipparcos parallax, three other modes must be either f = 0 or 2 modes, either distorted by the magnetic field, or a mix of m-modes of given i where the mixture is the result of magnetic and rotational effects. A study of all high-speed photometric Johnson B data from 1981 to 2000 gives a rotation period Prot = 12.4572 d, as found in previous pulsation and photometric studies,
but inconsistent with a different rotation period found in magnetic studies. We suggest that this rotation period is correct and that zero-point shifts between magnetic data sets determined from different spectral lines are the probable cause of the controversy over the rotation period. This WET data set is likely to stand as the definitive ground-based study of HR 1217. It will be the baseline for comparison for future space studies of HR 1217, particularly the MOST satellite observations.
Key words: stars: individual: HR 1217 - stars: magnetic fields - stars: oscillations - stars: variables: other.
1 INTRODUCTION
The rapidly oscillating Ap (roAp) stars have been observed photo- metrically since their discovery by Kurtz (1982) over 20 years ago. Frequency analyses of their light curves have yielded rich astero- seismic information on the degrees of the pulsation modes, distor- tion of the modes from normal modes, magnetic geometries and luminosities. The latter, in particular, are derived asteroseismically and agree well with Hipparcos luminosities (Matthews, Kurtz & Martinez 1999).
New theoretical work on the interaction of pulsation with both rotation and the magnetic field by Bigot & Dziembowski (2002) has presented an entirely new look at the oblique pulsator model of these stars: they find that the pulsation axis is inclined to both the magnetic and rotation axes, and the pulsation modes are complex combinations of spherical harmonics that result in modes that, in many cases, can be travelling waves looking similar to (but are not exactly) sectoral m-modes. Bigot & Kurtz (2005) have shown that the improved oblique pulsator model of Bigot & Dziembowski ob- tains rotational inclination and magnetic obliqueness for the roAp star HR 3831 that are in agreement with those found from a mag- netic studies by Bagnulo, Landolfi & deglTnnocenti (1999); how- ever, Kochukhov (2004) finds a different magnetic and pulsation ge- ometry for HR 3831 that is in good agreement with the old oblique pulsator model and is inconsistent with the Bagnulo et al. (1999) ge- ometry. Further magnetic studies should differentiate between these two models.
In a similar study to that of Bigot & Dziembowski, Saio & Gautschy (2004) find modes that are aligned with the magnetic axis and are distorted by the magnetic field so that they cannot be described by single spherical harmonics; they note that horizontal motion can be comparable to vertical motion for these modes. It is the unique geometry of the pulsation modes in roAp stars that allows us to examine their non-radial pulsation modes from varying aspect as can be done with no other type of star.
1.1 High-resolution spectroscopy of roAp stars
The spectra of many roAp stars show a strong core-wing anomaly in the hydrogen lines, particularly the Ha line (Cowley et al. 2001; Kochukhov, Bagnulo & Barklem 2002). This indicates abnormal atmospheric structure, as does the fact that consistent abundances for the second and third ionization states of rare-earth elements, par- ticularly Nd and Pr, cannot be found for these stars (Ryabchikova et al. 2002). Until atmospheric models can be found that solve these problems, caution is called for, but new high-resolution spectro- scopic results for roAp stars suggest vertical stratification of some ions, particularly the rare earths, and they show the short vertical wavelength of the pulsation modes. It must also be cautioned that there are known horizontal abundance variations with concentration of rare-earth elements towards the magnetic poles. See, for example, studies of y Equ (HD 201601) (Kochukhov & Ryabchikova 2001a), HD 166473 (Kurtz, Elkin & Mathys 2003), aCir (Baldry et al. 1999; Kochukhov & Ryabchikova 2001b; Balona & Laney 2003),
2
0
0
5MNRAS.358.
.651K HR 1217 - WET asteroseismic data 653
HR 3831 (Baldry & Bedding 2000; Kochukhov & Ryabchikova 2001b), HR 1217 (Balona & Zima 2002; Sachkov et al. 2004) and 33 Lib (HD 137949) (Mkrtichian, Hatzes & Kanaan 2003; Kurtz, Elkin & Mathys 2005). The results of these studies are plausibly interpreted in terms of vertical resolution of the pulsation mode structure in the atmospheres of these stars, possibly with stratifica- tion of some ions. In general, Fe lines originate near a radial node around an optical depth of 75000 = 1 with little or no radial velocity variations seen; the core of the Ha line forms higher in the atmo- sphere and shows radial velocity variations with amplitudes up to several km s-1; lines from the first and second ionization states of
the rare earths Pr and Nd arise from a thin layer around an opti- cal depth of T 5000 = 10 3 and can also show amplitudes of several
km s_1.
The spectroscopic studies have thus allowed the beginning of a three-dimensional resolution of the pulsation modes, with the ver- tical stratification giving depth information, and the rotation of the oblique mode providing information on the surface geometry of the modes. While these spectroscopic tools are very powerful, they de- mand high spectroscopic resolution, high time resolution and high signal-to-noise ratio (S/N) - requirements that can only be met with large telescopes and optimized high-resolution spectrographs. It is thus not possible at present to study in detail the frequencies of many roAp stars spectroscopically because of the need for high duty cycle data sets over extended periods of time.
1.2 Photometry and asteroseismology of HR 1217
To obtain the frequencies that are the basic input data for astero- seismology it is thus necessary to observe roAp stars in multisite ground-based campaigns, as we report in this paper for the Whole Earth Telescope (WET) extended coverage campaign (Xcov20) on theroAp starHR 1217 (DOEri;HD 24712), orto observe them from space with dedicated asteroseismic satellites. The first of these satel- lites, MOST, was launched on 2003 June 30 and observed HR 1217 for 30 d during 2004 November-December. Hence the discoveries in this work will provide a baseline to compare with the MOST results. The data set analysed in this paper from Xcov20 will be referred to throughout the rest of this paper as the ‘2000 data’.
Of the 34 known roAp stars, HR 1217 is one of the best-studied. This star, discovered to be a pulsator by Kurtz (1982), was investi- gated with an extensive global campaign in 1986 (Kurtz et al. 1989). A key result from that data set (which we will refer to in this paper as the ‘1986 data’) was a list of six principal pulsation frequencies, five of which had alternating spacings of 33.4 and 34.5 pHz, the sixth of which was separated by a then inexplicable 50 pHz from the fifth frequency.
The asymptotic frequency spacing, v0 - known as the Targe spac-
ing’, is a measure of the sound crossing time of the star, which in turn is determined by the mean density and radius of the star. With a typical mass of Ap stars of approximately 2Mq, v0 reflects the
radius of the star, with Vo scaling as R~3/2. In the asymptotic limit,
the number of nodes in the radial direction, n, is much larger than the spherical degree £. Assuming adiabatic pulsations in spherically symmetric stars the pulsation frequencies are
vn,e — vo(n + t,/2 + e) + Sv,
where c is a (small) constant (Tassoul 1980,1990) and <5v, the ‘small spacing’, is a measure of the age of the star as it is sensitive to the cen- tral condensation, hence the core H mass fraction. Without precise identification of the degree (£) of the pulsation modes, asymptotic theory allows the frequency spacing to be uncertain by a factor of © 2005 RAS, MNRAS 358, 651-664
2, depending on whether modes of alternating even and odd i are present (producing modes separated by vo/2 in frequency), or only modes of the same Í with consecutive values of n.
The results of the 1986 campaign were inconclusive as to whether Vo was 68 or 34 pHz. Fortunately, the ambiguity could be resolved by a precise determination of the luminosity of the star. If v0 were
34 pHz, then the radius of HR 1217 would be large enough that it would be far removed from the main sequence (i.e. more evolved) and therefore more luminous (Heller & Kawaler 1988). Matthews et al. (1999) used the Hipparcos parallax measurement to place HR 1217 unambiguously close to the main sequence, thus deter- mining that v0 is indeed 68 pHz. This deepened the ‘mystery of
the sixth frequency’, lying |v0 higher than the fifth frequency. It is
easy to see from the above asymptotic frequency relation that there is no clear theoretical explanation for this spacing using the above asymptotic relation.
That asymptotic frequency spacing is valid only for linear adia- batic pulsations in spherically symmetric stars. However, the mag- netic field, the chemical inhomogeneities and rotation all contribute to breaking the spherical symmetry in roAp stars. It is therefore important to know the effects that these deviations from spherical symmetry have on the theoretical frequency spectra of roAp stars, before comparing those with the observed frequency spectra. The ef- fects of the chemical inhomogeneities have been discussed recently by Balmforth et al. (2001 ), but those will not concern us further here. The effects of the magnetic field on the oscillations of roAp stars (Dziembowski & Goode 1996; Bigot et al. 2000; Cunha & Gough 2000; Saio & Gautschy 2004), and the joint effect of rotation and magnetic field (Bigot & Dziembowski 2002), have been determined by means of a singular perturbation approach. While generally the magnetic field effect on the oscillations is expected to be small, Cunha & Gough (2000) found that at the frequencies of maximal magneto-acoustic coupling, the latter is expected to become signif- icantly large, resulting in an abrupt drop of the separation between mode frequencies.
The observational consequence of the results of Cunha & Gough (2000) suggested that we should see equally spaced modes in roAp stars with an occasional mode much closer to its lower-frequency counterparts. More recently, Cunha (2001) suggested that the expla- nation of the strange separation between the last two modes observed in HR 1217 in the 1986 data could rest on the occasional abrupt de- crease of the large separations predicted by Cunha & Gough (2000). For this prediction to hold, she argued that the observations of Kurtz et al. (1989) must have missed detecting a mode at a frequency 34 pHz higher than that of the fifth mode they observed. She pre- dicted that new, more precise measurements would find this ‘missing mode’ if the Alfvénic losses were not large enough to stabilize it. Detailed re-examination of the 1986 data shows no peak at the key position approximately 33 pHz above v5 at the ~0.1-mmag level.
In the preliminary analysis of the 2000 data we (Kurtz et al. 2002) found that missing mode, giving support to the theory of Cunha. In this paper we have analysed the data in far more detail and report in Section 4 that the new mode is in fact a pair of modes separated by 2.6 pHz, a value that is potentially the small spacing, <5v. The small spacing has not been unambiguously determined for any roAp star. One of the pair of new modes fits the alternating 33.4, 34.5 pHz spacing of the first five modes, and is now separated by nearly precisely \ v0 from the highest detected frequency. The theoretical
importance of this new result will be discussed in Section 4. We also report in Section 4.1 significant amplitude modulation of some of the modes between the 1986 and 2000 data sets, particularly for the frequencies now identified in this paper as v3 and V4, but also
2
0
0
5MNRAS.358.
.651K 654 D. W. Kurtz et al. (the WET collaboration) for the newly discovered frequencies, v7 and v8- This explains why
these frequencies were not seen in the 1986 data set - they were below the noise level for that data set, but grew to larger, detectable amplitudes in the Xcov20 2000 data set. Interestingly, we find that the total power for all observed modes is the same in the 1986 and 2000 data sets, even though there have been significant shifts of amplitude between modes, suggesting that the total pulsational energy may be conserved. This is the first time that an roAp star has been observed in enough detail with independent studies to determine this, and it is an important discovery to test against the upcoming MOST satellite data set, which will have far higher S/N ratio.
1.3 Astrophysical data for HR 1217
One of the strengths of studying HR 1217 is that there is a wealth of astrophysical information known about it. Its parallax was de- termined by Hipparcos giving a luminosity of L = 7.8 ± 0.7 Lq (Matthews et al. 1999). As mentioned earlier, the atmospheres of the most peculiar of the roAp stars show a strong core-wing anomaly (Cowley et al. 2001) in the H lines indicating an extremely abnormal temperature-depth structure to their atmospheres. HR 1217 has this core-wing anomaly. A first attempt at self-consistent atmospheric models that can account for the core-wing anomaly has been made (Kochukhov et al. 2002), but it is not yet even possible to model the Baimer lines fully. The effective temperatures of the roAp stars are thus notoriously difficult to determine. Nevertheless, various photo- metric and spectroscopic studies conservatively give Teii ^ 7300 zb
200 K.
The magnetic field has been studied extensively over the years (Preston 1972; Mathys 1991 ; Bagnulo et al. 1995; Mathys & Hubrig 1997; Leone, Catanzaro & Catalano 2000; Wade et al. 2000). Bagnulo et al. found from broad-band linear polarimetry a polar field strength of approximately 3.9 kG, a rotational inclination of i = 137° and a magnetic obliquity of ß = 150°. The errors on these values are uncertain, but they give us a starting point to discuss the geometry of the pulsation modes.
The rotation period has been controversial, with some (but not all) studies of the magnetic field finding Prot = 12.4610 d and other
studies of the magnetic field, the photometric variations and, par- ticularly, the pulsation finding Prot = 12.4572 d. We discuss this
problem in detail in Section 4.3 where we find that the pulsation data are definitely best-fitted with Pmt — 12.4572 d.
The rotational sidelobes are the key to mode identification in the roAp stars, within the oblique pulsator model (Shibahashi & Takata 1993; Takata & Shibahashi 1995), the improved oblique pulsator model (Bigot & Dziembowski 2002) and the new theory of Saio & Gautschy (2004). We discuss these sidelobes in detail in Section 4.2 where we find they are unchanged between the 1986 and 2000 data sets, and that V2 and V4 seem to be dipole, or dipole-like modes. Arguments from standard A-star models and the frequency spacings suggests that the even-£ modes are probably distorted radial modes, but distorted quadrupole modes cannot be ruled out.
Pulsational radial velocity variations were discovered by Matthews et al. (1988) and have been studied in more detail recently by B alona & Zima (2002) who find rotationally modulated pulsa- tional radial velocity variations that are consistent with the known photometric frequencies. As discussed above, there is a wealth of information in high-precision radial velocity studies of roAp stars. For HR 1217, with its multiple frequencies spaced by ~3 d-1, fur-
ther progress in this field will need a multisite, 8-m-class telescope campaign. One continuous run of 24 h is all that is needed, so this
is possible - especially as HR 1217 at <5 = —12° is accessible from both hemispheres.
1.4 The importance of the asteroseismic study of HR 1217 HR 1217 is important for both the study of roAp stars and for as- teroseismology in general. Cunha, Fernandes & Monteiro (2003) have recently performed seismic tests of the structure of HR 1217. They find that the interior chemical composition has more effect on the theoretical oscillation spectrum than does convection and over- shooting. Models with lower abundances of heavy elements in the interior and increased helium come closer to matching the observed frequencies, but they have difficulty finding a plausible model that can yet reproduce the seismic observations of HR 1217. Even though their theoretical predictions can be reconciled with the observations, when the uncertainty in the radius is accounted for, the fact that a systematic shift is found between predicted and observed large sep- arations when different roAp stars are considered (Matthews et al. 1999) might indicate that something is still missing in the theoretical models.
Cunha et al. (2003) emphasize that one important aspect that is not yet well understood is the way in which waves are reflected near the surface of these stars. They argue that if the process of reflection of high-order modes in HR 1217 is frequency dependent, then the large separations could be different from those obtained in their work. Observationally, the complexity of the reflective boundary layer can now be seen for the roAp star 33 Lib (Kurtz et al. 2005). A theory that takes into account the magneto-acoustic nature of the waves near the surface of these stars should be used in order to improve the current models. Thus, the present observations can contribute to the follow-up of this work, not only because of the improvements that they bring to the power spectrum of HR 1217, but also because of their possible contribution to our understanding of the magnetic field of this star.
In this paper we report the frequency analysis of 342 h of high- speed photometry spanning 35 d with a duty cycle of 36 per cent. The resulting amplitude spectra have noise peaks no higher than 80 tima,1 and least-squares errors in amplitude of only 14 tima,
making this one of the highest precision photometric studies ever undertaken. As outlined in this introduction, we have learned much concerning HR 1217 from WET Xcov20. We have also learned again how complex the roAp stars are. WET Xcov20 is likely to stand as the definitive ground-based study of this star. This is the study that will provide the basis of comparison for higher precision space asteroseismic studies.
2 OBSERVATIONS
WET Xcov20 began on 2000 November 6 and continued for 35 d. Table 1 lists the individual observing runs used in this anal- ysis. Many other runs on marginally photometric nights were re- jected because of the demand for very high precision necessary for this study; some other runs were rejected because of equip- ment problems with particular telescopes in the network. In total
1 qma denotes micromodulation amplitude and mma denotes millimodula-
tion amplitude. These are in units of 10-6 and 10 3 of the intensity vari-
ation. For amplitudes as low as these they are equal to —1.087 pmag and — 1.087 mmag, respectively. We use pma and mma throughout this study of the Whole Earth Telescope data newly presented here, but use pmag and mmag for older data where those were the units used in those studies.
2
0
0
5MNRAS.358.
.651K HR 1217 - WET asteroseismic data 655
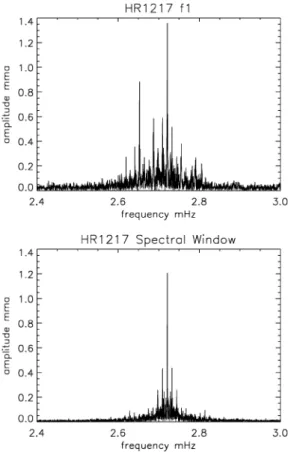
Table 1. Observing log of high-speed photometry of HR 1217 from the Whole Earth Telescope Extended Coverage Campaign 20 (WET Xcov20). Columns 2 and 3 list the ut starting date and time of each run. Data were taken with 10-s integrations and then averaged to 40-s integrations; columns 4-6 list the number of 40-s integrations after bad points were removed, the duration of the run in hours and the standard deviation per point of the data in that run after low-frequency sky transparency variations were removed. The BJED start and finish times are for the 40-s integrations that were used in the analysis; in general the first few observations in a run were sky, so the BJED of the first point does not correspond precisely to the ut start time of the run - it begins a short time later. Where the number of points seems few for the duration of the run there are gaps in the data, usually because of cloud, but sometimes because of instrumental problems. Run name Date
2000 start UT N AT (h) (mma) BJED start BJED end Observatory Tel (m) mdrl36 mdrl37 mdrl38 mdrl39 mdrl40 rndrMl sa-od044 mdrl42 sa-od045 teidenOl mdrl43 mdrl44 no!700q2 nol700q3 teiden04 nolSOOql teidenOS sa-od047 nol900q2 sa-od048 teiden06 asm-0079 no2000ql sa-od049 asmOOSl sa-m0003 sa-m0004 teidenOS joy-002 no2300ql pvbll23 sa-m0005 teidenlO pvbll24 sa-m0006 teidenll no2500ql teidenl2 joy-012 no2600q2 jxj-0124 sa-m0007 teidenl3 joy-016 no2700ql jxj-0127 sa-m0008 teidenl4 joy-020 no2800ql sa-h-046 teiden 15 joy-025 no2900ql sa-gh465 teiden 16 joy-028 no3000ql November 6 November 9 November 10 November 12 November 13 November 14 November 14 November 15 November 15 November 16 November 16 November 17 November 17 November 17 November 17 November 18 November 18 November 18 November 19 November 19 November 19 November 20 November 20 November 20 November 21 November 21 November 22 November 22 November 23 November 23 November 23 November 23 November 23 November 24 November 24 November 25 November 25 November 25 November 26 November 26 November 26 November 26 November 26 November 27 November 27 November 27 November 27 November 27 November 28 November 28 November 28 November 28 November 29 November 29 November 29 November 29 November 30 November 30 02:23:30 01:55:20 01:59:50 02:16:00 01:34:30 01:27:40 21:03:00 01:28:10 19:20:00 00:42:10 01:23:00 01:18:20 07:28:00 12:34:20 22:09:10 07:22:30 22:53:20 23:29:00 10:14:20 18:55:00 22:05:30 03:58:40 07:37:00 18:51:00 09:06:10 19:26:50 18:28:20 22:07:20 03:59:50 07:15:50 12:15:41 18:11:50 22:05:40 12:18:40 18:18:00 02:03:30 07:03:10 22:09:20 03:55:50 06:59:30 14:14:50 18:28:40 21:50:30 04:03:00 06:38:00 13:44:10 18:27:50 22:28:20 04:04:20 06:45:00 18:54:30 22:01:50 04:00:40 06:41:00 20:30:30 21:18:50 01:19:10 06:40:50 328 380 278 596 632 38 419 655 597 317 674 678 300 33 541 401 292 128 343 579 547 473 550 630 73 566 669 143 455 423 105 83 482 593 633 107 593 492 363 583 340 652 34 405 562 425 668 330 134 44 606 494 436 589 427 239 466 592 4.36 4.24 3.30 6.67 7.03 0.51 4.82 7.27 7.03 3.65 7.52 7.53 3.35 0.36 6.03 6.26 3.31 1.44 3.84 6.76 6.13 5.78 6.14 7.33 0.84 6.71 7.64 1.62 5.22 5.52 1.20 1.10 5.45 6.90 7.73 1.20 6.66 5.59 4.07 6.47 3.79 7.47 0.40 4.75 6.72 4.73 7.56 3.70 1.54 1.84 7.33 5.50 5.21 6.76 5.19 2.64 5.23 6.76 1.47 0.93 1.22 1.29 1.75 2.35 2.44 1.95 2.43 1.36 2.21 2.11 2.22 2.15 2.11 1.78 1.76 1.77 1.62 1.28 1.32 1.86 1.72 1.43 1.82 1.84 1.97 1.82 1.58 1.39 1.32 2.59 1.86 1.84 1.77 2.07 1.84 2.52 2.00 2.31 4.42 2.90 1.67 3.87 2.66 2.86 3.57 2.94 4.19 2.97 2.64 3.09 2.80 2.52 2.34 2.38 2.09 2.11 1854.609 565 1857.695708 1858.590508 1860.601051 1861.573 740 1862.567 839 1863.383 580 1863.567 955 1864.311936 1864.535778 1864.564713 1865.561007 1865.817 025 1866.030797 1866.428 944 1866.824 862 1867.459609 1867.484 841 1867.934491 1868.294557 1868.426269 1868.673 143 1868.825 340 1869.291656 1869.887 947 1870.316 357 1871.275 902 1871.427513 1871.678 668 1871.810495 1872.057 263 1872.265 350 1872.426459 1873.018 928 1873.271528 1873.586220 1873.801439 1874.428 975 1874.669481 1874.798761 1875.101533 1875.275 952 1875.415 880 1875.674440 1875.783 813 1876.079 525 1876.275 065 1876.442134 1876.675 347 1876.791317 1877.295 357 1877.423711 1877.672780 1877.785 972 1878.277 628 1878.518 308 1878.668 360 1878.785719 1854.790 931 1857.872444 1858.728 008 1860.878 945 1861.866795 1862.589 019 1863.584 274 1863.870 964 1864.604760 1864.687 861 1864.878 139 1865.874 549 1865.956 608 1866.. 045 843 1866.680 029 1867.085 655 1867.597 341 1867.545 026 1868.094444 1868.576270 1868.681478 1868.913 999 1869.081243 1869.597 096 1869.922 900 1870.596 044 1871.594 052 1871.494 874 1871.. 896 029 1872.040 587 1872.. 107 147 1872.. 311 357 1872.653 600 1873.. 306 543 1873.593 693 1873.636 336 1874.078 899 1874.662 019 1874.. 839 272 1875.068 205 1875.259 404 1875.587 352 1875.. 432 546 1875.. 872 241 1876.063 790 1876.276747 1876.589 880 1876.596 185 1876.. 739 583 1876.. 868053 1877.600 682 1877.652704 1877.. 889 678 1878.067 685 1878.493 948 1878.628 494 1878.. 886 069 1879.067 200 CTIO CTIO CTIO CTIO CTIO CTIO SAAO CTIO SAAO OTIAC CTIO CTIO MKO MKO OTIAC MKO OTIAC SAAO MKO SAAO OTIAC McD MKO SAAO McD SAAO SAAO OTIAC McD MKO PO SAAO OTIAC PO SAAO OTIAC MKO OTIAC McD MKO BAO SAAO OTIAC McD MKO BAO SAAO OTIAC McD MKO SAAO OTIAC McD MKO SAAO OTIAC McD MKO 1.5 1.5 1.5 1.5 1.5 1.5 1.9 1.5 1.9 0.8 1.5 1.5 0.6 0.6 0.8 0.6 0.8 1.9 0.6 1.9 0.8 2.1 0.6 1.9 2.1 0.75 0.75 0.8 2.1 0.6 0.6 0.75 0.8 0.6 0.75 0.8 0.6 0.8 2.1 0.6 0.85 0.75 0.8 2.1 0.6 0.85 0.75 0.8 2.1 0.6 1.9 0.8 2.1 0.6 1.9 0.8 2.1 0.6 ) 2005 RAS, MNRAS 358, 651-664
2
0
0
5MNRAS.358.
.651K 656 D. W. Kurtz et al. (the WET collaboration) Table 1 - continued
Run name Date
2000 start UT AT (h) (mma) BJED start BJED end Observatory Tel (m) sa-gh466 teidenl? sa-gh467 sa-gh468 sa-gh469 sa-gh470 teidenl 8 sa-gh471 sa-gh472 sa-gh473 teidenl 9 sa-gh474 sa-gh475 tsm-0087 tsm-0089 r00-022 r00-025 teiden22 teiden24 teiden27 November 30 November 30 November 30 November 30 December 1 December 1 December 1 December 1 December 2 December 2 December 2 December 3 December 4 December 5 December 6 December 6 December 7 December 8 December 9 December 11 Total 19:30:20 21:17:50 21:19:50 22:15:20 00:39:00 18:57:20 22:04:00 22:30:00 18:46:50 21:38:30 21:46:50 18:35:20 21:51:00 05:50:40 03:47:00 18:55:00 16:53:20 21:37:40 21:01:50 00:20:40 140 404 67 204 131 294 338 310 229 356 125 616 329 249 321 201 202 121 168 201 1.67 5.92 0.75 2.33 1.52 3.45 3.85 3.65 2.77 4.31 1.38 7.47 4.20 2.99 4.00 2.22 2.24 1.40 1.90 2.22 341.94 1.16 2.03 2.00 1.48 2.31 1.46 1.46 1.56 1.48 1.22 1.90 1.59 1.22 1.46 2.02 1.82 1.96 2.42 2.87 2.49 1879.318 577 1879.393 112 1879.394 616 1879.432 926 1879.532 692 1880.295 983 1880.425 147 1880.443 549 1881.289 014 1881.407 992 1881.413 316 1882.281 116 1883.416 385 1883.749 014 1884.663 106 1885.296 998 1886.209 392 1887.406 650 1888.381731 1889.526 538 1879.388137 1879.639929 1879.. 425 982 1879.530032 1879.596118 1880.439 849 1880.585 390 1880.595 633 1881.404523 1881.587 621 1881.470723 1882.592459 1883.591500 1883.873 782 1884.829 657 1885.389 591 1886.302563 1887.465 099 1888.461013 1889.. 619 189 35.01 SAAO OTIAC SAAO SAAO SAAO SAAO OTIAC SAAO SAAO SAAO OTIAC SAAO SAAO McD McD ARIES ARIES OTIAC OTIAC OTIAC 1.9 0.8 1.9 1.9 1.9 1.9 0.8 1.9 1.9 1.9 0.8 1.9 1.9 2.1 2.1 1.0 1.0 0.8 0.8 0.8 The observatories are: CTIO, Cerro Tololo Interamerican Observatory, La Silla, Chile; SAAO, South African Astronomical Observatory, Sutherland, South Africa; OTIAC, Observatorio del Teide de Instituto de Astrofísica de Canarias, Teide, Tenerife, Spain; MKO, Mauna Kea Observatory, Hawaii, USA; McD, McDonald Observatory, Mt Locke, Texas, USA; PO, Perth Observatory, Bickley, Western Australia, Australia; BAO, Beijing Astronomical Observatory, Beijing, China; ARIES, Aryabhatta Research Institute of Observational Sciences, Manora Peak, Naini Tal, India.
43.02 -ÖJ! g Ö..ÖQ 0.01 - 0.02 1 i 1877,50 1877.5 ! 1877 52 ! 877 S3 ! 87 7 54 ËJIÛ
Figure 1. An example of a 1-h section of the light curve of HR 1217 with overlapping data from SAAO (triangles) and OTIAC (circles). The excellent agreement between the two observatories is apparent.
♦ £ 54 < Ä A A *4 À h
V V V\‘V
341.94 h of observations were analysed and are listed in Table 1. They span 35.01 d. There was overlap between observatories for 40.65 h of the 341.94 h total, so the duty cycle for the entire run was 36 per cent = (341.94-40.65)/(35.01 x 24). The overlapping light curves from pairs of observatories show good agreement, as can be seen in Fig. 1.
The telescopes used range in aperture from 0.6 to 2.1 m. Data from all sites were obtained using photoelectric photometers, with 10-s individual integrations. At Beijing Astronomical Observatory, McDonald Observatory, Mauna Kea Observatory, State Observa- tory at Naini Tal and Observatorio del Teide, the observers used three-channel photometers that are functionally similar to the equip- ment described in Kleinman, Nather & Phillips (1996). The South African Astronomical Observatory and Perth Observatory observa- tions were made with single-channel photometers, and the observa- tions at CTIO with a two-channel photometer. At all sites, obser- vations were made through a Johnson B filter, along with neutral
density filters when needed to keep the count rates below 106 s-1.
Following the procedures described in Kleinman et al. (1996), the sky background was continuously monitored with the three-channel instruments. At sites using two- and single-channel photometers, the sky was obtained several times during the night at irregular inter- vals, and then interpolated during reduction. Dead-time corrections were measured and applied for all photometers. After bad points were removed and the data reduced using standard procedures, low- frequency sky transparency noise was removed by successive pre- whitening of low-frequency peaks until the low-frequency noise was of the same amplitude as that at higher frequencies; in gen- eral this procedure was applied to frequencies below 0.6 mHz (i.e. on time-scales longer than approximately 30 min), but for no run does the low-frequency filtering affect the pulsation frequencies near 2.7 mHz. The principal reason for removing low-frequency noise is to obtain white noise across the frequency spectrum for appropriate estimates of least-squares errors. The 10-s integrations were co- added to 40-s integrations to reduce the computing time and smooth high-frequency noise in the visual inspection of the light curves.
During a WET campaign data are reduced at headquarters by a variety of people to a high standard. Nevertheless, it is WET policy to re-reduce all data in a campaign uniformly. This is best performed by one person working diligently to the highest standard of precision. In the case of Xcov20 and the HR 1217 data analysed in this paper, all reductions were uniformly carried out by one of us (CC), and then double-checked by another of us (DWK).
3 FREQUENCY ANALYSIS
Fourier analysis of the data listed in Table 1 was performed using a discrete Fourier transform for unequally spaced data. Fig. 2 shows
2
0
0
5MNRAS.358.
.651K HR 1217 - WET asteroseismic data 657
HR 1217 XCOV20
Figure 2. An amplitude spectrum of the entire data set showing that all of the signal is near 2.7 mHz. The first harmonic of the unresolved frequencies can be seen in some of the individual runs when the amplitude is highest, but not in the entire data set.
the amplitude spectrum over the range 0-6 mHz, where it can be seen that all of the signal is concentrated near 2.7 mHz.
In some of the individual data sets the first harmonic of the un- resolved frequencies can be seen. Harmonics are commonly ob- served in roAp stars, so it is no surprise to find evidence of them for HR 1217, although they remain unexplained theoretically. Re- cently, Kurtz et al. (2005) have found that the 4.030-mHz harmonic in HD 137949 has a higher amplitude than the 2.015-mHz mode at some atmospheric depths; it is clear now that the harmonics of the modes in roAp stars can be studied in much more detail spectro- scopically than photometrically. In any case, at the low S/N ratio available for the harmonics for HR 1217, there is nothing useful that we can do with them here.
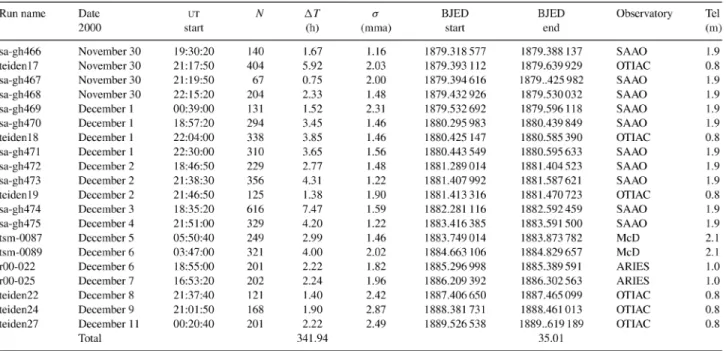
In Fig. 3 we expand the region where there is signal to show the amplitude spectrum at higher resolution. The level of the highest noise peaks in the amplitude spectrum is approximately 80 pma making this one of the highest precision ground-based data sets ever obtained. The bottom panel of Fig. 3 shows the spectral window for our 36 per cent duty cycle data set. While there is still some cross-talk between the spectral windows of the real frequencies, it is possible with sequential pre-whitening to extract the component frequencies with considerable confidence.
We show some of this sequential pre-whitening in Fig. 4 for the three highest peaks. The techniques we used were: to identify the highest peak in the amplitude spectrum; fit the frequency of that peak and all previously determined peaks by linear least squares to the data with their rotational sidelobes fixed using the known rotation frequency (from Pmi = 12.4576 d - Kurtz & Marang 1987 and
Section 4.3 below); then use the non-linear least-squares method to optimize the frequencies, and the amplitudes and phases, and to determine formal errors on the frequencies; then to revert to the linear least-squares method using the mode frequencies from the non-linear least-squares fit, but again fixing the rotational sidelobes using the known rotational frequency spacing. The frequencies of the rotational sidelobes did not shift significantly in the non-linear least-squares fits, but it is important to keep them at exactly the rotational frequency spacing to examine their phases in the final interpretation of the data, as is seen in Section 4.2 below. (From our knowledge of roAp stars it seems a reasonable assumption that the rotational sidelobes are spaced at the rotational frequency. Tests of this assumption with the current data set are consistent with it.) The data were then pre-whitened by the solution and the next highest © 2005 RAS, MNRAS 358, 651-664
HR1217 fl
frequency mHz HR1217 Spectral Window
frequency mHz
Figure 3. The top panel shows the amplitude spectrum for the entire data set over the frequency range where there is significant signal. The bottom panel shows the spectral window for the highest peak in the top panel. This has been generated by sampling a noise-free sinusoid with the same frequency and amplitude as the highest peak at the actual times of the observations. The amplitude used is taken from the final determination of the frequencies given in Table 2. The difference between the amplitudes of the highest peak in the top panel and in the spectral window in the bottom panel gives a good indication of the amount of cross-talk between the spectral windows of the real frequencies. In a careful examination of both panels the presence of the rotational sidelobes can be seen in the top panel, but not in the spectral window in the bottom panel.
significant peak searched for. This was continued until no further significant peaks could be extracted.
From the panels in Fig. 4 it can be seen that the duty cycle is sufficient that crosstalk among the pulsation frequencies and their rotational sidelobes is not a major problem. Fig. 5 shows a schematic amplitude spectrum of the determined frequency solution and Table 2 gives the frequencies, amplitudes, phases and formal inter- nal errors for that solution. Eight independent pulsation modes were found with significant first rotational sidelobes for most of them. The second rotational sidelobes did not have amplitudes higher than the highest noise peaks, so are not included in the solution, although for v4 they are formally significant. The lowest-amplitude rotational
sidelobes fitted in Table 2 are only formally significant; as they have amplitudes lower than the highest noise peaks, they cannot be considered to be really detected, but the are included in the fit for completeness and to put a limit on their possible amplitudes.
Additional peaks were found near v2 and v3 and are listed in
Table 2. Similar peaks were seen in the 1986 data (Kurtz et al. 1989) and are suspected to be caused by frequency and/or amplitude modulation over the time-span of the data set. As can be seen in Fig. 5
2
0
0
5MNRAS.358.
.651K 658 D.W. Kurtz et al. (the WET collaboration)
2.4 2.6 2.8 3.0 frequency mHz 2.4 2.6 2.8 3.0 frequency mHz HR1217 residuals 2.4 2.6 2.8 frequency mHz 3.0 0.4 0.3 R o E E v -o 0.2 R "5. E o 0.1 r ÍLIuÍIiiMéILíjI i.lI A 0.0 2.4 2.6 2.8 frequency mHz 3.0
Figure 4. The upper left-hand panel shows the amplitude spectrum for the entire data set over the frequency range where there is significant signal. This is the same as the top panel in Fig. 3 and is reproduced here for easy comparison with the amplitude spectra in the other panels; the highest peak is y4 (where the frequencies are labelled in order of increasing frequency; see Table 2). The upper right-hand panel shows the amplitude spectrum after the highest peak, y4, and its rotational sidelobes have been pre-whitened; the highest peak here is y2. The lower left-hand panel shows the same after y4 and y2 and their rotational sidelobes have been pre-whitened; the highest peak is y 3. The text explains the use of linear and non-linear least squares in the procedure. The lower right-hand panel skips many steps to show the residuals after v \ to yg, their rotational sidelobes and two other significant frequencies have been pre-whitened. Note the change of ordinate scale in the bottom right-hand panel. There is some amplitude left above the noise level. This could be caused by further, low-amplitude, undetected frequencies; by amplitude or frequency variation over the 35-d data set; or by imperfect pre-whitening because of some cross-talk among the spectral windows of the real frequencies.
and discussed in Section 4.1, there is clear amplitude modulation between the 1986 and 2000 data, making it believable that small amounts of such modulation may be detected over a 35-d time- span. These additional peaks, named v2+ and v3_ in Table 2 are not
fully resolved from the peaks they are close to, so they are quoted to much lower precision in frequency. They should only be taken to be indicative of additional amplitude left in the amplitude spectrum after pre-whitening by the eight-frequency solution with rotational sidelobes.
4 RESULTS
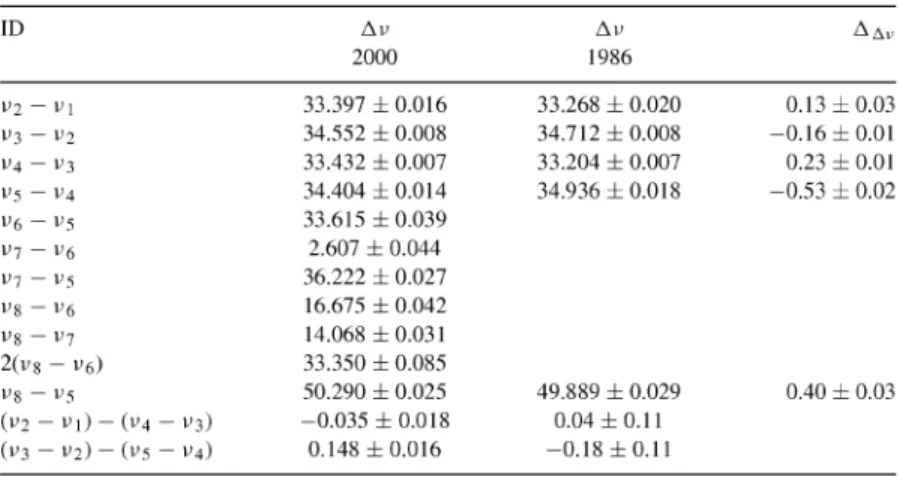
In their preliminary analysis of the Xcov20 2000 data Kurtz et al. (2002) discovered the ‘missing’ mode in HR 1217 predicted by Cunha (2001). The most striking new result we find here in the analysis of the full data set is that the new frequency is actually two modes very closely spaced. In the determination of these frequencies we are working near the S/N ratio limit in even this outstandingly low-noise data set, so that confirmation of our results will have to await the analysis of the MOST data set. However, the frequencies determined have spacings with respect to the other frequencies that give us some confidence in their reality. We show the frequency spacings in Table 3 and compare them to those determined in the 1986 data set, where the errors on frequency for the 1986 data are
from a new non-linear least-squares fit we have performed for those data.
Table 3 suggests that the frequency separations are variable by up to few tenths of a pHz. Given that it is known that there is frequency variability in roAp stars, with an amplitude of 0.12 pHz on a 1.6-yr time-scale in the case of HR 3831 (Kurtz et al. 1997), this variability in the frequency separations in HR 1217 seems to be real. The cause of this frequency variability in roAp stars is not known.
As can be seen from Table 3, and in Fig. 5, there is an alternat- ing frequency spacing of approximately 33.4 and 34.5 pHz, con- sistent with an interpretation of alternating even and odd f-modes, although, for HR 1217 the modes cannot be pure spherical harmonic modes. The spacing of v 8—v 6 is, within the errors, exactly half of the
33.4-|uHz spacing, and the spacing of V7—V6 = 2.6 pHz is possibly the ‘small spacing’.
Cunha (2001) suggested that in HR 1217 an optimal magneto- acoustic coupling, associated with large energy losses, takes place at a frequency - which we will call Vjump - lying between the last
two modes observed in the 1986 data. If this suggestion is correct, then any mode in HR 1217 with an unperturbed frequency (i.e. the frequency that the mode would have if there were no magnetic field) above Vjump should have its frequency substantially reduced by the
magnetic field. As two new modes were found with frequencies close to Vjump, namely and v7, we should ask whether these new
2
0
0
5MNRAS.358.
.651K HR 1217 - WET asteroseismic data 659
HR 1217 - 2000 data Table 2. The frequency solution for HR 1217.
HR 1217 1986 data ID vi - vrot VI Vl + Vrot V2 - Vrot V2 V2 + Vrot V3 - Vrot V3 V3 + Vrot V4 - Vrot V4 V4 + Vrot V5 - Vrot V5 V5 + Vrot V6 Vrot V6 V6 + Vrot V? - Vrot V7 V? + Vrot V8 - Vrot V8 V8 + Vrot V2+ V3- OuHz) A (mma) 2618.617 2619.546 ± 0.015 2620.475 2652.014 2652.943 ± 0.005 2653.872 2686.566 2687.495 ± 0.006 2688.424 2719.998 2720.927 ± 0.003 2721.856 2754.402 2755.331 ± 0.014 2756.260 2788.017 2788.946 ± 0.037 2789.875 2790.624 2791.553 ±0.023 2792.483 2804.692 2805.621 ± 0.021 2806.550 2653.4 2686.2 0.069 ± 0.235 ± 0.106 ± 0.246 ± 0.767 ± 0.209 ± 0.238 ± 0.573 ± 0.241 ± 0.374 ± 1.176 ± 0.416 ± 0.196 ± 0.273 ± 0.123 ± 0.056 ± 0.105 ± 0.100 ± 0.130 ± 0.191 ± 0.042 ± 0.051 ± 0.180 ± 0.129 ± 0.114 ± 0.201 ± 0.014 0.014 0.014 0.014 0.014 0.014 0.015 0.014 0.014 0.014 0.014 0.014 0.014 0.014 0.014 0.014 0.014 0.014 0.014 0.014 0.014 0.014 0.014 0.014 0.014 0.015 0 (rad) 2.42 ± 0.20 2.24 ± 0.06 2.49 ±0.13 1.09 ±0.06 1.08 ±0.02 1.02 ±0.07 1.18 ±0.06 0.53 ± 0.03 0.86 ± 0.06 -2.54 ± 0.04 -2.77 ± 0.01 -2.85 ± 0.03 -2.27 ± 0.07 -2.04 ± 0.05 -1.87 ±0.11 1.12 ±0.25 1.23 ±0.14 0.37 ±0.14 0.38 ±0.11 0.26 ± 0.08 0.53 ± 0.34 1.23 ±0.28 2.44 ± 0.08 1.51 ±0.11 2.52 ±0.13 0.66 ± 0.07 Figure 5. Top panel: a schematic amplitude spectrum of the adopted fre-
quency solution given in Table 2. The spacing of the rotational sidelobes is exaggerated to make them easier to see. Bottom panel: the same for the 1986 data, again with exaggerated rotational sidelobe separations to make them easier to see.
modes have corresponding unperturbed frequencies below or above Vjump. The simplest interpretation, in the light of Cunha’s suggestion, is that V6 is the ‘missing mode’ already referred to in her work. In this case its unperturbed frequency is smaller than Vjump and is only
slightly changed (enlarged) by the presence of the magnetic field. Assuming this interpretation holds, then v7 can either be a mode
with an unperturbed frequency very close to that of v6, and also
smaller than VjUmp, or it can be a mode where the frequency, in the
absence of the magnetic field, would be above Vjump, but has been
greatly reduced due do the effect of the magnetic field.
In the first case, the simplest interpretation is that Vß and v7 are
modes with consecutive orders and degrees differing by two, hence differing in frequency by the ‘small spacing’. In that case only v8
would have its frequency greatly reduced by the magnetic field. Un- fortunately, the theory developed by Cunha & Gough (2000) has to be improved before one can quantify with precision the amount by which the frequency of v8 is decreased. Preliminary results (Cunha,
in preparation) indicate that modes with frequencies larger than that at which the maximum coupling takes place have their frequencies decreased by a fraction of the large separation, that fraction being determined by an integral that depends on the degree of the mode and the geometry of the magnetic field. However, in order to know whether that fraction is the 25 per cent implied by the observations, under this interpretation, it is necessary first to improve the theoret- ical model.
The second possibility considered here is more interesting, in the sense that it puts additional constraints on Cunha’s interpretation.
<7fit — 1.65 mma. to — BJED2451876.93.
If the unperturbed frequency of v7 is above Vjump, it is necessary
to explain simultaneously the abrupt decrease in the frequencies of two modes, namely v 7 and v 8. In her preliminary calculations Cunha
found that for a dipole field, the decrease in the frequency of l = 0 modes is considerably larger than the decrease in the frequencies of f = 1 and 2 modes. Thus, with the current models, the only combination that she found for which both v7 and v8 would have
unperturbed frequencies above Vjump requires v7 to bean £ = 1 mode
and v8 to be an £ = 0 mode. Moreover, this interpretation is possible
only if Vß has even degree, which, due to the alternation between even and odd degrees in the power spectrum, would also imply even degrees for v2 and v4. As the latter two modes are more likely to be
dipole modes, at the moment the interpretation that both new modes have unperturbed frequencies below Vjump and that their frequencies
differ by an amount that is equal to the small spacing is favoured by Cunha’s theory. We emphasize, however, that due to the strong dependence of Cunha’s results on the geometry of the magnetic field, this conclusion might be modified if the magnetic field geometry of HR 1217 is not dipolar. We also note that in the work of Bagnulo et al. (1995) the authors state that their polarimetric study cannot distinguish between a dipolar magnetic field and one described by a dipole plus a co-linear quadrupole, i.e. a centred dipole field, or a displaced dipole field.
Recently, Saio & Gautschy (2004) have also studied the mag- netic perturbations to the eigenfrequencies, and found results which are qualitatively in agreement with those of Cunha & Gough (2000). Rather than applying a variational principle, as Cunha & Gough did, Saio & Gautschy expanded the solutions in sums of spherical harmonics and determined, simultaneously, the perturbed © 2005 RAS, MNRAS 358, 651-664
2
0
0
5MNRAS.358.
.651K 660 D. W. Kurtz et al. (the WET collaboration)
Table 3. Comparison of the HR 1217 frequency spacings between the 2000 WET data and the 1986 data. ID Av 2000 Av 1986 X>2 — V\ y3 - y2 y4 - v3 V5 — V4 ^6 - V5 y7 - y6 y7 - y5 V8 - V6 y8 - v7 2(v8 - v6) V8 — V5 (vi - vi) - (y4 - y3) (y3 - y2) - (ys - v4) 33.397 ± 0.016 34.552 ± 0.008 33.432 ± 0.007 34.404 ± 0.014 33.615 ± 0.039 2.607 ± 0.044 36.222 ± 0.027 16.675 ± 0.042 14.068 ±0.031 33.350 ± 0.085 50.290 ± 0.025 -0.035 ± 0.018 0.148 ±0.016 33.268 ± 0.020 34.712 ±0.008 33.204 ± 0.007 34.936 ± 0.018 49.889 ± 0.029 0.04 ±0.11 -0.18 ±0.11 0.13 ±0.03 -0.16 ±0.01 0.23 ± 0.01 -0.53 ± 0.02 0.40 ± 0.03
eigenfrequencies and eigenfunctions. This expansion in spherical harmonics had to be truncated in order to obtain the solutions, and generally no convergence was found for the frequencies at which the perturbation is most significant.
According to the suggestion of Cunha (2001), v6 lies precisely in
the frequency region where the perturbation is greatest. Thus, just as in the case of Cunha & Gough (2000), caution should be applied when using Saio & Gautschy’s frequency perturbations at the fre- quencies around v6. Despite the existence of quantitative differences
in the absolute frequency perturbations found, the ratio between the ‘frequency jumps’ suffered by modes of different degrees is very similar in the two works. Thus, the above discussion regarding the interpretation of v6, v7 and v8 is maintained if the results of Saio
& Gautschy (2004) are used, rather than those of Cunha & Gough (2000).
4.1 Amplitude variations between the 2000 and 1986 data sets A question that arose in our preliminary study of the 2000 WET data (Kurtz et al. 2002), where the ‘missing’ frequency was discov- ered, was ‘why was this frequency not seen in the 1986 data?’ The amplitude found by Kurtz et al. was high enough that it should have been detected in the 1986 data, if it were there at the same ampli- tude. It is clear from the comparison of the amplitudes in the 2000 and 1986 data sets shown in Table 4 and in Fig. 5 that significant amplitude variability does occur for HR 1217. In particular, look at the amplitudes of the highest peak, v4, the mode next to it at v3
and their rotational sidelobes. Their amplitudes have changed by several tenths of an mma - much more than the amplitude of the newly discovered frequencies now called and v7. We conclude
that these newly discovered frequencies had amplitudes below the detection limit in the 1986 data; for the 2000 data the noise level was reduced and the amplitudes grew.
Interestingly, there is little difference in the sum of the power be- tween the two data sets (given at the bottom of Table 4), indicating that the total pulsational energy has possibly been conserved, but that there has been transfer of some energy from one mode to another - particularly, from v3 to v4. It is not possible to be certain about
this until we can characterize the modes completely, as distorted modes of differing l have different projection factors, precluding relating pulsation power (amplitude squared) directly to pulsation energy. Some singly periodic roAp stars are known to have very
Table 4. Amplitude variation between the 2000 and 1986 data. Only fre- quencies detected in both data sets are listed; i.e. only the frequencies found in the 1986 data, all of which are also found in the 2000 data, are listed. The values of the frequencies from the 2000 data set are given, and the identification labels are the same as those in Table 2.
ID (pHz) A 2000 (mma) ±0.014 A 1986 (mma) ±0.018 AA (mma) ±0.023 vi V2 - VYOt V2 V2 ± r’rot V3 - Vrot V3 ^3 + r’rot V4 — V rot V4 v4 ± yrot V5 - Vrot ±5 V5 ± Vrot V8 - nrot V8 ^8 + ^rot Power = A2 2619.546 2652.014 2652.943 2653.872 2686.566 2687.495 2688.424 2719.998 2720.927 2721.856 2754.402 2755.331 2756.260 2804.692 2805.621 2806.550 2 0.235 0.246 0.767 0.209 0.238 0.573 0.241 0.374 1.176 0.416 0.196 0.273 0.123 0.051 0.180 0.129 3.1 ±0.5 0.193 0.343 0.770 0.183 0.442 1.046 0.418 0.156 0.818 0.266 0.170 0.288 0.176 0.048 0.166 0.157 3.2 ± 0.7 0.042 -0.097 -0.003 0.026 -0.204 -0.473 -0.177 0.218 0.358 0.150 0.026 -0.015 -0.053 0.003 0.014 -0.028 0.1 ±0.7
stable amplitudes, such as HR 3831 (Kurtz et al. 1997) where there has been minimal amplitude change over 18 yr of observations. Other roAp stars, such as HD 60435 (Matthews, Wehlau & Kurtz 1987) have many more pulsation modes than HR 1217 and show sig- nificant amplitude modulation on a time-scale of only a few days. We conjecture that the multimode roAp stars transfer energy be- tween modes, whereas the singly periodic stars cannot do that and have stable amplitudes. The results in Table 4 are the first data that can test whether total pulsation power is conserved in multimode stars where energy exchange occurs. Great caution is called for here, however, as so little is known concerning pulsation power stability. A counter-example to the above suggestion is the star HD 217522 (Kreidl et al. 1991) where an entirely new frequency appeared
2
0
0
5MNRAS.358.
.651K HR 1217 - WET asteroseismic data 661
between data sets in 1982 and 1989 and power does not seem to have been conserved in a star with only two modes.
4.2 The rotational sidelobes
The oblique pulsator model (OPM) for the roAp stars (Kurtz 1982) has been the standard interpretation for the rotational amplitude and phase modulation for these stars since it was introduced. In this picture the pulsation modes are axisymmetric modes aligned with the magnetic axis which is itself inclined to the rotational axis by an angle ß. The rotational axis is inclined to the line of sight by an angle i. The most developed theory of the standard OPM can be found in Takata & Shibahashi (1995) and Shibahashi & Takata (1993).
Recently, Bigot & Dziembowski (2002) have introduced the ‘im- proved oblique pulsator model’ (IOPM) which presents a very dif- ferent picture. They find that the centrifugal distortion of the star has a greater effect on the pulsations than the Coriolis force, and that the combination of rotational and magnetic effects on the pulsation modes couples the 2f + 1 magnetic levels for each given Í. In par- ticular, for f = 1 they find three eigenmodes for which the axis of symmetry precesses in a plane that does not generally contain the magnetic axis.
Bigot & Kurtz (2005) find a geometry for the roAp star HR 3831 of (/, ß) = (84, 7)° from the IOPM. This is in good agreement with / = 90° ± Io and /3 = 8° ± 1 found by Bagnulo et al. (1999)
from magnetic measurements. The old oblique pulsator model with a dipole-like pulsation aligned with the magnetic axis is not plausi- ble with this geometry. The observed semi-amplitude for HR 3831 is approximately 5 mmag in B\ with this geometry, if the mode could be seen from pole-on, then it would have a semi-amplitude of 36 mmag. This is vastly larger than the highest amplitude seen for any of the 34 known roAp stars of 8 mmag, in the case of HD 60435, and that is for multiple modes beating with each other. The highest- amplitude individual modes are for HD 101065 and HR 3831 and are approximately 5 mmag. However, Kochukhov (2004) finds a different magnetic and pulsation geometry for HR 3831 that is in good agreement with the old oblique pulsator model and is incon- sistent with the Bagnulo et al. (1999) geometry. Further magnetic studies should differentiate between these two models.
Most recently, Saio & Gautschy (2004) have looked at the interac- tion of pulsation and the magnetic field in roAp stars and confirmed, as first found by Dziembowski & Goode (1996), that the pulsation modes cannot be characterized by a single spherical harmonic. They are distorted dipole and quadrupole modes that are aligned with the magnetic axis.
In all of these models the pulsation modes are inclined to the rotation axis so that they are viewed at varying aspect with the
rotation of the star. This is a unique aspect of the roAp stars that allows their mode geometries to be studied in more detail than for any other kind of pulsating star. The information concerning the rotational modulation of the modes is contained in the amplitudes and phases of the rotational sidelobes to the mode frequencies. Those amplitudes and phases are listed in Table 2 and shown schematically in Fig. 5. Given that there is residual amplitude in the amplitude spectrum of the residuals to our frequency solution with highest peaks around 80 jama (see Fig. 4), we advise caution in interpreting the rotational sidelobes with amplitudes less than that, even though they are formally significant.
First, we will examine the phases of the rotational sidelobes in Table 2. We do not consider the rotational sidelobes for v6 and v7
to be significant enough to discuss further, and, as was found in the 1986 data by Kurtz et al. (1989), v8 seems to be a rotational doublet,
rather than a triplet - or at least it has very different amplitudes for the rotational sidelobes. This has been found in two independent multisite data sets (1986 and 2000), so is significant, but we do not know the cause of it. So we will look at the rotational sidelobes for the first five modes, Vi to V5.
The zero point of the time-scale for the frequency solution in Table 2 is í0 = BJED2451876.93 and it was selected to set the phases of
the rotational sidelobes of Vi to v5 equal to each other. It can be
seen that the phases of the modes and their rotational sidelobes for each of the five modes under consideration here are nearly equal, in most cases they are not statistically significantly different within the formal errors, and those errors neglect the cross-talk problems that we know are still present in this 36 per cent duty cycle data set. This near equality of the phases of the frequency triplets means that the pulsation modes are being amplitude modulated with rotation, but not phase modulated. This significantly simplifies the interpretation of the rotational triplets; pure amplitude modulation is what we expect for axisymmetric normal modes seen from varying aspect.
All of the oblique pulsator models characterize the rotational triplets for dipole modes using two parameters. We will use the notation of Bigot & Dziembowski in the IOPM and call these two parameters y+ and y~. They are:
y+ =
A+i + A_i
^0 and y
A+i — A_i
A+i + A_i
where A+i and A_i refer to the amplitudes of the higher- and lower-
frequency rotational sidelobes, respectively, and A0 refers to the
amplitude of the central frequency of the triplet. In Table 5 we list these parameters for the all eight modes in the 2000 data and compare them to the values found by Kurtz et al. (1989) for five of those modes in the 1986 data. The frequencies and frequency labels are those from the 2000 WET data set - this work. There is no difference in the values of and y~ greater than 3or between the Table 5. The values of y+ and y that characterize the rotational amplitude modulation of the
pulsation modes. ID Frequency 2000 1986 vi V2 V3 V4 ^6 U7 ^8 2619.546 2652.943 2687.495 2720.927 2755.331 2788.946 2791.553 2805.621 0.74 ±0.10 0.59 ± 0.03 0.84 ± 0.04 0.67 ± 0.02 1.17 ±0.09 1.49 ±0.27 0.90 ±0.12 1.00 ±0.13 0.21 ±0.12 -0.08 ± 0.04 0.01 ± 0.04 0.05 ± 0.03 -0.23 ± 0.06 0.28 ±0.13 -0.51 ±0.13 0.43 ±0.12 0.68 ± 0.04 0.82 ± 0.03 0.52 ± 0.03 1.20 ±0.12 1.23 ±0.20 -0.30 ± 0.05 -0.03 ± 0.03 0.26 ± 0.06 0.02 ± 0.07 0.53 ±0.14 © 2005 RAS, MNRAS 358, 651-664
2
0
0
5MNRAS.358.
.651K 662 D. W. Kurtz et al. (the WET collaboration) 2000 and 1986 data sets, except for y+ for v4 which is technically
at the 4cr level, but with some cross-talk between the frequencies in both data sets, we do not interpret that to be significant.
Kurtz et al. (1989) concluded that v2 and v4 are very nearly dipole
modes within the standard OPM, but found that the other modes could not be purely spherical harmonic modes. Their argument came from the fact that within the OPM
+ ^+1 + A_!
y = = tañí tanß. Aq
In that model i and ß are the same for a dipole pulsation mode and a dipole magnetic field. The most recent and best values for those parameters come from a broad-band linear polarization study by Bagnulo et al. (1995) who find i = 137° and ß = 150°. Those give y+ = tan i tan ß = 0.54, close to the values of 0.59 and 0.67 found
in Table 6 for v2 and v4, hence the suggestion that those modes
are dipole pulsation modes, or at least something close to normal dipole modes. Matthews et al. (1999) showed from paral- laxes and standard A-star models that the large spacing, Av0 equals
68 pHz for HR 1217, hence the modes are alternating even and odd £-modes, or distorted alternating even and odd £-modes. Shibahashi & Saio (1985) long ago argued from standard A-star models that the alternating spacing seen in HR 1217 (see Fig. 5) suggests that the even-£ modes should be radial modes, rather than quadrupole modes. Of course, those even-£ modes are amplitude modulated, so cannot be simple radial modes which would not vary with aspect, but neither can they be quadrupole modes - they do not modulate as expected for quadrupole modes, given the known i and ß from mag- netic measurements (see Kurtz et al. 1989). Hence the conclusion within the standard OPM is that the even-£ modes must be distorted by the magnetic field. The values of for Vi, v3 and V5 are close
to each other in Table 5, so whatever the interpretation of them, they can be considered to have the same mode identification - i.e. they modulate in the same way with rotation.
The new theoretical work of Bigot & Dziembowski (2002) ad- dresses the rotational and magnetic distortions directly; that of Saio & Gautschy (2004) addresses only the magnetic distortion. In the latter study the modes are truly distorted from simple spherical har- monic modes; in the former (IOMP) the modes are still described by spherical harmonics, but are combinations of azimuthal m-modes for a given £. In the IOPM y+ depends on the rotational inclination,
/, the inclination of the normal of the pulsation plane to the rotation axis, <5, and the ellipticity of the pulsation mode motion in the pulsa- tion plane, 1^, all of which depend ultimately on the rotational and magnetic distortions and have to be modelled.
The values of y~ are all less than unity. Within the standard OPM (Takata & Shibahashi 1995) this suggests that the rotational perturbation is small compared with the magnetic perturbations, as
_ _ A+i — A_i _ Cni£L
^ A , 4 , (1)inag (l)mag’ W- /i-1 C01 — COq
where the numerator is a measure of the rotational perturbation and the denominator of the magnetic perturbation.
Within the IOPM of Bigot & Dziembowski (2002) the relative importance of the rotational and magnetic effects is described by the parameter
^mag-^mag u- D
where co™dg and (o™§ are the magnetic eigenfrequencies for modes
with m = 0 and 1, respectively, and D is a measure of the centrifugal distortion. For HR 1217, with its relatively long 12.4572-d rotation period (see Section 4.3) and strong polar magnetic field strength of
3.9 kG (Bagnulo et al. 1995), we would expect a large value of /x. In that case, the IOPM predicts that one of modes should be nearly aligned with the magnetic field, independently of the magnetic obliq- uity, implying that for that mode \¡/ ^ 0 and \8\ ^ |tt/2 — ß\. Having fixed the inclination of the observer, / = 137° (from Bag- nulo et al. 1995), the observed values of from Table 5 lead to the common value of á ^ 56° for both eigenmodes, v2 and v4. This
value of 8 is relatively well determined with an error of approxi- mately 2°-30. The ellipticities of the modes v2 and v4 are small,
\// ~ l°-30. These two modes are then almost standing modes pul-
sating in the direction n/2 + 8 ^ 146°, which is the same as that found by Bagnulo for the inclination of the magnetic axis, within the observational error bars. We can conclude that, from the IOPM, the modes v2 and v4 are essentially m — 0 modes in the magnetic refer-
ence system. That these two frequencies are well represented by a single spherical harmonic could be in contrast with the expectations that the modes should be distorted (as found by Dziembowski & Goode 1996; Cunha & Gough 2000; Bigot & Dziembowski 2002; and Saio & Gautschy 2004). However, the degree of distortion de- pends on the entire geometry, on the strength of the coupling and on the averaging effect. For dipole modes, in particular, it is likely that the distortion seen is very small, as the averaging by cancellation of the higher £ components over the stellar disc would be greater than that of the £ = 1 components. At present we can only say for Vi, y 3 and y 5 that if they are radial modes, then they are distorted, as they are modulated with rotation; if they are quadrupole modes, then further study is needed to understand them within the OPM, the IOPM and the theory of Saio & Gautschy.
4.3 The rotation period
There is a controversy over the rotation period of HR 1217. Kurtz & Marang (1987) used a combination of measurements of magnetic field variability, mean light variability (i.e. rotational light variabil- ity) in Johnson and Strömgren colours and Full line strength vari- ability - all from different authors and different studies - to derive a rotational ephemeris of
HJD (extremum) = 2440578.23 zb 0.09 + 12.4572 zb 0.0003 E. This derivation was made under the assumption that all of those parameters vary with exactly the same period, and that period is the rotation period. This is consistent with what is known of oblique rotation in many magnetic Ap stars.
Kurtz et al. ( 1989) found in their multisite study of the pulsation of HR 1217 that the times of magnetic and pulsation maximum are the same within 0.05 zb 0.03 rotation periods, but that the time of mean light extremum is slightly different by —0.031 zb 0.010 rotation periods to the pulsation maximum. These small differences over the many rotation periods studied in this star are not the source of the controversy over the rotation period. They are simply too small to matter at the precision that the rotation period is known. Kurtz et al. (1989) used the rotation period of Kurtz & Marang and gave an ephemeris for pulsation amplitude maximum of
HJD (amplitude maximum) = 2446743.54 zb 0.38 + 12.4572 E. Mathys (1991) found this period to be incompatible with his and Preston’s (1972) combined magnetic measurements. He derived a rotation period of 12.4610 zb 0.0025 d; although that value is for- mally compatible with the period of 12.4572 zb 0.0003 d found by Kurtz & Marang, Mathys found that the latter did not phase his and Preston’s combined magnetic observations satisfactorily. He suggested that the assumed phase equality of the photometry in