HAL Id: hal-01164730
https://hal.archives-ouvertes.fr/hal-01164730
Submitted on 17 Jun 2015
HAL is a multi-disciplinary open access
archive for the deposit and dissemination of
sci-entific research documents, whether they are
pub-lished or not. The documents may come from
teaching and research institutions in France or
abroad, or from public or private research centers.
L’archive ouverte pluridisciplinaire HAL, est
destinée au dépôt et à la diffusion de documents
scientifiques de niveau recherche, publiés ou non,
émanant des établissements d’enseignement et de
recherche français ou étrangers, des laboratoires
publics ou privés.
Distributed under a Creative Commons Attribution - NonCommercial| 4.0 International
License
Plasma long-chain omega-3 fatty acids and atrophy of
the medial temporal lobe.
Cécilia Samieri, Pauline Maillard, Fabrice Crivello, Cécile Proust-Lima,
Evelyne Peuchant, Catherine Helmer, Helene Amieva, Michele Allard,
Jean-Francois Dartigues, Stephen C Cunnane, et al.
To cite this version:
Cécilia Samieri, Pauline Maillard, Fabrice Crivello, Cécile Proust-Lima, Evelyne Peuchant, et al..
Plasma long-chain omega-3 fatty acids and atrophy of the medial temporal lobe.. Neurology, American
Academy of Neurology, 2012, 79, pp.642-50. �hal-01164730�
Plasma long-chain omega-3 fatty acids and
atrophy of the medial temporal lobe
Ce´cilia Samieri, PhD
Pauline Maillard, PhD
Fabrice Crivello, PhD
Ce´cile Proust-Lima, PhD
Evelyne Peuchant, MD,
PhD
Catherine Helmer, MD,
PhD
Helene Amieva, PhD
Michele Allard, MD, PhD
Jean-Francois Dartigues,
MD, PhD
Stephen C. Cunnane,
PhD
Bernard M. Mazoyer,
MD, PhD
Pascale Barberger-Gateau,
MD, PhD
ABSTRACTObjective:
The long-chain-3 fatty acids eicosapentaenoic acid (EPA) and docosahexaenoic acid (DHA) are potential candidates for interventions to delay Alzheimer disease (AD), but evidence from clinical studies is mixed. We aimed at determining whether plasma levels of EPA or DHA predict atrophy of medial temporal lobe (MTL) gray matter regions in older subjects.Methods:
A total of 281 community dwellers from the Three-City Study, aged 65 years or older, had plasma fatty acid measurements at baseline and underwent MRI examinations at baseline and at 4 years. We studied the association between plasma EPA and DHA and MTL gray matter volume change at 4 years.Results:
Higher plasma EPA, but not DHA, was associated with lower gray matter atrophy of the right hippocampal/parahippocampal area and of the right amygdala (p⬍ 0.05, familywise error cor-rected). Based on a mean right amygdala volume loss of 6.0 mm3/y (0.6%), a 1 SD higher plasma EPA (⫹0.64% of total plasma fatty acids) at baseline was related to a 1.3 mm3smaller gray matter loss per year in the right amygdala. Higher atrophy of the right amygdala was associated with greater 4-year decline in semantic memory performances and more depressive symptoms.
Conclusion:
The amygdala, which develops neuropathology in the early stage of AD and is involved in the pathogenesis of depression, may be an important brain structure involved in the association be-tween EPA and cognitive decline and depressive symptoms.Neurology®2012;79:642–650GLOSSARY
3C⫽ Three-City; AD ⫽ Alzheimer disease; CES-D ⫽ Center for Epidemiologic Studies–Depression; DHA ⫽ docosahexaenoic acid; DSM-IV⫽ Diagnostic and Statistical Manual of Mental Disorders, 4th edition; EPA ⫽ eicosapentaenoic acid; GM ⫽ gray matter; IST⫽ Isaacs Set Test; MMSE ⫽ Mini-Mental State Examination; MTL ⫽ medial temporal lobe; n-3 PUFA ⫽-3 polyunsaturated fatty acids; n-6 PUFA⫽-6 polyunsaturated fatty acids; TIV ⫽ total intracranial volume; WM ⫽ white matter.
The long-chain
-3 polyunsaturated fatty acids (n-3 PUFA) eicosapentaenoic acid (EPA) and
docosahexaenoic acid (DHA) in fish are promising candidates for prevention of sporadic
Alz-heimer disease (AD).
1,2DHA is a major component of neuron membranes where it exerts a
structural and functional role. EPA is present in the brain in much lower amounts than DHA
but, like DHA, may also have neuroprotective properties through anti-inflammatory,
antioxi-dant, and energy metabolism pathways.
2Several prospective epidemiologic studies directly link higher fish consumption, or higher
blood status of EPA or DHA, to lower risk of dementia, AD, or cognitive decline.
1,2However,
to date, most clinical trials using fish oil or DHA supplements have been inconclusive.
2–5More
evidence for a specific neurotherapeutic target of EPA and DHA is therefore needed, based
From the Equipe “Epidemiologie de la nutrition et des comportements alimentaires” (C.S., P.B.-G.), Equipe “Biostatistiques” (C.P.-L.), and Equipe “Epide´miologie et neuropsychologie du vieillissement cerebral” (C.H., H.A., J.-F.D.), Centre INSERM U897-Epidemiologie-Biostatistique, Bordeaux, France; INSERM (C.S., C.P.-L., C.H., H.A., J.-F.D., P.B.-G.), ISPED, Centre INSERM U897-Epidemiologie-Biostatistique, Bordeaux; University of Bordeaux (C.S., C.P.-L., C.H., H.A., J.-F.D., P.B.-G.), ISPED, Centre INSERM U897-Epidemiologie-Biostatistique, Bordeaux; CNRS (P.M.), CI-NAPS, UMR6232, Caen, France; CEA (P.M.), DSV/I2BM/CI-NAPS, Caen; University of Caen Basse-Normandie (P.M.), Caen; CNRS (F.C., B.M.M.), GIN, UMR 5296, Bordeaux; CEA (F.C., B.M.M.), GIN, UMR 5296, Bordeaux; University of Bordeaux (F.C., B.M.M.), GIN, UMR 5296, Bordeaux; INSERM (E.P.), INSERM U876, Bordeaux; CHU de Bordeaux (E.P.), Hoˆpital Saint-Andre´, De´partement de Biochimie, INSERM U876, Bordeaux; Neurofunctional and Cognitive Imaging Team (M.A.), CNRS/UB1/UB2 Unit, Bordeaux; CNRS (M.A.), CNRS/UB1/ UB2 Unit, Bordeaux; University of Bordeaux (M.A.), CNRS/UB1/UB2 Unit, Bordeaux; CHU de Bordeaux (M.A.), Service de Me´decine Nucle´aire, CNRS/UB1/UB2 Unit, Bordeaux; and Research Center on Aging (S.C.C.), Universite´ de Sherbrooke, Sherbrooke, Canada.
Study funding: Funding information is provided at the end of the article.
Go to Neurology.org for full disclosures. Disclosures deemed relevant by the authors, if any, are provided at the end of this article.
Supplemental data at www.neurology.org
Supplemental Data
Correspondence & reprint requests to Dr. Samieri: Cecilia.Samieri@isped.u-bordeaux2.fr
on validated biomarkers of AD, such as
at-rophy of medial temporal lobe (MTL)
structures. In older subjects, lower red
blood cell EPA
⫹DHA levels were recently
shown to correlate with smaller brain
vol-umes.
6However, to our knowledge, the
as-sociation between plasma EPA and DHA
and brain atrophy has not been explored
us-ing a longitudinal design.
The primary objective of this
population-based MRI study was to examine whether
plasma EPA or DHA were associated with
whole brain and MTL-specific gray matter
(GM) volume change over 4 years. Secondly,
we sought to determine whether GM volume
change in the MTL regions involved in such
relationship was associated with a decline of
cognitive performance or an increase of
de-pressive symptoms during follow-up.
METHODSStudy population. The present study is based on the Bordeaux sample of the Three-City (3C) Study, a pro-spective cohort study of vascular risk factors for dementia which started in 1999 –2000 and included 9,294 noninstitutionalized community dwellers agedⱖ65 years in Bordeaux (n ⫽ 2,104), Dijon (n⫽ 4,931), and Montpellier (n ⫽ 2,259), France. De-tails of the study were described previously.7Baseline data
collec-tion included sociodemographic and lifestyle characteristics, symptoms and complaints, main chronic conditions, neuropsy-chological testing, physical examination, and blood sampling. Four follow-up examinations were performed 2, 4, 7, and 10 years after baseline. The present study is based on the first 4 years of follow-up.
In Bordeaux, plasma fatty acids were measured at baseline in 1,419 participants (figure e-1 on the Neurology®
Web site at www.neurology.org). Among them, 504 individuals also underwent a brain MRI examination. At 4 years, 315 participants underwent a second MRI examination. We excluded 30 participants with unus-able scans and 4 with missing data for main covariates, leaving 281 participants available for the present study.
Standard protocol approvals, registrations, and patient consents. The protocol of the 3C study has been approved by the Consultative Committee for the Protection of Persons par-ticipating in Biomedical Research of the Kremlin-Biceˆtre Uni-versity Hospital (Paris). All participants gave their written informed consent.
MRI data. MRI acquisition. The MRI acquisition was per-formed on a 1.5-T Magnetom (Siemens, Erlangen, Germany). A 3D, high-resolution T1-weighted brain image was acquired us-ing a 3D inversion recovery fast spoiled-gradient echo sequence. T2- and proton density–weighted brain volumes were acquired during the same sequence using a 2D dual spin echo sequence with 2 echo times (e-Methods).
MRI processing. Using the multi-spectral segmentation
scheme implemented in SPM8 (Statistical Parametric Mapping, release 8),8baseline T1 and T2 images were first segmented into
GM, white matter (WM), and CSF images and then spatially
normalized using a 3C template (e-Methods). Probability maps were smoothed using a 12-mm full width at half-maximum iso-tropic Gaussian kernel.
Whole brain and MTL volumes estimation. A so-called modulation8was applied to the resulting individual GM, WM,
and CSF probability maps to preserve the subject’s original tissue quantity after its transfer to the reference space. Baseline and 4-year GM, WM, and CSF volumes were computed as the inte-gral of the voxel intensities in the corresponding modulated tis-sue image, and total intracranial volume (TIV) was defined as their sum. Baseline and 4-year MTL volumes were automatically computed within the MTL limits derived from a model of mac-roscopic neuroanatomic parcellation.9,10Three MTL structures
were selected: 1) the hippocampal region consisting of the den-tate gyrus, the uncus, and the hippocampus; 2) the parahip-pocampal region consisting of the parahipparahip-pocampal gyrus; and 3) the parahippocampal uncus, both including entorhinal and perirhinal cortices, and the amygdala.
The individual annual rates of GM volume change were defined as the difference between the 4-year and baseline GM volumes di-vided by the time between the 2 MRI examinations. Probability maps of annual GM change (⌬/y GM map) were calculated as the difference between 4-year and baseline GM probability maps di-vided by the time between the 2 MRI examinations.
Clinical data. Cognitive assessment. The psychologists ad-ministered a battery of neuropsychological tests at baseline and at each follow-up examination. In the present study, we were interested in the Mini-Mental State Examination (MMSE),11an
index of global cognitive performance (range 0 –30), and the Isaacs Set Test (IST),12which assesses semantic verbal fluency
and begins to decline very early in the prodromal phase of AD.13
For the IST, participants have to generate a list of words belong-ing to a specific semantic category in 15 seconds. Four semantic categories are successively used (cities, fruits, animals, and colors) (range 0 –53).
Diagnosis of dementia was based on a 3-step procedure.7All
potential incident cases of dementia were reviewed by an inde-pendent committee of neurologists to obtain a consensus on the diagnosis and etiology according to the criteria of the DSM-IV.14
Assessment of depressive symptoms. Depressive symptoms
were recorded by trained psychologists at baseline and at the 2-year and 4-year visits with the validated Center for Epidemio-logic Studies–Depression (CES-D) scale.15,16Scores range from 0
to 60 according to the frequency of the depressive symptoms during the previous week. High depressive symptoms were de-fined as a CES-D score ofⱖ17 in men and ⱖ23 in women, as validated in a French population.17
Plasma fatty acids. Plasma fatty acid composition was
de-termined from fasting blood samples collected at baseline, as previously detailed18(e-Methods). For this study, the focus was
on plasma EPA and DHA proportions (in percentage of total fatty acids), transformed into Z scores. In supplementary analy-ses, we also considered total n-3 PUFA (as the sum of␣-linolenic acid⫹ docosapentaenoic acid ⫹ EPA ⫹ DHA), total-6 poly-unsaturated fatty acids (n-6 PUFA) (as the sum of linoleic acid⫹ ␥-linolenic acid ⫹ arachidonic acid), as well as total PUFA (as the sum of n-3 and n-6 PUFA).
Other variables. Sociodemographic variables included age,
sex, and education. APOE4 allele carrier status was considered dichotomously (at least 1⑀4 allele vs no ⑀4 allele). Vascular risk factors at baseline included smoking, history of cardiovascular or cerebrovascular disease, hypertension (if systolic blood pressure ⱖ140 mmHg or diastolic blood pressure ⱖ90 mm Hg, or
hypertensive medication), hypercholesterolemia (if plasma total cholesterolⱖ6.20 mmol/L, or cholesterol-lowering medication), diabetes (if fasting glycemiaⱖ7.0 mmol/L, or antidiabetic med-ication), body mass index (body weight/height2[kg/m2]),
tri-glyceridemia, and usual alcohol consumption.
In Bordeaux, a detailed food frequency questionnaire was administered at the 2-year and 4-year visits; the stability of fish consumption between these 2 periods was assessed within each quartile of baseline plasma EPA and DHA (e-Methods). Statistical analyses. Statistical analyses at the voxel level:
VBM. Whether plasma long-chain n-3 PUFA was associated
with the probability of GM was tested in each voxel. Using the smoothed normalized GM maps, multiple linear regressions were performed in the MTL to assess associations between base-line EPA or DHA plasma proportion and annual GM change, adjusting for baseline age, gender, education, and APOE4 status. The threshold was set at p⬍ 0.05 (familywise error–corrected for multiple comparisons). In additional models, we secondarily considered total n-3, total n-6 PUFA, as well as total PUFA.
Statistical analyses at the global level. Individual
estima-tions of GM volumes in each MTL structure of interest were used to investigate, when significant in VBM, 1) associations between EPA or DHA or total PUFA and annual change in GM, taking into account a broader set of adjusting variables, and 2) whether GM volume change in the regions involved was associated with a decline of cognitive performance or an increase in depressive symptoms. SAS statistical software (release 9.1, SAS institute Inc, Cary, NC) and lcmm R package19were used, and statistical tests
were computed at the␣ ⫽ 0.05 level of significance.
Association between plasma n-3 PUFA and MRI data.
For each MTL structure, GM volume change was described us-ing linear mixed models.20The mean trajectory of GM change
was modeled as a linear trend with the baseline mean GM vol-ume (intercept) and the annual change in GM volvol-ume (slope) allowed varying with the PUFA of interest. Interindividual vari-ability was accounted for through correlated subject-specific ran-dom intercept and slope. Three different adjusted models were constructed which respectively included as covariates: 1) TIV, age, gender, education, and APOE4 status (model 1), 2) and depressive symptoms and vascular risk factors (model 2), 3) and whole brain GM volume change (model 3).
Association between MRI data and clinical data. For
each MTL structure significantly associated with n-3 PUFA, we further examined whether annual GM volume change (⌬/y GM volume) was associated with the evolution of cognitive perfor-mances and depressive symptoms during the same period, using latent process mixed models that, compared to standard linear mixed models, correct for the curvilinearity of the tests/scales.19,21
Change of the latent process underlying MMSE, IST, and CES-D scores was modeled as an individual-specific linear trend (with random intercept and slope). Association with⌬/y GM volume was assessed on the slope only, while associations with other covariates (baseline GM volume of the MTL structure, age, gender, education, and TIV) were evaluated both on the intercept and the slope of the underlying latent process.
RESULTS
Participants were 72.3 years old, 42.2%
were male, and mean MMSE score was 27.9 (table
1). Baseline plasma EPA and DHA were associated
with frequency of fish consumption at 2 and 4 years,
and within each quartile of plasma EPA, mean
fre-quency of fish consumption remained stable during
follow-up (e-Results and table e-1). Fish
consump-tion remained stable over the 4 years in the extreme
quartiles of plasma DHA, and slightly increased in
the intermediate quartiles. The subjects who agreed
to have MRI were healthier than those who did not,
including having better nutritional status (e-Results).
Association between plasma long-chain n-3 PUFA and MRI data.The mean rate of GM atrophy from
base-line was
⫺0.2%/y in the whole brain. In the MTL, it
ranged from
⫺0.5%/y for the left amygdala to
⫺1.0%/y for the left hippocampus (table 2).
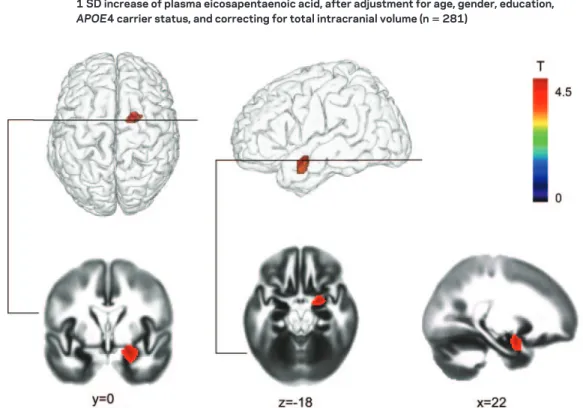
On a voxel-by-voxel basis, higher baseline plasma
EPA was significantly associated with less GM
atro-phy in a region of which 53% was the right
amygdala, 41% was the right parahippocampus, and
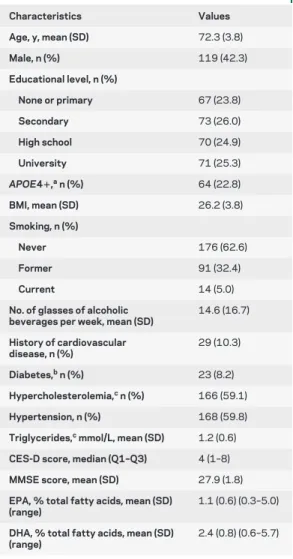
Table 1 Baseline characteristics of the participants: The Bordeaux sample of the Three-City Study (nⴝ 281)
Characteristics Values Age, y, mean (SD) 72.3 (3.8) Male, n (%) 119 (42.3) Educational level, n (%) None or primary 67 (23.8) Secondary 73 (26.0) High school 70 (24.9) University 71 (25.3) APOE4ⴙ,an (%) 64 (22.8) BMI, mean (SD) 26.2 (3.8) Smoking, n (%) Never 176 (62.6) Former 91 (32.4) Current 14 (5.0)
No. of glasses of alcoholic beverages per week, mean (SD)
14.6 (16.7) History of cardiovascular disease, n (%) 29 (10.3) Diabetes,bn (%) 23 (8.2) Hypercholesterolemia,cn (%) 166 (59.1) Hypertension, n (%) 168 (59.8)
Triglycerides,cmmol/L, mean (SD) 1.2 (0.6)
CES-D score, median (Q1–Q3) 4 (1–8)
MMSE score, mean (SD) 27.9 (1.8)
EPA, % total fatty acids, mean (SD) (range)
1.1 (0.6) (0.3–5.0)
DHA, % total fatty acids, mean (SD) (range)
2.4 (0.8) (0.6–5.7)
Abbreviations: BMI⫽ body mass index; CES-D ⫽ Center for Epidemiologic Studies–Depression scale; DHA⫽ docosa-hexaenoic acid; EPA⫽ eicosapentaenoic acid; MMSE ⫽ Mini-Mental State Examination.
aAPOE4 carriers (at least one⑀4 allele) were noted as
APOE4⫹.
bData missing for 3 participants. cData missing for 1 participant.
6% was the right hippocampus (figure 1). More than
45% of the whole right amygdala, but
⬍10% of the
whole right hippocampal/parahippocampal area,
were included in this cluster. In contrast to plasma
EPA, plasma DHA, as well as plasma total PUFA,
total n-3, and total n-6 PUFA, were not significantly
associated with GM volume change (data not
shown). When plasma EPA and DHA were
intro-duced together in a same model, higher EPA but not
DHA was associated with less GM atrophy in the
aforementioned brain region (data not shown).
At the global level, higher plasma EPA was
signifi-cantly associated with less GM atrophy of the right
amygdala (whole structure) over 4 years, but not with
the 4-year change in the volume of the other MTL
re-gions (table 3) or of the whole brain (table e-2). This
association remained significant after adjustment for
vascular risk factors, depressive symptoms (model 2),
Table 2 Mean baseline GM volume and rate of change of GM in the whole brain and in MTL regionsof interest
Whole brain
Baseline GM volume (cm3),
mean (SD)
GM volume change (cm3/y),
mean (SD)
GM rate of change from baseline (%/y), mean (SD)
520.6 (50.6) ⫺0.8 (1.4) ⫺0.2 (0.3)
Regions of interest Baseline GM volume (mm3) GM volume change (mm3/y) GM rate of change from baseline (%/y)
Left hippocampus 3,979.0 (433.7) ⫺40.8 (31.0) ⫺1.0 (0.8) Right hippocampus 3,605.2 (414.3) ⫺32.4 (26.9) ⫺0.9 (0.8) Left parahippocampal regiona 3,578.6 (361.9) ⫺20.4 (26.6) ⫺0.6 (0.7) Right parahippocampal regiona 4,547.2 (483.5) ⫺26.0 (34.5) ⫺0.6 (0.8) Left amygdala 940.4 (92.0) ⫺4.2 (8.5) ⫺0.5 (0.9) Right amygdala 977.3 (102.1) ⫺6.0 (8.4) ⫺0.6 (0.9)
Abbreviations: GM⫽ gray matter; MTL ⫽ medial temporal lobe.
aConsisted of the parahippocampal gyrus and the parahippocampal uncus, both including entorhinal and perirhinal
cortices.
Figure 1 Specific area of lower gray matter atrophy over 4 years within the medial temporal lobe with each 1 SD increase of plasma eicosapentaenoic acid, after adjustment for age, gender, education,
APOE4 carrier status, and correcting for total intracranial volume (nⴝ 281)
Student t map is superimposed onto the gray matter probability map, displayed at p⬍ 0.05 familywise error corrected for multiple comparisons. The x, y, and z coordinates (mm) give the slice location in stereotactic space. The region of interest included the hippocampal region consisting of the dentate gyrus, the uncus, and the hippocampus, the parahippocampal region consisting of the parahippocampal gyrus and the parahippocampal uncus, both including entorhinal and perirhinal cortices, and the amygdala.
and whole brain GM volume change (model 3). The
results were virtually unchanged after excluding the 13
stroke cases (9 prevalent at baseline, 4 incident) or the 4
dementia cases (1 prevalent, 3 incident).
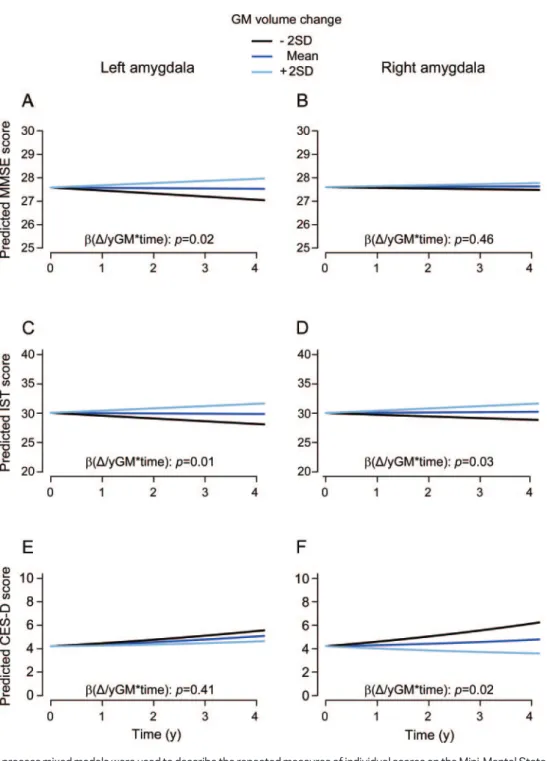
Association between annual GM change in the amygdala and clinical data.
Greater 4-year atrophy of
the left amygdala was significantly associated with
greater MMSE score decline (figure 2A). Greater left
and right amygdala atrophy was associated with
greater IST decline (figure 2, C and D). Finally,
greater atrophy of the right amygdala was associated
with increased CES-D scores over time (figure 2F).
In this sample, higher plasma EPA or DHA were not
significantly associated with change in MMSE, IST,
or CES-D scores.
DISCUSSION
In the present study, higher baseline
plasma EPA but not DHA was associated with less
GM atrophy over 4 years of both the right amygdala
and part of the right hippocampal/parahippocampal
area. At the global level, only the association between
plasma EPA and GM atrophy of the right amygdala
was statistically significant. After adjustment for
po-tential confounders, and based on a mean right
amygdala volume loss of
⫺6.0 mm
3/y (0.6%), a 1
SD higher plasma EPA (
⫹0.64% of total plasma
fatty acids) at baseline was related to a 1.3 mm
3smaller GM loss per year in the right amygdala,
inde-pendently of the degree of whole brain GM atrophy.
Furthermore, more atrophy of the right amygdala
was associated with higher decline in semantic
mem-ory performance, and, specifically, with increased
symptoms of depression during the 4-year follow-up.
In our study, neither plasma EPA nor DHA were
significantly associated with change in whole brain
GM volume. This result is consistent with the
Car-diovascular Health Study and the Oregon Brain
Ag-ing Study, both of which did not find any significant
relation of fish consumption or marine
-3 nutrient
biomarker pattern, respectively, to whole brain
vol-umes.
22,23Conversely, the Framingham Study
re-cently reported an association between lower red
blood cell DHA and smaller whole brain volume.
6Our results are, however, very similar to a previous
Table 3 Multivariate associationsabetween baseline plasma EPA and GM volume change (mm3/y) over 4years in MTL regions of interest
Model 1 (nⴝ 281) Model 2 (nⴝ 275) Model 3 (nⴝ 275)
 (SE) p  (SE) p  (SE) p
Left hippocampus EPA 12.0 (14.8) 0.42 9.7 (15.2) 0.52 9.8 (15.2) 0.52 EPAⴛtime ⫺0.1 (1.9) 0.96 0.4 (2.0) 0.82 0.1 (1.9) 0.95 Right hippocampus EPA 6.2 (15.7) 0.69 12.6 (15.8) 0.42 12.6 (15.8) 0.43 EPAⴛtime 1.7 (1.7) 0.31 1.9 (1.7) 0.26 1.7 (1.7) 0.31
Left parahippocampal regionb
EPA 7.8 (13.2) 0.55 8.4 (13.6) 0.53 8.5 (13.6) 0.53
EPAⴛtime 0.1 (1.6) 0.94 0.3 (1.7) 0.85 ⫺0.1 (1.6) 0.97
Right parahippocampal regionb
EPA 3.9 (18.1) 0.83 16.6 (18.4) 0.37 16.6 (18.4) 0.37 EPAⴛtime 0.9 (2.2) 0.66 1.0 (2.2) 0.65 0.6 (2.2) 0.78 Left amygdala EPA 4.3 (3.5) 0.21 4.8 (3.6) 0.18 4.8 (3.6) 0.18 EPAⴛtime 0.5 (0.5) 0.38 0.7 (0.5) 0.17 0.6 (0.5) 0.22 Right amygdala EPA 3.7 (3.9) 0.34 4.7 (4.0) 0.25 4.7 (4.0) 0.25 EPAⴛtime 1.2 (0.5) 0.02 1.4 (0.5) 0.01 1.3 (0.5) 0.01
Abbreviations: EPA⫽ eicosapentaenoic acid; GM ⫽ gray matter; MTL ⫽ medial temporal lobe.
aEstimated using separate linear mixed models. coefficients are expressed for 1 SD increase of plasma proportion of
total fatty acids. Model 1: adjusted for baseline total intracranial volume, age, education, gender, APOE4 carrier status, and their interactions with time. Model 2: Model 1⫹ depressive symptoms, body mass index, tobacco use, alcohol consumption, history of cardiovascular and cerebrovascular disease, hypertension, hypercholesterolemia, diabetes, triglyceridemia, and their interactions with time. Model 3: Model 2⫹ whole brain GM volume change⫻time.
bConsisted of the parahippocampal gyrus and the parahippocampal uncus, both including entorhinal and perirhinal
Figure 2 Evolution of predicted scores on the MMSE, the IST, and the CES-D scale over 4 years as a function of annual GM volume change of the left and right amygdala (nⴝ 281)
Latent process mixed models were used to describe the repeated measures of individual scores on the Mini-Mental State Exam-ination (MMSE), the Issacs Set Test (IST), and the Center for Epidemiologic Studies-Depression (CES-D) scale function of time, baseline amygdala gray matter (GM) volume, baseline amygdala GM volume⫻time,⌬/y amygdala GM volume⫻time, age, age⫻
time, gender, gender⫻time, education, education⫻time, APOE4, APOE4⫻time, total intracranial volume (TIV), TIV⫻time.⌬/y GM volume refers to annual GM change in the amygdala. The left and the right amygdala were included in separate models. The regressions were run in the scale of the latent process underlying the individual scores, and predicted scores were computed in the scale of each psychometric test. Predicted mean evolution of MMSE, IST, and CES-D scores were represented for a man, 65 years old, low level of education (no or primary), non-APOE4 carrier, mean total intracranial volume (1,205 mm3) and mean
baseline GM volume of the amygdala (respectively: left amygdala, 940.4 mm3and right amygdala: 977.3 mm3). Panels A and B
refer to the evolution of predicted MMSE score as a function of GM volume change of the left and right amygdala, respectively. Panels C and D refer to the evolution of predicted IST score as a function of GM volume change of the left and right amygdala, respectively. Panels E and F refer to the evolution of predicted CES-D score as a function of GM volume change of the left and right amygdala, respectively.
study in healthy adults, in which higher EPA and DHA
intake was associated with greater GM volume in the
subgenual anterior cingulate cortex, the right
hip-pocampus, and the right amygdala.
24Our longitudinal
study strengthens this cross-sectional result, suggesting
that in older subjects, higher EPA intake may be
associ-ated with lower GM loss in the right amygdala.
These results corroborate our previous findings
that EPA specifically (and not DHA, total n-3, or
total n-6 PUFA) is associated with slower cognitive
decline
25and dementia risk,
18and also with lower
depressive symptoms
26according to antidepressant
effects documented in randomized controlled
tri-als.
27,28Indeed, within the MTL, the rate of atrophy
not only of the hippocampus, but also of adjacent
structures such as the entorhinal cortex
29and the
amygdala,
30is predictive of progression to dementia
and AD, because these regions develop
neuropathol-ogy in the early stage of AD.
31Although left MTL
atrophy seems to be the most consistent brain
bio-marker predicting conversion from MCI to AD,
32atrophy of the right MTL, including the amygdala, is
also reported and may even be involved in earlier AD
stages, thus enabling differentiation of normal
sub-jects from subsub-jects with MCI.
33Hence, in the ADNI
cohort, atrophy of some right but not left MTL
structures predicted subsequent decline in memory
in cognitively unimpaired older subjects.
34Accordingly, we found that higher decline in
global cognition was related to atrophy of the
amygdala on the left side only, while atrophy of the
right amygdala was related to decline in IST, a test
exhibiting very early decline in prodromal AD.
13Therefore, the specific association found between
EPA and the right MTL, also reported in a previous
study in healthy adults,
24suggests that EPA may
ex-ert beneficial propex-erties in early stages of dementia,
which we were able to capture in our minimally
cog-nitively impaired sample.
In addition, MTL atrophy may occur as a
conse-quence of recurrent major depression. The amygdala,
which is the core structure of the limbic
emotion-processing circuit, plays a key role in the regulation
of mood and in the memory of emotional stimuli.
35Amygdala volume is significantly decreased in
un-medicated depressed patients but increases after
medication, supporting the neurotrophic hypothesis
of antidepressant action.
36The reactivity of the right
amygdala seems specifically altered in depression
37and may normalize with the use of selective serotonin
reuptake inhibitors.
38Accordingly, more symptoms
of depression were specifically related to atrophy of
the amygdala in the right hemisphere in our study.
In our study, higher plasma EPA levels had a
fa-vorable association with right medial temporal
struc-tures. EPA could exert neuroprotective effects
through anti-inflammatory, neuroendocrine, or
neurogenesis-related pathways (e-Discussion).
Nev-ertheless, interpreting our results requires caution: 1)
Probably because of limited power, we were not able
to repeat the association between plasma EPA and
clinical outcomes that we previously reported, and
we could thus not test the hypothesis of a possible
mediation by declining amygdala volume of such
as-sociation. 2) Reasons for the relative specificity of
relationship with EPA vs DHA remain speculative
(e-Discussion). The main strengths of the present
study include the 1) longitudinal MRI assessment of
brain volume, 2) large population-based sample, 3)
use of plasma fatty acid profiles to assess n-3 PUFA
status, and 4) adjustment for many potential
con-founding variables, including vascular risk factors.
Among potential limitations, plasma long-chain n-3
PUFA may reflect shorter-term dietary intake than
do n-3 PUFA measured in erythrocyte membranes.
However, stronger correlations have generally been
reported between dietary long-chain PUFA and the
proportion of long-chain PUFA in total plasma.
39Moreover, participants of this study who underwent
MRI were probably healthier than those who did
not, which may have biased cross-sectional
associa-tions, but this is less likely to have affected the
longi-tudinal assessments.
40We cannot dismiss the
possibility that drop-out between the 2 MRI
exami-nations may have generated bias in association
mea-sures; however, if present, it is more likely to have
occurred toward an underestimation of associations,
because we may have lost participants with worst
nu-tritional status (thus lower n-3 PUFA) and higher
brain atrophy. Finally, nonparticipation may hamper
the external validity of the study, whose findings
should not be generalized to the whole elderly
popu-lation but only to those similar to the sample
ana-lyzed here.
Our finding of a relationship between plasma
EPA and GM volume loss in the amygdala suggests
that future clinical trials with EPA supplements
could specifically target the volume of amygdala as an
outcome measure.
AUTHOR CONTRIBUTIONS
C. Samieri performed statistical analyses and wrote the manuscript. P. Maillard performed SPM analyses and helped to write the manuscript. F. Crivello contributed to data collection and provided significant advice. C. Proust-Lima contributed to statistical analyses and provided significant advice. E. Peuchant contributed to determining plasma fatty acid propor-tions. C. Helmer contributed to experiment design, data collection, and provided significant advice. H. Amieva contributed to data collection and provided significant advice. M. Allard contributed to experiment design, data collection, obtained funding, and provided significant advice. J.F. Dartigues contributed to experiment design, data collection, obtained funding, and provided significant advice. S.C. Cunnane helped to write and revise the manuscript and provided significant advice. B. Mazoyer
contributed to experiment design, data collection, obtained funding, and provided significant advice. P. Barberger-Gateau contributed to experi-ment design, data collection, obtained funding, helped to write the man-uscript, and provided significant advice. All the authors read the draft critically. C. Samieri had full access to all of the data in the study and takes responsibility for the integrity of the data and the accuracy of the data analysis.
STUDY FUNDING
The 3C study is conducted under a partnership agreement between Sanofi-Aventis and the Institut National de la Sante´ et de la Recherche Me´dicale (INSERM) and the Institut de Sante´ Publique et De´veloppement of the Vic-tor Segalen Bordeaux 2 University. The Fondation pour la Recherche Me´di-cale (FRM) funded the preparation and initiation of the study. The 3C study is also supported by the Caisse Nationale Maladie des Travailleurs Salarie´s (CNAMTS), Direction Ge´ne´rale de la Sante´ (DGS), Mutuelle Ge´ne´rale de l’Education Nationale (MGEN), Institut de la Longe´vite´, Regional Councils of Aquitaine and Bourgogne, Fondation de France, and Ministry of Re-search–INSERM Programme “Cohortes et collections de donne´es bi-ologiques.” Fatty acid analyses performed by E. Peuchant were sponsored by the Conseil Re´gional d’Aquitaine. Dr Samieri was on a grant from the Ligue Europe´enne contre la Maladie d’Alzheimer (LECMA). Dr Proust-Lima re-ceived research support from ANR grant PRSP00601. The Canada Research Chairs, CFI, FRSQ, and CIHR, financed S.C.C.’s contribution to this paper. The study sponsors funded the preparation and initiation of the 3C study, as well as the data collection. They did not interfere in analysis and interpreta-tion of the data, in writing the report, or in the decision to submit the paper for publication.
DISCLOSURE
C. Samieri, P. Maillard, F. Crivello, C. Proust-Lima, E. Peuchant, and C. Helmer report no disclosures. H. Amieva received speaker honoraria from GSK, UCB, and Novartis. M. Allard reports no disclosures. J.F. Dartigues reports research grants from Ipsen and Novartis, and speaker honoraria from Ipsen, Novartis, and Merck Serono. S.C. Cunnane and B. Mazoyer report no disclosures. P. Barberger-Gateau served on a scientific advisory board for Caisse Nationale pour la Solidarit e´ et l’Autonomie (CNSA); has received funding for travel and speaker honoraria from Lesieur, Bausch & Lomb, Aprifel, Danone Institute, Canadian Association of Gerontology, and the Jean Mayer Human Nutrition Research Center on Aging, Tufts University; has received consultancy fees from Vifor Pharma; and receives research support from Lesieur, Danone, Agence Nationale de la Recher-che, Conseil Re´gional d’Aquitaine, Institut Carnot LISA, and Groupe Lipides et Nutrition. Go to Neurology.org for full disclosures.
Received November 17, 2011. Accepted in final form March 21, 2012.
REFERENCES
1. Fotuhi M, Mohassel P, Yaffe K. Fish consumption, long-chain omega-3 fatty acids and risk of cognitive decline or Alzheimer disease: a complex association. Nat Clin Pract Neurol 2009;5:140 –152.
2. Cunnane SC, Plourde M, Pifferi F, Begin M, Feart C, Barberger-Gateau P. Fish, docosahexaenoic acid and Alz-heimer’s disease. Prog Lipid Res 2009;48:239 –256. 3. Yurko-Mauro K, McCarthy D, Rom D, et al. Beneficial
effects of docosahexaenoic acid on cognition in age-related cognitive decline. Alzheimers Dement 2010;6:456 – 464. 4. Dangour AD, Allen E, Elbourne D, et al. Effect of 2-y n-3
long-chain polyunsaturated fatty acid supplementation on cognitive function in older people: a randomized, double-blind, controlled trial. Am J Clin Nutr 2010;91:1725– 1732.
5. Quinn JF, Raman R, Thomas RG, et al. Docosahexaenoic acid supplementation and cognitive decline in Alzheimer disease: a randomized trial. JAMA 2010;304:1903–1911.
6. Tan ZS, Harris WS, Beiser AS, et al. Red blood cell omega-3 fatty acid levels and markers of accelerated brain aging. Neurology 2012;78:658 – 664.
7. Three-City Study Group. Vascular Risk factors and risk of dementia: design of the Three-City Study and baseline characteristics of the study population. Neuroepidemiol-ogy 2003;22:316 –325.
8. The FIL Methods Group. SPM8 Manual. London, UK, 2010. Available at: http://www.fil.ion.ucl.ac.uk/spm/doc/ manual.pdf. Accessed June 2012.
9. Lemaitre H, Crivello F, Dufouil C, et al. No epsilon4 gene dose effect on hippocampal atrophy in a large MRI data-base of healthy elderly subjects. Neuroimage 2005;24: 1205–1213.
10. Tzourio-Mazoyer N, Landeau B, Papathanassiou D, et al. Automated anatomical labeling of activations in SPM us-ing a macroscopic anatomical parcellation of the MNI MRI single-subject brain. Neuroimage 2002;15:273–289. 11. Folstein MF, Folstein SE, McHugh PR. “Mini-mental state”: a practical method for grading the cognitive state of patients for the clinician. J Psychiatr Res 1975;12:189 – 198.
12. Isaacs B, Kennie AT. The Set test as an aid to the detection of dementia in old people. Br J Psychiatry 1973;123:467– 470.
13. Amieva H, Le Goff M, Millet X, et al. Prodromal Alzhei-mer’s disease: successive emergence of the clinical symp-toms. Ann Neurol 2008;64:492– 498.
14. American Psychiatric Association. Diagnostic and Statisti-cal Manual of Mental Disorders: DSM-IV. Washington, DC: American Psychiatric Association; 1994.
15. Radloff LS. The CES-D scale: a self-report depression scale for research in the general population. Appl Psychol Meas 1977;1:385– 401.
16. Berkman LF, Berkman CS, Kasl S, et al. Depressive symp-toms in relation to physical health and functioning in the elderly. Am J Epidemiol 1986;124:372–388.
17. Fuhrer R, Rouillon F. La Version Franc¸aise de l’E´chelle CES-D (Center for Epidemiologic Studies–Depression Scale): description et traduction de l’e´chelle d’auto-e´valuation. Psychiatr Psychobiol 1989;4:163–166. 18. Samieri C, Feart C, Letenneur L, et al. Low plasma
eicosa-pentaenoic acid and depressive symptomatology are inde-pendent predictors of dementia risk. Am J Clin Nutr 2008;88:714 –21.
19. Proust-Lima C, Dartigues JF, Jacqmin-Gadda H. Misuse of the linear mixed model when evaluating risk factors of cognitive decline. Am J Epidemiol 2011;174:1077–1088. 20. Laird NM, Ware JH. Random-effects models for
longitu-dinal data. Biometrics 1982;38:963–974.
21. Proust C, Jacqmin-Gadda H, Taylor JM, Ganiayre J, Commenges D. A nonlinear model with latent process for cognitive evolution using multivariate longitudinal data. Biometrics 2006;62:1014 –1024.
22. Virtanen JK, Siscovick DS, Longstreth WT Jr, Kuller LH, Mozaffarian D. Fish consumption and risk of subclinical brain abnormalities on MRI in older adults. Neurology 2008;71:439 – 446.
23. Bowman GL, Silbert LC, Howieson D, et al. Nutrient biomarker patterns, cognitive function, and MRI measures of brain aging. Neurology 2012;78:241–249.
24. Conklin SM, Gianaros PJ, Brown SM, et al. Long-chain omega-3 fatty acid intake is associated positively with
ticolimbic gray matter volume in healthy adults. Neurosci Lett 2007;421:209 –212.
25. Samieri C, Feart C, Proust-Lima C, et al. Omega-3 fatty acids and cognitive decline: modulation by ApoEepsilon4 allele and depression. Neurobiol Aging 2011;32: 2317.e13– e22.
26. Feart C, Peuchant E, Letenneur L, et al. Plasma eicosapen-taenoic acid is inversely associated with severity of depres-sive symptomatology in the elderly: data from the Bordeaux sample of the Three-City Study. Am J Clin Nutr 2008;87:1156 –1162.
27. Parker G, Gibson NA, Brotchie H, Heruc G, Rees AM, Hadzi-Pavlovic D. Omega-3 fatty acids and mood disor-ders. Am J Psychiatry 2006;163:969 –978.
28. Martins JG. EPA but not DHA appears to be responsible for the efficacy of omega-3 long chain polyunsaturated fatty acid supplementation in depression: evidence from a meta-analysis of randomized controlled trials. J Am Coll Nutr 2009;28:525–542.
29. Stoub TR, Bulgakova M, Leurgans S, et al. MRI predictors of risk of incident Alzheimer disease: a longitudinal study. Neurology 2005;64:1520 –1524.
30. den Heijer T, Geerlings MI, Hoebeek FE, Hofman A, Koudstaal PJ, Breteler MM. Use of hippocampal and amygdalar volumes on magnetic resonance imaging to pre-dict dementia in cognitively intact elderly people. Arch Gen Psychiatry 2006;63:57– 62.
31. Horinek D, Varjassyova A, Hort J. Magnetic resonance analysis of amygdalar volume in Alzheimer’s disease. Curr Opin Psychiatry 2007;20:273–277.
32. Ferreira LK, Diniz BS, Forlenza OV, Busatto GF, Zanetti MV. Neurostructural predictors of Alzheimer’s disease: a
meta-analysis of VBM studies. Neurobiol Aging 2011;32: 1733–1741.
33. Risacher SL, Saykin AJ, West JD, Shen L, Firpi HA, Mc-Donald BC. Baseline MRI predictors of conversion from MCI to probable AD in the ADNI cohort. Curr Alzheimer Res 2009;6:347–361.
34. Murphy EA, Holland D, Donohue M, et al. Six-month atrophy in MTL structures is associated with subsequent memory decline in elderly controls. Neuroimage 2010;53: 1310 –1317.
35. Krishnan V, Nestler EJ. The molecular neurobiology of depression. Nature 2008;455:894 –902.
36. Hamilton JP, Siemer M, Gotlib IH. Amygdala volume in major depressive disorder: a meta-analysis of magnetic res-onance imaging studies. Mol Psychiatry 2008;13:993– 1000.
37. Suslow T, Konrad C, Kugel H, et al. Automatic mood-congruent amygdala responses to masked facial expressions in major depression. Biol Psychiatry 2010;67:155–160. 38. Windischberger C, Lanzenberger R, Holik A, et al.
Area-specific modulation of neural activation comparing escita-lopram and citaescita-lopram revealed by pharmaco-fMRI: a randomized cross-over study. Neuroimage 2010;49:1161– 1170.
39. Hodson L, Skeaff CM, Fielding BA. Fatty acid composi-tion of adipose tissue and blood in humans and its use as a biomarker of dietary intake. Prog Lipid Res 2008;47:348 – 380.
40. Harald K, Salomaa V, Jousilahti P, Koskinen S, Varti-ainen E. Non-participation and mortality in different socioeconomic groups: the FINRISK population sur-veys in 1972–92. J Epidemiol Community Health 2007;61:449 – 454.