HAL Id: hal-00212337
https://hal.archives-ouvertes.fr/hal-00212337
Submitted on 23 Jan 2008
HAL is a multi-disciplinary open access
archive for the deposit and dissemination of
sci-entific research documents, whether they are
pub-lished or not. The documents may come from
teaching and research institutions in France or
abroad, or from public or private research centers.
L’archive ouverte pluridisciplinaire HAL, est
destinée au dépôt et à la diffusion de documents
scientifiques de niveau recherche, publiés ou non,
émanant des établissements d’enseignement et de
recherche français ou étrangers, des laboratoires
publics ou privés.
Measuring the global phase coherence of an image
Gwendoline Blanchet, Lionel Moisan, Bernard Rougé
To cite this version:
Gwendoline Blanchet, Lionel Moisan, Bernard Rougé. Measuring the global phase coherence of an
image. 15th IEEE International Conference on Image Processing (ICIP), 2008, San Diego, United
States. pp.1176 - 1179, �10.1109/ICIP.2008.4711970�. �hal-00212337�
MEASURING THE GLOBAL PHASE COHERENCE OF AN IMAGE
Gwendoline Blanchet
1, Lionel Moisan
2, Bernard Roug´e
1 1Centre National d’ ´Etudes Spatiales, Toulouse, France
2
Universit´e Paris Descartes, MAP5, CNRS UMR 8145, Paris, France
ABSTRACTThe Fourier phase spectrum of an image is well known to con-tain crucial information about the image geometry, in particu-lar its contours. In this paper, we show that it is also strongly related to the image quality, in particular its sharpness. We propose a way to define the Global Phase Coherence (GPC) of an image, by estimating the volume of all possible phase functions that, associated with the measured modulus, pro-duce images that are not less likely than the original image. The likelihood is measured with the total variation (Rudin-Osher-Fatemi implicit prior), and the numerical estimation is realized by a Monte-Carlo simulation. We show that the ob-tained GPC measure decreases with blur, noise, and ringing, and thus provides a new interesting sharpness indicator, that can be used for parametric blind deconvolution, as demon-strated by experiments.
Index Terms— Fourier Transform, phase information,
image quality, sharpness, total variation.
1. INTRODUCTION
The Fourier Transform of an image can be decomposed in two components, its power spectrum (the square modulus of each Fourier coefficient), and the phase (the argument of each Fourier coefficient). While the modulus is pretty well un-derstood in terms of image filtering (many smoothing filter have a positive Fourier Transform, so that they only operate on the modulus component), the phase component seems to be much more complex. Oppenheim and Lim [1] have no-ticed that this phase component is responsible for the forma-tion of geometrical image elements like contours, since these elements persist when the modulus information is lost (e.g., when a constant modulus is imposed, or when the power spec-trum of another image is used). Morrone and Owens [2] have shown that edges could be efficiently detected on an image by looking at points of maximum phase congruency. Later, Kovesi [3] improved the measure of phase congruency, by adding noise compensation and multiscale capabilities, yield-ing a more robust low-level image invariant. More recently, Wang and Simoncelli [4] defined a notion of local phase co-herence based on the coarse-to-fine prediction across scales of the phase of a wavelet transform, and showed its relation
to image blur. Because the translation of an image can be characterized by the addition of a ramp function in the phase domain, phase information has also been used for image reg-istration, in early studies [5] but also more recently, e.g. in [6] to provide a motion confidence measure. Let us also mention recent psychophysical studies [7, 8], which suggest that the phase component plays a specific role in human perception.
Phase coherence is a requirement for countours, because all sine waves involved in the reconstruction of an image from its Fourier coefficients have to cooperate locally to produce a high gradient between two rather “flat” regions. Hence, measuring the total amount of phase coherence of an image may provide an indication on the quality of these transitions between flat regions, that is, more intuitively, on the image sharpness. In Section 2, we propose a definition of the Global Phase Coherence (GPC) of an image, by considering the rel-ative regularity (total variation) of images with all possible phase functions. In Section 3, we describe a Monte Carlo al-gorithm to estimate the GPC, and give a solution to prevent the usual quantization of images and the implicit periodiza-tion (due to the use of the Discrete Fourier Transform) from introducing a strong bias. In Section 4, we study the behavior of GPC with respect to noise an blur and give theoretical and experimental arguments to demonstrate that the GPC of an image is related to its sharpness. This leads us to an applica-tion to parametric blind deconvoluapplica-tion (Secapplica-tion 5), motivated by the fact that ringing also decreases the GPC, contrary to many sharpness indicators. In Section 6, we conclude and mention some possible other applications.
2. A GLOBAL PHASE COHERENCE MEASURE
Let u : Ω → R be a discrete grey-level image, where Ω = {0, . . . n−1}2is the discrete image domain (we assume that Ω is a square to simplify the notations) and u(x) represents the intensity of a pixel x ∈ Ω. The Discrete Fourier Transform (DFT) of u is the complex-valued function
ˆ u(ξ) = X x∈Ω u(x) e−2iπ n <x,ξ> defined on R = Z2 ∩ [−n 2, n
2)2, and the phase of u is a
uis real-valued, ϕ is odd, that is ϕ(−ξ) = −ϕ(ξ) for all ξ ∈ R. To understand the nature of the information contained in ϕ, we can change ϕ into another (odd) phase function ψ and look at the reconstructed image
uψ(x) =
1 n2
X
ξ∈R
|ˆu(ξ)| · e2iπn <x,ξ>+iψ(ξ).
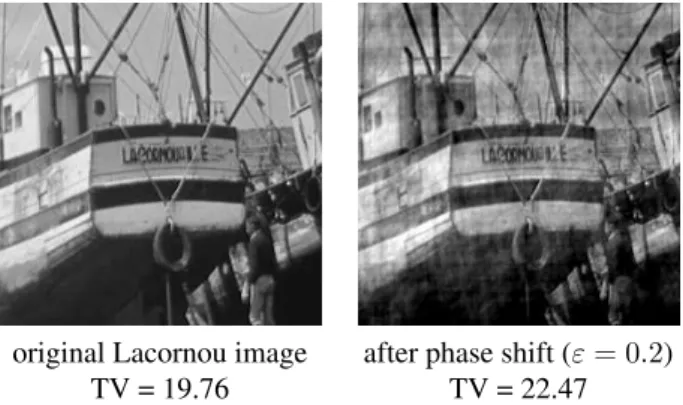
We distorded the phase function ϕ of the classical La-cornou image (see Fig. 1) by adding to it a random shift εS, yielding a new phase function ψ = ϕ + εS, where ε is a fixed number (ε = 0.2 on the experiment) and the S func-tion is made of i.i.d. random variables uniformly distributed on (−π, π) (except for half of the variables, which are con-strained by the fact that S must be an odd function). As we can see on Fig. 1, when the phase information is deterio-rated, the first structures to be damaged are flat zones. In the extreme case (ε = 1), the phase would become completely random, and we would obtain a microtexture (colored noise). To measure the amount of “image structure” that is contained in the phase component ϕ, we propose to use a likelihood measurement based on total variation: the probability density function p(u) = Z−1exp(−αT V (u)),where Z and α are
positive constants, and the (periodic) total variation of u is T V (u) = X
|x−y|=1
|u(x) − u(y)|, (1) (the difference x−y being understood modulo Ω). This image prior has been implicitely used for a long time, since it nat-urally arises when the Rudin-Osher-Fatemi denoising model [9] is rewritten in a statistical (maximum a posteriori) setting. Among all possible odd phase functions ψ, some of them will produce a more likely image (p(uψ) > p(u)), while most
of them will produce a less likely image (p(uψ) < p(u)).
Since p(u) is a decreasing function of T V (u), we can as well compare T V (uψ)and T V (u), and obtain the following
defi-nition:
original Lacornou image after phase shift (ε = 0.2) TV = 19.76 TV = 22.47
Fig. 1. The phase function of the Lacornou image (left) is
alterated by a random phase shift in (−επ, επ) which pollutes flat zones and increases the total variation (right).
Definition 1 We define the global phase coherence (GPC) of
an image u by GP C(u) = − log10 µ|{ψ ∈ P, T V (u ψ) ≤ T V (u)}| |P| ¶ ,
where P is the vector space of odd phase functions and |S| denotes the Lebesgue measure of a set S.
Hence, the global phase coherence of an image is, in -log scale, the relative volume of phase functions that, combined with the modulus |ˆu|, produce images that are not less plausi-ble than u. Notice that for a 100 × 100 image, a precision of 10% on each phase component leads to a relative volume of about 10−5000, so that we expect the log
10scale to be more
convenient to measure the global phase coherence.
3. NUMERICAL ESTIMATION
A classical way to estimate numerically the relative volume of a set is to use Monte Carlo sampling. Here we could take N images u1, . . . uN generated by imposing random phases to
u, and count the number k of indices i for which T V (ui) ≤
T V (u). Then we would have GP C(u) ' − log10(k/N ).
However, this method cannot be used here, since we expect GP C(u)to be large (several hundreds or thousands) and in such cases we would systematically obtain k = 0. To over-come this difficulty, we numerically define the global phase coherence of u by GP CN(u) = − log10Φ µµ − T V (u) σ ¶ ,
where µ and σ are the empirical mean and variance of the samples (T V (ui))1≤i≤N, and Φ is the tail of the Normal
Dis-tribution, that is Φ(x) = (2π)−1/2R+∞ x e−t
2/2
dt. This ap-proximation amounts to assume that if U is a random image with fixed Fourier modulus and i.i.d uniform (odd) random phases, then the distribution of T V (U) is Gaussian. This as-sumption can be proven to be asymptotically true (using a generalization of the Central Limit Theorem), and was always verified in practice up to a precision of 10−4or so (maximum
k · k∞difference between repartition functions).
Since we compute the phase functions with a Discrete Fourier Transform, we implicitely assume that all discrete im-ages are periodic, and this is why we chose to use a periodic definition of T V (u) (Equation 1). However, it is well known that the forced periodization of an image creates strong arti-facts on its Fourier Transform, especially among vertical and horizontal frequencies. This could bias the GPC measure (and numerical experiments prove that it actually does), so in or-der to avoid this we work on the periodic component of u (see [10]), per(u), whose reduced discontinuities across the frame border permits to avoid periodization artifacts. Another arti-fact that could (and actually does) bias the GPC measure is
the fact that numerical images are quantized on a finite num-ber of grey values, which introduces a small bias on the TV measure (e.g., quantization may produce artificially constant zones where T V = 0). In order to avoid this, we apply a de-quantization operator Q, that simply consists in a (1/2, 1/2) Fourier-based translation [11]. In the end, we are led to es-timate the global phase coherence of a numerical image by GP C0
N(u) = GP CN(Q(per(u)))for N large enough (one
thousand or more).
4. GPC AS A SHARPNESS INDICATOR
Now we have defined the GPC in a natural way and dealt with numerical artifacts, we can try to understand how the GPC measure is related to image properties. A first simple remark is that it is invariant under affine contrast changes, that is one has GP C(a · u + b) = GP C(u) for any real a and bsuch that a 6= 0. Another interesting property is that if U is a colored noise (that is, a white noise convolved with some given kernel), then one has Prob {GP C(U) ≥ t} ≤ 10−t. In
other words, it is almost impossible for a noise image to have, by chance, a GPC above 3 or 4.
Previous remarks suggest that the GPC should be related to the level of blur. On Fig. 2, we estimated the GPC of several small windows, and it appeared to distinguish very well foreground (sharp) and background (blurry) zones.
To investigate further the relation between GPC, blur and noise, we can compute the 2D-function
f (r, σ) = GP C0
N(gr? u + σW ),
where gris the 2-D Gaussian kernel with standart deviation
rand W a white noise image with unit variance. On Fig. 3,
A E
C
D B
Fig. 2. Estimated GPC on several sub-windows of the parrots
image [12] are 206 (A), 388 (B), 240 (C), 2.56 (D), 0.33 (E). We can see that the GPCs of all three well-focused details (A,B,C) are very high, independently of their content or con-trast. Background windows are blurry and hence have very low GPCs. 1e+04 5e+03 2e+03 300 100 30 10 2 2 2 2 2 2 2 0 1 2 3 4 5 6 7 8 9 10 0 1 2 3 4 5 6 7 8 9 10 r sigma
Fig. 3. 2D blur-noise GPC diagram for Lacornou image.
GP CN is computed for N = 4000.
the level-lines of f are represented for the classical Lacornou image (u): we can see that the GPC rapidly decreases when the blur and the noise increase, and that, for example, a blur of r = 1 is, in terms of GPC, equivalent to a noise of σ = 6.
From these observations, the GPC appears to be some kind of sharpness indicator for natural images. One can try to explain this in the following way: a natural image generally presents edges and flat zones. When its phase is modified, the sine waves that were perfectly aligned to produce these edges and flat zones are desynchronized, so that wavy patterns ap-pear in flat zones, which increases the total variation. This phenomenon is amplified for sharp images, that have sharp edges near flat zones, but reduced for blurry and/or noisy im-ages, that are more robust to slight phase distortions.
5. APPLICATION TO BLIND DECONVOLUTION
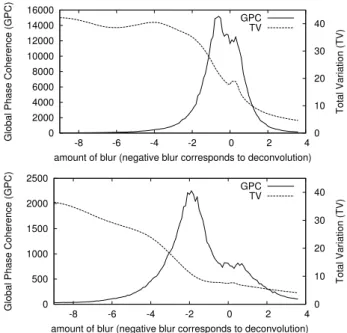
Contrary to what common sense would suggest, “sharp” is not the opposite of “blurry”, in the sense that an image which is not blurry is not necessarily sharp: it can present quantity of other artifacts like noise, ringing, aliasing, etc., that, like blur, reduce the amount of true details that can be perceived. Up to now, we checked that the GPC was decreased by blur and noise, but is it also decreased by ringing? Ringing is typically produced on an image when some components of its Fourier Transform are improperly magnified, which causes oscilla-tions in the space domain. Intuitively, we can expect ringing to decrease the GPC, since oscillations are known to have a high TV cost. This suggests an application of the GPC mea-sure to blind deconvolution: if an image u has been obtained by convolving a given image v with some Gaussian kernel gr
for some (unknown) r, we could try to estimate r (and v) by selecting the sharpest image among all deconvolved images (g−1
r ? u)r>0. This experiment is illustrated on Fig. 4 on the
0 2000 4000 6000 8000 10000 12000 14000 16000 -8 -6 -4 -2 0 2 4 0 10 20 30 40
Global Phase Coherence (GPC)
Total Variation (TV)
amount of blur (negative blur corresponds to deconvolution) GPC TV 0 500 1000 1500 2000 2500 -8 -6 -4 -2 0 2 4 0 10 20 30 40
Global Phase Coherence (GPC)
Total Variation (TV)
amount of blur (negative blur corresponds to deconvolution) GPC
TV
Fig. 4. Top: Graphs of r 7→ GP C(hr ? u) and r 7→
T V (hr?u), where u is the Lacornou image and hris a
decon-volution kernel (r < 0) or a blur kernel (r > 0) (see Equation 2). Bottom: same experiment applied to u0 = g
2? u + w,
where w is a Gaussian white noise with unit variance. Con-trary to a simple TV measurement, the GPC permits to se-lect the best deconvolution parameter r as the one producing the image with the most coherent phases. The original La-cornou image can be slightly improved (GPC is maximum for r = −0.6), and the parameter of the blur kernel used to pro-duce the degrade version is well recovered (GPC is maximum for r = −2.1).
hr? uis represented as a function of r, where hr = gr for
r ≥ 0(convolution) and c hr(ξ) = d g−r∗(ξ) |dg−r(ξ)|2+ λπ2|ξ|2 (2) with λ = 0.1 for r < 0 (regularized deconvolution). In each case, the deconvolution parameter (r) that is found by max-imizing the GPC of the restored image is near the expected value: a little less than 0 for the original image (since, like most images, its quality can be improved with a small decon-volution), and around −2 for the degraded image (that had been blurred with r = 2). Notice that classical energy-based criteria (L2norm, TV, etc.) lead to (approximately) monotone
graphs and thus offer no such possibility to select r.
6. CONCLUSION
We presented a way to analyze the phase coherence of an im-age, by using both its Fourier Transform and a spatial mea-surement, the Total Variation. We showed that the phase co-herence could be analyzed globally, provided that artifacts
are avoided by using a periodic+smooth decomposition [10] and a dequantization process [11]. The resulting GPC mea-surement decreases with blur, noise and ringing, and seems for these reasons to be an interesting indicator of the quality (sharpness) of an image. We showed that it could be used for local blur evaluation and parametric blind deconvolution, but, among other applications that could be investigated, im-age quality assessment, the selection of sharp imim-ages in large databases or acquisition campains, and more general image restoration processes seem to offer interesting perspectives.
7. REFERENCES
[1] A.V. Oppenheim and J.S. Lim, “The importance of phase in signals,” in Proc. IEEE, 1981, vol. 69:5, pp. 529–541.
[2] M.C. Morrone and D.C. Burr, “Feature detection in hu-man vision: A phase-dependent energy model,” in Proc.
Royal Society, London Series B 235, 1988, pp. 221–245.
[3] P Kovesi, “Phase congruency: A low-level image invari-ant,” Psychol. Research, vol. 64, pp. 136–148, 2000. [4] Z. Wang and E.P. Simoncelli, “Local phase
coher-ence and the perception of blur,” Adv. Neural
Informa-tion Processing Systems, vol. 16 (NIPS’03), S. Thrun,
L. Saul and B. Sch¨olkopf edts., 2004.
[5] C.D. Kuglin and D.C. Hines, “The phase correlation im-age alignment method,” in IEEE Conf. on Cybernetics
and Society, 1975, pp. 163–165.
[6] L. To, M. Pickering, M. Frater, and J. Arnold, “A mo-tion confidence measure from phase informamo-tion,” in
Int. Conf. on Image Processing, 2004, pp. 2583–2586.
[7] K.R. Gegenfurtner, D.I. Braun, and F.A. Wichmann, “The importance of phase information for recognizing natural images,” J. of Vision, vol. 3:9, pp. 519, 2003. [8] B.C Hansen and R.F Hess, “Structural sparseness and
spatial phase alignment in natural scenes,” J. of Optical
Society of America A, vol. 24:7, pp. 1873–1885, 2007.
[9] L. Rudin, S. Osher, and C. Fatemi, “Nonlinear total variation based noise removal algorithm,” Physica D, vol. 60, pp. 259–268, 1992.
[10] L. Moisan, “Periodic plus smooth image decomposi-tion,” preprint, MAP5, Universit´e Paris Descartes, 2008. [11] A. Desolneux, S. Ladjal, L. Moisan, and J.-M Morel, “Dequantizing image orientation,” IEEE Trans. on
Im-age Processing, vol. 11:10, pp. 1129–1140, 2002.
[12] H.R. Sheikh, Z.Wang, L. Cormack, and A.C. Bovik, “Live image quality assessment database release 2,” http://live.ece.utexas.edu/research/quality.
![Fig. 2. Estimated GPC on several sub-windows of the parrots image [12] are 206 (A), 388 (B), 240 (C), 2.56 (D), 0.33 (E).](https://thumb-eu.123doks.com/thumbv2/123doknet/15003156.676215/4.892.480.821.117.373/fig-estimated-gpc-sub-windows-parrots-image-b.webp)