Divergent effects of oxytocin treatment of obese diabetic mice on adiposity and diabetes
13
0
0
Texte intégral
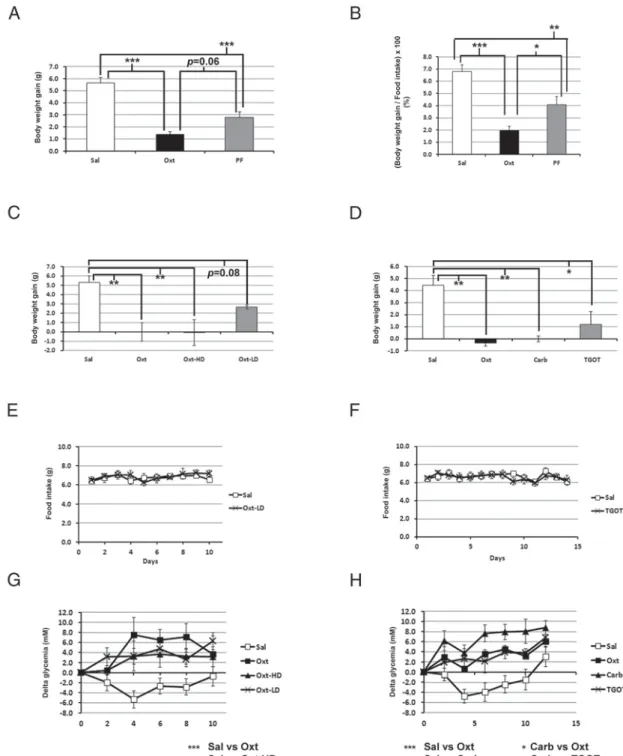
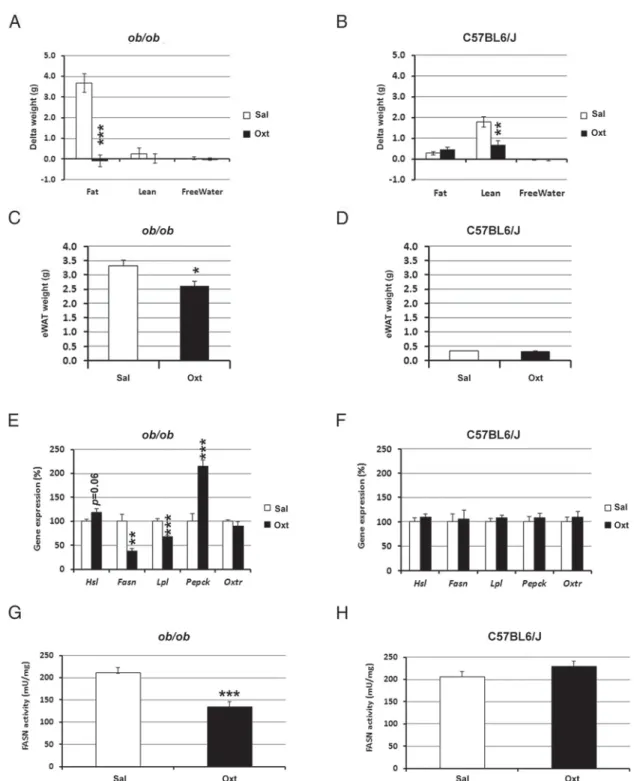
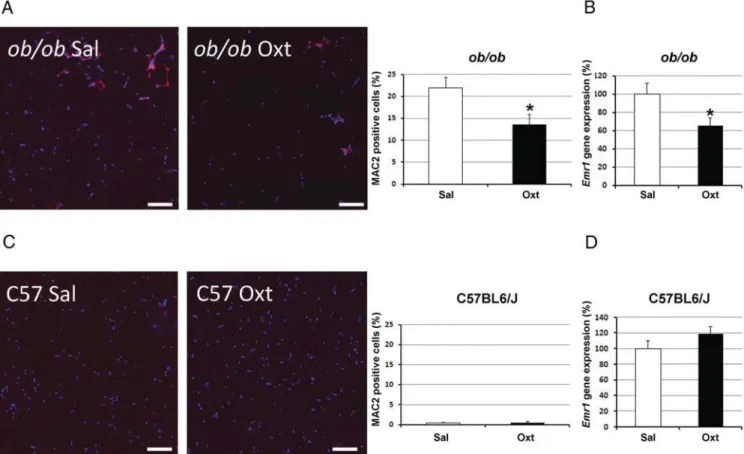
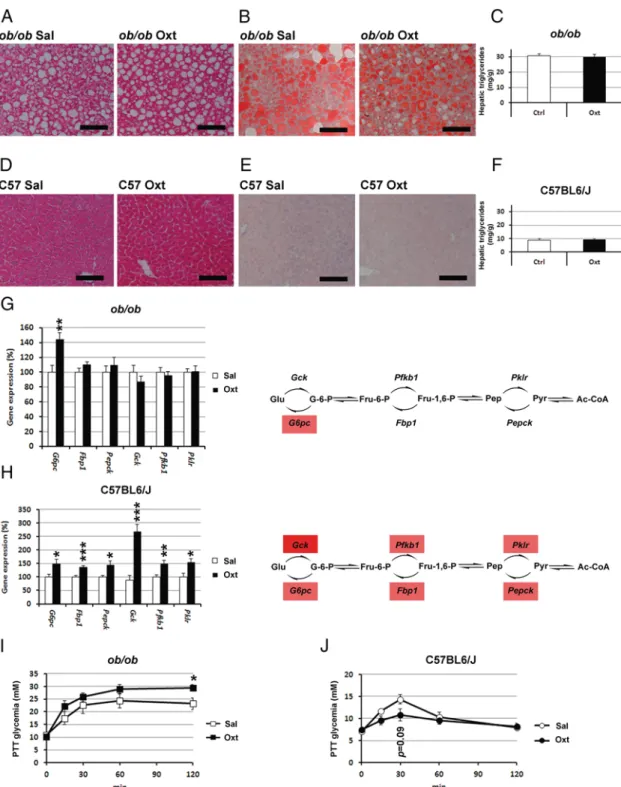
Figure


+4
Documents relatifs