Supplementary Material
Michael Brauchle et al. doi: 10.1242/bio.201410041
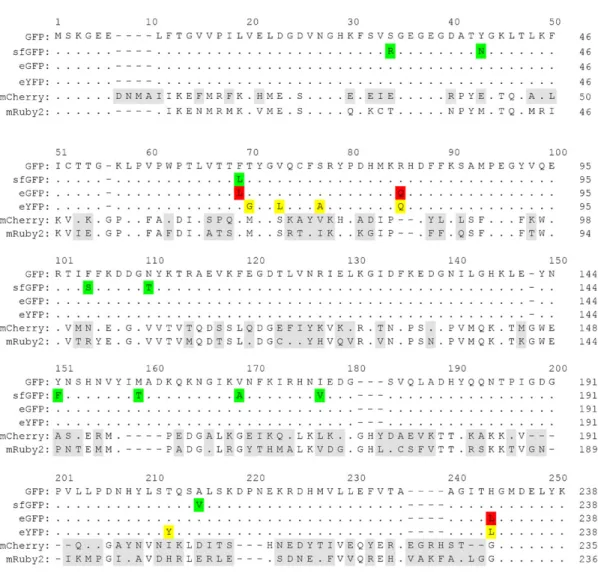
Fig. S1. Alignment of GFP, sfGFP, eGFP, eYFP, mCherry and mRuby2. Sequence-based alignment of GFP, sfGFP, eGFP, eYFP, mCherry and mRuby2. Identical residues to the GFP sequence (top line) are represented by a dot (.), gaps are shown by hyphens (-). Differences to GFP are written in one letter amino acid code and are highlighted in green, red and yellow for sfGFP, eGFP and eYFP, respectively. Differences between mCherry and mRuby2 are highlighted in gray. Compared to GFP (which was used in the RD selection) sfGFP differs in 10 residues (96% sequence identity), eGFP in 3 residues (99%) and eYFP in 6 residues (97%). mCherry (which was the target used in a different RD selection) and mRuby2 have sequence identities of 27 and 30% to GFP, respectively, and 54% to each other.
Fig. S4. Kinetic titration SPR experiments of DARPins binding to GFP. Five increasing DARPin concentrations (0.11, 0.33 1, 3, and 9 nM) were injected over a GFP-coated surface and binding was monitored by SPR. Black curves represent duplicates of binding signals, red curves indicate a global fit to a 1:1 kinetic titration binding model (Karlsson et al., 2006). Extracted kinetic data can be found in Table 1.
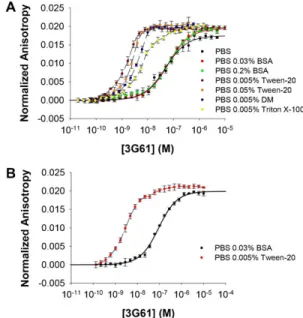
Fig. S5. Influence of buffer conditions on the affinity of anti-GFP DARPin 3G61 binding to GFP (A) and sfGFP (B). Fluorescence anisotropy assays with anti-GFP DARPin 3G61 were carried out in different buffer conditions. (A) Binding to GFP: addition of BSA does not alter the KDas
assays performed in PBS, PBS with 0.03% BSA and PBS with 0.2% BSA all give KDs of about 60 nM (Table 1). In contrast, addition of Tween-20,
decyl-maltoside (DM) and Triton X-100 increases the affinity, although to different extents; note that the dashed lines do not represent a fitted curve, as these assay conditions are not suitable to obtain a quantitative result (as [GFP] is higher than KD). Nonetheless, it is obvious that the addition of
Tween-20 increases the affinity to around the same KDvalue determined by
SPR (supplementary material Fig. S4 and Table 1), measured under the same conditions. (B) Also binding to sfGFP is much tighter in PBS with Tween-20; also here the dashed line does not represent a fit. For the affinity in PBS with 0.03% BSA, see Table 1.
Biology
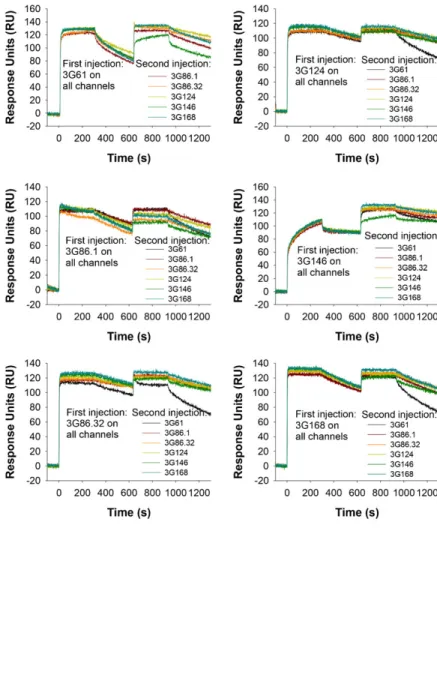
Fig. S6. SPR does not show simultaneous binding of any two DARPins to GFP. A GFP-coated SPR surface was saturated by injection of one DARPin, dissociation was allowed to occur for 300 sec, followed by a second injection with another DARPin. No combination of two anti-GFP DARPins showed an increased binding above the plateau reached by the injection of the first anti-GFP DARPin alone, indicating that these DARPins cannot bind simultaneously.
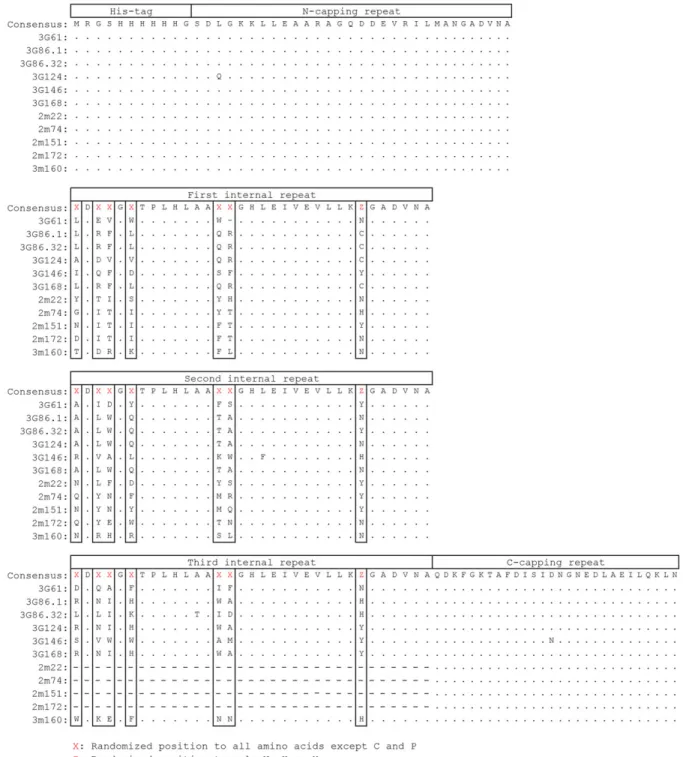
Fig. S9. Alignment of DARPins. Sequence-based alignment of selected DARPins. The top row indicates the consensus sequence used in the library with randomized positions indicated as X (randomization to all amino acids but Cys and Pro) and Z (randomization to Asn, His or Tyr) highlighted in black frames. Identical residues are shown as dots (.), gaps are shown as hyphens (-), selected randomized positions along with framework mutations are shown as one-letter amino acid code.
Biology
Table S1. Full-length nt sequences of DARPins used in this study