Contents lists available atScienceDirect
Comptes Rendus Palevol
w w w . s c i e n c e d i r e c t . c o mSystematic palaeontology (Vertebrate palaeontology)
Bite force of the extinct Pleistocene Cave bear Ursus spelaeus
Rosenmüller from Europe
Force de la morsure de l’ours des cavernes Ursus spelaeus Rosenmüller
du Pléistocène d’Europe
Aurora Grandal-d’Anglade
Instituto Universitario de Xeoloxía, Universidade da Coru˜na, Campus de Elvi˜na s/n, 15071 A Coru˜na, Spain
a r t i c l e i n f o
Article history: Received 7 April 2009
Accepted after revision 6 October 2009 Available online 22 December 2009
Presented by Philippe Taquet
Keywords: Ursus spelaeus Bite force Sexual dimorphism Herbivore feeding
a b s t r a c t
In this paper, I have made a theoretical calculation of the Cave bear’s bite force (BF) following the “dry skull method” and I present for the first time BF data that can be of interest to elucidate the mechanisms underlying the dietary choice of the Cave bears. In the skulls studied, males show higher BF than females in absolute terms, but more similar with regard to their body mass, which partly compensates for the smaller size of the females. The whole sample studied shows lower BF in the upper carnassial than those of large cats, similar to the one calculated for the Giant panda and higher than that of Polar bear.
© 2009 Académie des sciences. Published by Elsevier Masson SAS. All rights reserved.
Mots clés : Ursus spelaeus Force de morsure Dimorphisme sexuel Régime herbivore
r é s u m é
Dans ce travail, j’ai réalisé un calcul théorique de la force de morsure (BF) de l’ours des cav-ernes, en suivant la « dry skull method », et j’y présente, pour la première fois, des données de BF sur cette espèce, qui peuvent être d’un grand intérêt pour comprendre les mécan-ismes qui interviennent dans les préférences trophiques de l’ours des cavernes. Dans les crânes étudiés, les mâles présentent des BF plus grandes que celles des femelles en valeurs absolues, mais plus similaires en relation avec leur masse corporelle, ce qui, en partie, com-pense la taille inférieure des femelles. Tout l’échantillonnage étudié présente des BF dans la carnassière supérieure, inférieures à celles des grands félins, similaires à celle calculée pour l’Ours Panda et supérieures à celle de l’Ours polaire.
© 2009 Académie des sciences. Publi ´e par Elsevier Masson SAS. Tous droits réservés.
1. Introduction
The Cave bears (Ursus spelaeus group) are extinct ursids of wide European and Asian distribution (Knapp et al.,
E-mail address:xeaurora@udc.es.
2009). From morphological and genetic analyses results that the Cave bear group was highly diversified consist-ing of at least three or four species (Hofreiter et al., 2002; Rabeder and Hofreiter, 2004; Rabeder et al., 2004). The Cave bears from Eirós Cave (this study) belong to Ursus spelaeus ROSENMÜLLER (Stiller et al., 2009). Genetic stud-ies show the divergence of Cave bears from the lineage of
1631-0683/$ – see front matter © 2009 Académie des sciences. Published by Elsevier Masson SAS. All rights reserved. doi:10.1016/j.crpv.2009.10.003
the Brown bear from 1.6 to 1.2 million years ago (Knapp et al., 2009).
The most outstanding characteristic traits of this species are its large size and body mass (BM), which would reach 400–500 kg in males and 225–250 kg in females (Christiansen, 1999) and its clear craniodental adapta-tions to a mainly herbivorous diet (Kurtén, 1976; Rabeder, 1999), also confirmed by numerous stable isotope studies (Bocherens, 1990; Bocherens et al., 1994; Bocherens et al., 2006; Fernández-Mosquera et al., 2001; Nelson et al., 1998). The skull shows a characteristic domed profile and wide areas of insertion for the masseter and temporal muscles, which suggest and great bite force (BF) (Grandal-d’Anglade and López González, 2005; Kurtén, 1976). This BF is con-centrated in the posterior regions of the maxilla and the mandibula, where the postcarnassial molars are situated. In this species, postcarnassial molars reach the greatest devel-opment in current ursids and in all the representatives of the Carnivorous Order.
In current ursids it is possible to detect ecomorpholog-ical patterns relating to the diet and the feeding behaviour (Sacco and Van Valkenburgh, 2004), even though the phylogenetic restriction, in a group of species so closely related, could sometimes disguise the interspecific dif-ferences. A recent ecomorphological study of the Ursidae family including extinct species, among them the Cave bear, shows that the skull and the jaw of this species still show an omnivorous pattern (Figueirido et al., 2009) that is very similar to that of the Brown bear, of omnivorous feeding. The study includes the Giant panda (Ailuropoda melanoleuca), whose adaptations to herbivorous feeding develop from its divergence from the other ursids, rang-ing from 18 to 22 million years BP (Krause et al., 2008), so, in comparison, the other bear species will be likely away from its ecomorphological pattern.
In addition to the metric and ecomorphological stud-ies, there is another parameter relating to feeding, which is the BF the individual may use. Empirical data on BF are not easily obtained especially for extinct species, but can be indirectly predicted from estimates using cranial morphometry.Thomason (1991)proposed a simple model to compute BF in carnivores from the skull (“dry skull method”), but only in recent years some research has been carried out in this field. However, published com-parative studies on carnivores’ BF (Christiansen, 2007a; Christiansen and Adolfssen, 2005; Christiansen and Wroe, 2007) do not include data on Cave bears.
In this work, I will do a theoretical calculation of the BF following Thomason’s model (Thomason, 1991) and I present for the first time the BF data for the Cave bear that can be of interest to elucidate the mechanisms underlying the dietary choice of the Cave bears.
2. Material and methods
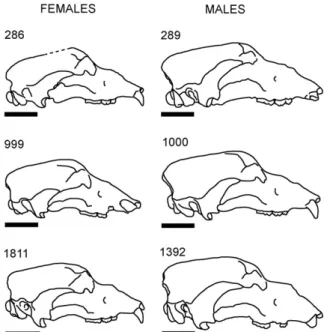
I have studied six skulls of Cave bears coming from the Cova Eirós site (Triacastela, Lugo), stored at the University Institute of Geology of the University of A Coru ˜na (Spain). It is a population that dates back from around 24 000 BP years, with morphological and metric traits similar to those of any typical population of this species and a marked
sex-Fig. 1. Line drawing of the six studied specimens. Scale bar is 10 cm. Fig. 1. Illustration des six spécimens étudiés. La barre d’échelle
repré-sente 10 cm.
ual dimorphism (Grandal-d’Anglade and López González, 2005; Grandal-d’Anglade and Vidal Romaní, 1997). The sta-ble isotope studies made in bones of this population show a mainly herbivorous feeding and a long hibernation period, relating to a time of cold weather at the end of the Marine Isotopic Stage 3 (MIS 3) or beginning of MIS 2 (Fernández-Mosquera et al., 2001). The six skulls are depicted to a same scale inFig. 1, showing the typical polymorphism of the species, and the main dimensions are inTable 1.
In this work, I have made a theoretical calculation of the BF following the “dry skull method” proposed byThomason (1991). In this method, the skull is modelled as a third-order lever, in which the effort (jaw closing muscles) is nearer the fulcrum (cotylus) than the load (food item, BF), So: Load (BF)= effort ×outin− lever arm
− lever arm Table 1
Metric data of the studied specimens.
Tableau 1
Données métriques des spécimens étudiés.
Skull Sex SKL L BIZ B OCC B FRO B BM
289 M 487.0 296.0 229.0 146.3 425.4 1000 M 497.2 303.3 235.2 152.1 443.6 1392 M 482.2 321.5 235.7 149.7 417.0 Mean Males 488.7 306.9 233.3 149.4 428.7 286 F 415.0 255.3 185.5 120.0 307.9 999 F 410.2 249.0 192.2 127.0 300.8 1811 F 396.5 248.7 186.7 133.5 280.8 Mean Females 407.2 251.0 188.1 126.8 296.5 M: male; F: female; SKL L: skull length (Prosthion-Acrocranion); BIZ B: bizygomatic breadth (Zygion-Zygion); OCC B: occipital breadth (Otion-Otion); FRO B: frontal breadth (Ectoorbitale-Ectoorbitale); BM: body mass calculated according Van Valkenburg (Rabeder et al., 2004). All distances in mm. Body mass in kg.
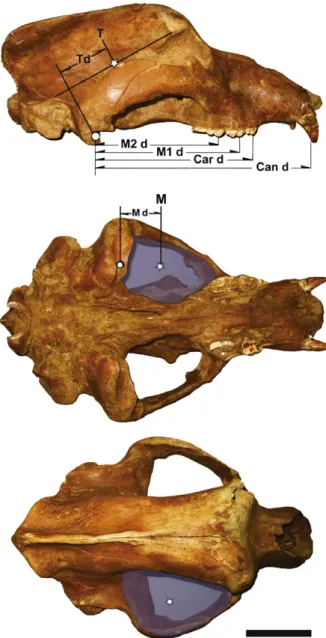
The force is calculated by using cross-sectional areas for the major jaw adductors: the temporalis and masseter-pterygoideus muscle complexes, considering the force vectors act transversally to the centroid of the muscle area. These data are obtained by means of image analysis from photographs of the skull in lateral, inferior and posterodor-sal norm (Fig. 2).
High-resolution photographs of the skulls were mea-sured using the software ImageJ, a public domain Java image-processing program developed at the National Insti-tutes of Health (Rasband, 1997-2008). Each area or length was measured 10 times, and then extreme values were dis-carded and mean values of measurements were calculated and used in this study.
That is how I obtain the area of the section of both muscle complexes and the distance from the centroid of each muscle area to the cotyle, which, multiplied by the muscle force, allows us to calculate the force of each group of muscles. As in other similar studies on carnivores’ skulls (Christiansen, 2007a; Christiansen and Adolfssen, 2005; Christiansen and Wroe, 2007), I have taken the value of 37 N/cm2 as the force a mammal’s muscle is able to
develop.
The arm of resistance is calculated according to the distance between the cotyle and the region of the upper dentition for which one wishes to calculate the BF. In this paper, I have calculated the BF of canine at crown basis, upper carnassial, first upper molar, and second upper molar (at the protocone in all three cases).
Thus:
BF=
(Masseter area× 37 × distance cotyle − masseter centroid + temporalis area ×37 × distance cotyle − temporalis centroid)
Distance cotyle− teeth
Estimated BF for ursids and other carnivores already published (Christiansen, 2007a; Christiansen and Adolfssen, 2005; Christiansen and Wroe, 2007) show striking differences for the same species, mainly in the case of ursids. These differences may be caused by the heterogeneity of the sample, at least in the case of the polymorphic brown bear, whose skull dimensions can dramatically vary along its geographical distribution. Another problem with bears is sexual dimorphism that, in our opinion, makes it necessary to separate sexes for studies related to size, BM or BF. Due to the heterogeneity of the published data, I have decided to use for comparison just those inChristiansen (2007a)and data on large cats taken fromChristiansen (2007b).
3. Results and discussion
Table 2 shows the muscle areas and distances to jaw hinge obtained from the photographs of each skull stud-ied. Estimates of muscle forces and BF for each dental piece are offered inTable 3. BF differ noticeably between sexes, pointing to the convenience of studying males and females separately in this high dimorphic species. Male skulls are larger than female ones and, besides, they present reinforced areas of muscle attachment, mainly the
occip-Fig. 2. Skull of male Cave bear E-ZYX-S-1000 in lateral (up), inferior
(mid-dle) and posterodorsal (down) views. Shaded areas cover the muscle cross sectional areas of each muscle complex. White stars show the centroids of muscle cross sectional areas. White circle shows jaw hinge. M: masseter centroid; M d: distance from masseter centroid to cotylus; T: temporalis centroid; T d: distance from temporalis centroid to cotylus; M2 d: dis-tance from the second upper molar protocone to cotylus; M1 d: disdis-tance from the upper first molar protocone to cotylus; Car d: distance from the upper carnassial protocone to cotylus; Can d: distance from upper canine at crown basis to cotylus. Scale bar is 10 cm.
Fig. 2. Crâne d’ours des cavernes E-ZYX-S-1000 mâle en vue latérale
(au-dessus), inférieure (au milieu) et postérodorsale (au-dessous). Les zones ombragées délimitent la section transversale de chaque muscle. Les étoiles blanches montrent le centroïde. Le cercle blanc montre l’articulation mandibulaire. M : centroïde du masséter ; M d : distance du centroïde du masséter au cotyle ; T : centroïde du temporal ; T d : distance du cen-troïde du temporal au cotyle ; M2 d : distance du protocône de la deuxième molaire supérieure au cotyle ; M1 d : distance du protocône de la première molaire supérieure au cotyle ; Car d: distance du protocône de la carnas-sière au cotyle ; Can d : distance de la canine à la base de la couronne au cotyle. La barre d’échelle représente 10 cm.
Table 2
Data obtained from the digitalised images of the skulls.
Tableau 2
Données obtenues à partir de l’image digitalisée des crânes.
Skull Sex M a M d T a T d M2 d M1 d Car d Can d
289 M 97.59 6.6 77.00 5.0 14.3 18.2 22.5 30.5 1000 M 96.36 7.5 87.61 5.7 16.0 20.0 24.0 33.0 1392 M 98.34 7.1 88.18 5.3 14.0 18.0 21.3 29.3 Mean Males 97.43 7.1 84.26 5.4 14.8 18.7 22.6 30.9 286 F 76.39 6.0 50.10 4.6 12.1 14.9 18.0 27.1 999 F 58.90 6.2 56.09 6.5 12.1 15.8 19.7 28.0 1811 F 66.36 5.9 48.60 3.9 12.1 14.9 18.0 27.1 Mean Females 67.221 6.0 51.59 5.0 12.1 15.2 18.6 27.4
M: male; F: female; M a: masseter and pterigoid muscle complex cross-sectional area; M d: distance from masseter and pterigoideus muscle complex centroid to cotylus; T a: temporalis cross-sectional area; T d: distance from temporalis muscle centroid to cotylus; M2 d: distance from the second upper molar protocone to cotylus; M1 d: distance from the upper first molar protocone to cotylus; Car d: distance from the upper carnassial protocone to cotylus; Can d: distance from upper canine at crown basis to cotylus. Muscle areas in mm2; distances in mm.
Table 3
Estimated bite forces for the Ursus spelaeus skulls from Cova Eirós. Tableau 3
Forces de morsure estimées des crânes d’Ursus spelaeus de Cova Eirós.
Skull Sex M F T F BF M2 BF M1 BF Car BF Can
289 M 23,976.4 14,274.2 2674.9 2101.7 1700.0 1254.1 1000 M 26,881.7 18,573.1 2840.9 2272.7 1893.9 1377.4 1392 M 25,796.7 17,456.0 3089.5 2402.9 2030.6 1476.2 Mean Males 25,551.6 16,767.8 2868.4 2259.1 1874.9 1367.2 286 F 16,959.0 8527.5 2106.3 1710.5 1415.9 940.5 999 F 13,512.8 13,488.7 2231.5 1709.0 1370.6 964.3 1811 F 14,437.3 7084.3 1778.6 1444.4 1195.6 794.2 Mean Females 14,969.7 9700.2 2038.8 1621.3 1327.4 899.7 Mean All 20,260.7 13,234.0 2453.6 1940.2 1601.1 1134.4
T F: temporalis force. M F: masseter force; BF M2: bite force at second upper molar; BF M1: bite force at first upper molar; BF Car: bite force at the carnassial; BF Can: bite force at the canine. All forces in Newton.
ital area and the zygomatic arches, (Grandal-d’Anglade and López González, 2005), so such a difference was expected.
Morphometric studies (Grandal-d’Anglade and López González, 2005) have shown that in males the muscula-ture involved in biting is absolutely and relatively more developed than in females. Our results show that, in abso-lute values, males show BF that are very similar to each other, regardless of their size, and clearly higher than those of females (Fig. 3) that form a more heterogeneous group. The differences between the average values of BF in both sexes for each dental piece are statistically significant (t-test, P < 0.001), although the scarce number of individuals (three of each sex) prevent us to make this difference exten-sive to all Cave bear populations.
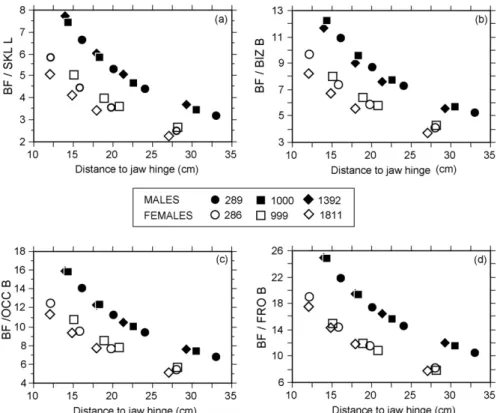
Due to the sexual size dimorphism, it is also interesting to compare BF relative to cranial dimensions. For this pur-pose, I calculated relative BF by dividing the absolute BF by the skull dimensions.
Values of BF relative to total skull length (a), bizygo-matic breadth (b), anchura occipital breadth (c) and frontal breadth (d) yield similar intersexual differences (Fig. 4). The difference of mean values for all BF relative to skull dimensions between sexes are aswell statistically signifi-cant (t-test, P < 0.001).
Fig. 3. Bite forces of the studied skulls along the maxilla. Fig. 3. Forces de morsure des crânes étudiés au long de la mâchoire.
Fig. 4. Bite forces relative to (a) skull length (BF/SKL L), (b) bizygomatic breadth (BF/BIZ B), (c) occipital breadth (BF/OCC B) and (d) frontal breadth (BF/FRO B)
of the studied specimens.
Fig. 4. Forces de morsure relatives à (a) la longueur du crâne (BF/SKL L), (b) la largeur bi-zygomatique (BF/BIZ B), (c) la largueur occipitale (BF/OCC B) et (d)
la largueur frontale (BF/FRO B) des spécimens étudiés.
It is worth to mention that the BF difference is more marked in relation to frontal breadth (Fig. 4d). In the Cave bear, the anterior temporal muscles are not inserted in an anterior sagittal crest, as in other carnivores, but into high, broad and robust frontal bones. The expanded forehead of the male Cave bear could be a result of the need of a large area for muscle attachment, leading to an anisometric growth of this skull region.
However, when the BF is contemplated with regard to the BM estimated according toVan Valkenburgh (1990), the females’ values come closer to the males’ ones or even surpass the male values (Fig. 5). In a t-test comparing mean values for males and females, the values of P range from 0.465 to 0.757, depending on each dental piece, but in this case, the mean values of relative BF of females are slightly higher than those of males for all the dental pieces except-ing the canine.
A morphometric study of Cave bear skulls conducted to determine trends in sexual size dimorphism (Grandal-d’Anglade and López González, 2005) showed that adult female skulls are smaller, albeit not necessarily more slen-der than male ones, probably due to the fact that the neurocraneus must be conservative because of the similar size of the braincase in both sexes. Male skull are larger than female ones and, besides, they present reinforced areas of muscle attachment, mainly the occipital area and the zygomatic arches, but also the frontal region. Female jaw muscles are less developed than males’ ones, but the shorter skull and jaw of the females allow them larger
rel-Fig. 5. Bite forces relative to body mass (BF/BM) of the studied specimens. Fig. 5. Forces de morsure relatives à la masse corporelle (BF/BM) des
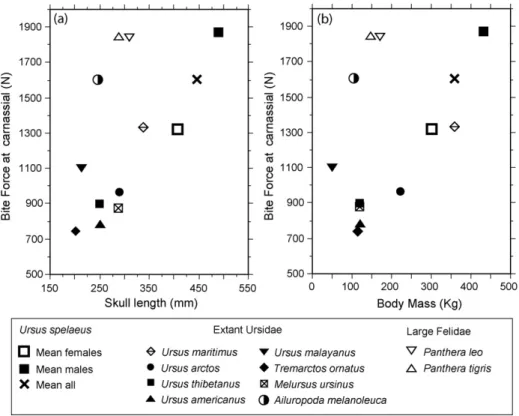
Fig. 6. (a) Carnassial bite forces of Cave bears and other Ursids according their skull length. (b) Carnassial bite forces of Cave bears and other Ursids according
their body mass. Two data of large cats included for comparison.
Fig. 6. (a). Forces de morsure dans la molaire carnassière de l’ours des cavernes et d’autres ursidés selon la longueur du crâne. (b) Forces de la morsure
dans la carnassière selon la masse corporelle. Deux données de grands félins ont été incluses pour comparaison.
ative BF, because in females the molars are placed closer to the jaw hinge.
When comparing the Cave bear’s BF values with other large carnivores I will focus on the BF in the upper carnas-sial, because this tooth is used for processing food, unlike the canine, of which function is for killing prey in carni-vores and with no feeding function in bears – although it was suggested that bear species that use the canines for tearing trunks or bamboo show a special canine morphol-ogy (Christiansen, 2008). Also because published data on extant bears do not include BF for postcarnassial molars.
The Cave bear’s elongated skull allows for a lower BF in the carnassial than that of large felines but similar to that of the Giant panda and higher than that of the polar bear, if we consider the mean value for males and females. InFig. 6 the BF in the carnassial are represented against the skull length (a) and the estimated BM (b).
Both graphics show that the Cave bear (both males and females) fall on a regression line for all other Ursinae ursids, including the almost herbivore Spectacled bear Tremarctos ornatus, the mainly insectivore Sloth bear Melursus ursinus and all the omnivore bears, excluding the outlier Sun bear Ursus malayanus with large BF for its size, perhaps related to its frequent behaviour of tearing into trees and termite mounds (Christiansen, 2007a, 2008).
The herbivore Giant panda, on the contrary, shows higher BF for its skull length and BM than all other ursids, clearly derived from its adaptation to feeding on tough,
fibrous bamboo leaves. This adaptation takes place early in its phylogeny, what is confirmed by the morphology of a small fossil panda, Ailuropoda microta from the Late Pliocene of China. Teeth, jaw and skull morphology of this primitive panda indicates that the species was already adapted to a diet of bamboo, at least two to three mil-lion years ago (Jin et al., 2007). Its specializations include increased cuspation of the cheek teeth, and a robust expansion of the posterior cranium for enhanced tempo-ral musculature. This is the main difference with the Cave bear, in which the cranium is expanded frontally for attach-ment of the anterior temporalis muscles, besides having a larger development of the masseter muscle than of tem-poralis, as can be seen in the values for cross-sectional areas inTable 3. This is a good example of how phylogeny constrains the adaptation to herbivore feeding in different lineages.
On the other hand, the Polar bear, despite of its well-known carnivore feeding, does not show specially high BF for its size and BM, probably due to its short evolutionary history (Christiansen, 2007a).
The Cave bear BF in the postcarnassial molars, which are the pieces commonly used in chewing (according to the degree of wearing in adult individuals), exceed largely the BF values in the carnassials of the Tiger and the Lion. This means a high BF, however concentrated in the back-most part of the jaw, where gape is restricted and only small items can be processed.
In any case, the BF does not express the ability to pro-cess certain types of food by itself. The application of that force is done by means of the dental cusps, which in the Cave bear are blunt, not slicing (Grandal-d’Anglade and López González, 2004; Kurtén, 1976; Rabeder, 1999). The most marked difference with regard to the Brown bear’s dentition is the loss of the three anterior premolars and the total loss of the carnassials’ slicing character. Eventu-ally, along the evolutionary line of the Cave bear, it was observed an increase in the molars’ size, with wider and wider occlusal surfaces, with numerous additional blunt cusplets (Grandal-d’Anglade and López González, 2004; Rabeder, 1999). Therefore, the powerful Cave bear’s BF is widely dispelled on a large occlusal surface of a grinding character, and with restricted gape, all of which point at a feeding based on tough vegetable matter.
4. Conclusions
In the Cave bears from Cova Eirós, males show higher BF than females in absolute terms but more similar with regard to BM, which partly compensates for the females’ smaller size.
The Cave bears studied show lower BF in the upper car-nassial than large cats if we consider the average values for both sexes, similar to the one calculated for the Giant Panda and higher than that of the Polar bear.
The estimated BF, together with the skull and teeth mor-phology, point to a mainly herbivore feeding for the Cave Bear.
Acknowledgements
This article is a contribution to the Research Project BTE-CGL-2006-08996 of the Spanish MEC. I thank two anonymous reviewers for their insightful comments on an earlier version of this manuscript.
References
Bocherens, H., 1990. Evidence for vegetarian diet of Cave bear (Ursus
spelaeus) from isotopic biogeochemistry (C-13, N-15) of fossil
verte-brate collagen. C. R. Acad. Sci. Paris, Ser. II 311 (10), 1279–1284. Bocherens, H., Fizet, M., Mariotti, A., 1994. Diet, physiology and ecology of
fossil mammals as inferred from stable carbon and nitrogen isotope biogeochemistry: implications for Pleistocene bears. Palaeogeogr. Palaeoclimatol. Palaeoecol. 107 (3–4), 213–225, doi:10.1016/0031-0182(94)90095-7.
Bocherens, H., Drucker, D., Billiou, D., Geneste, J.-M., Van Der Plicht, J., 2006. Bears and humans in Chauvet Cave (Vallon-Pont-d’Arc, Ardèche, France): Insights from stable isotopes and radiocar-bon dating of radiocar-bone collagen. J. Human Evol. 50 (3), 370–376, doi:10.1016/j.jhevol.2005.12.002.
Christiansen, P., 1999. What size were Arctodus simus and Ursus spelaeus (Carnivora: Ursidae)? Ann. Zool. Fenn. 36 (2), 93–102.
Christiansen, P., 2007a. Evolutionary implications of bite mechanics and feeding ecology in bears. J. Zool. 272 (4), 423–443, doi:10.1111/j.1469-7998.2006.00286.x.
Christiansen, P., 2007b. Comparative bite forces and canine bending strengths in feline and sabretooth felids: implications for predatory
ecology. Zool. J. Linn. Soc. 151 (2), 423–437, doi:10.1111/j.1096-3642.2007.00321.x.
Christiansen, P., 2008. Feeding ecology and morphology of the upper canines in bears (Carnivora: Ursidae). J. Morph. 269, 896–908, doi:10.1002/jmor.10643.
Christiansen, P., Adolfssen, J.S., 2005. Bite forces, canine strength and skull allometry in carnivores (Mammalia, Carnivora). J. Zool. 266 (2), 133–151, doi:10.1017/S0952836905006643.
Christiansen, P., Wroe, S., 2007. Bite forces and evolutionary adapta-tions to feeding ecology in carnivores. Ecology 88 (2), 347–358, doi:10.1890/0012-9658(2007)88[347:BFAEAT]2.0.CO;2.
Fernández-Mosquera, D., Vila-Taboada, M., Grandal-d’Anglade, A., 2001. Stable isotopes data (␦13C,␦15N) from the Cave bear (Ursus spelaeus): A new approach to its palaeoenvironment and dormancy. Proc. R. Soc. Lond. B 268 (1472), 1159–1164, doi:10.1098/rspb.2001.1639. Figueirido, B., Palmqvist, P., Perez-Claros, J.A., 2009. Ecomorphological
correlates of craniodental variation in bears and paleobiological impli-cations for extinct taxa: an approach based on geometric morphomet-rics. J. Zool. 277 (1), 70–80, doi:10.1111/j.1469-7998.2008.00511.x. Grandal-d’Anglade, A., López González, F., 2004. A study of the evolution
of the Pleistocene Cave Bear by a morphometric analysis of the lower carnassial. Oryctos 5, 78–89.
Grandal-d’Anglade, A., López González, F., 2005. Sexual dimorphism and ontogenetic variation in the skull of the Cave bear (Ursus spelaeus ROSENMÜLLER) of the European Upper Pleistocene. Geobios 38 (3), 325–337, doi:10.1016/j.geobios.2003.12.001.
Grandal-d’Anglade, A., Vidal Romaní, J.R., 1997. A population study of the Cave bears (Ursus spelaeus ROSENMÜLLER) from Cova Eirós (Tri-acastela, Galicia, Spain). Geobios 30 (5), 723–731, doi:10.1016/S0016-6995(97)80160-X.
Hofreiter, M., Capelli, C., Krings, M., Waits, L., Conard, N., Münzel, S., et al., 2002. Ancient DNA analyses reveal high mitochondrial DNA sequence diversity and parallel morphological evolution of late Pleistocene cave bears. Mol. Biol. Evol. 19 (8), 1244–1250.
Jin, C., Ciochon, R.L., Dong, W., Hunt, R.M., Jinyi Liu, J., Jaeger, M., et al., 2007. The first skull of the earliest giant panda. PNAS 104, 10932–10937, doi:10.1073/pnas.0704198104.
Knapp, M., Rohland, N., Weinstock, J., Baryshnikov, G., Sher, A., Nagel, D., et al., 2009. First DNA sequences from Asian cave bear fossils reveal deep divergences and complex phylogeographic patterns. Mol. Ecol. 18 (6), 1225–1238, doi:10.1111/j.1365-294X.2009.04088.x.
Krause, J., Unger, T., Noc¸on, A., Malaspinas, A.-S., Kolokotronis, S.-O., Stiller, M., et al., 2008. Mitochondrial genomes reveal an explosive radiation of extinct and extant bears near the Miocene-Pliocene Boundary. BMC Evol. Biol. 8 (1), doi:10.1186/1471-2148-8-220 [Article no. 220]. Kurtén, B., 1976. The Cave bear story. Life and death of a vanished animal.
Columbia University Press, New York, 163 p.
Nelson, D.E., Angerbjörn, A., Lidén, K., Turk, I., 1998. Stable isotopes and the metabolism of the European Cave bear. Oecologia 116 (1–2), 177–181, doi:10.1007/s004420050577.
Rabeder, G., 1999. Die Evolution des Höhlenbärengebisses. Mitt. Komm. Quartär. Österreichischen Akad. der Wissenschaften 11, 1–101. Rabeder, G., Hofreiter, M., 2004. Der neue Stammbaum der alpinen
Höh-lenbären. Die Höhle 55 (1–4), 58–77.
Rabeder, G., Hofreiter, H., Nagel, D., Withalm, G., 2004. New Taxa of Alpine Cave Bears (Ursidae, Carnivora). Cahiers scientif. / Dép. Rhône – Mus. Lyon, Hors série 2, 49–67.
Rasband, W.S. Image, J.U.S. National Institutes of Health, Bethesda, Mary-land, USA, 1997–2008,http://rsb.info.nih.gov/ij/.
Sacco, T., Van Valkenburgh, B., 2004. Ecomorphological indicators of feed-ing behaviour in the bears (Carnivora: Ursidae). J. Zool. 263 (1), 41–54, doi:10.1017/S0952836904004856.
Stiller, M., Knapp, M., Stenzel, U., Hofreiter, M., Meyer, M., 2009. Direct multiplex sequencing (DMPS) – a novel method for targeted high-throughput sequencing of ancient and highly degraded DNA. Genome Res. 19, 1843–1848, doi:10.1101/gr.095760.109.
Thomason, J.J., 1991. Cranial strength in relation to estimated biting forces in some mammals. Can. J. Zool. 69, 2326–2333, doi:10.1139/z91-327. Van Valkenburgh, B., 1990. Skeletal and dental predictors of body mass
in carnivores. In: Damuth, J., MacFadden, B.J. (Eds.), Body size in mammalian paleobiology: estimation and biological implications. Cambridge University Press, Cambridge, pp. 181–205.