HAL Id: hal-02391891
https://hal.archives-ouvertes.fr/hal-02391891
Submitted on 6 Dec 2019
HAL is a multi-disciplinary open access
archive for the deposit and dissemination of
sci-entific research documents, whether they are
pub-lished or not. The documents may come from
teaching and research institutions in France or
abroad, or from public or private research centers.
L’archive ouverte pluridisciplinaire HAL, est
destinée au dépôt et à la diffusion de documents
scientifiques de niveau recherche, publiés ou non,
émanant des établissements d’enseignement et de
recherche français ou étrangers, des laboratoires
publics ou privés.
Cyclic voltammetry modeling of proton transport effects
on redox charge storage in conductive materials:
application to a TiO2 mesoporous film
Y. Kim, V. Balland, B. Limoges, C. Costentin
To cite this version:
Y. Kim, V. Balland, B. Limoges, C. Costentin. Cyclic voltammetry modeling of proton transport
effects on redox charge storage in conductive materials: application to a TiO2 mesoporous film.
Physical Chemistry Chemical Physics, Royal Society of Chemistry, 2017, 19 (27), pp.17944-17951.
�10.1039/C7CP02810E�. �hal-02391891�
1
Cyclic Voltammetry Modeling of Proton Transport Effects on
Redox Charge Storage in Conductive Material. Application to a
TiO
2Mesoporous Film.
Y. S. Kim,a V. Balland,a B. Limogesa and C. Costentina*
Cyclic voltammetry is a particularly useful tool to characterize charge accumulation in conductive materials. A simple model is presented to evaluate proton transport effects on charge storage in conductive material associated to a redox process coupled with proton insertion in the bulk material from an aqueous buffered solution, a situation frequently encountered in metal oxide material. The interplay between proton transport inside and outside the material is described using a formulation of the problem through introduction of dimensionless variables that allows defining the minimum number of parameters governing the cyclic voltammetry response with consideration of a simple description of the system geometry. This approach is illustrated by analysis of proton insertion in a mesoporous TiO2 film.
INTRODUCTION
Charge storage in electrode materials is a great challenge in the context of powering portable electronics and the electrification of transportation sector.1 Depending on application requirements, two types of electrochemical capacitors have been considered.2 For high power density, supercapacitors, also referred to as electrochemical double-layer capacitors (EDLC) are used.3 EDLC are usually made of porous conductive material to achieve high surface area electrode material leading to an electrical double layer at the electrode-electrolyte interface characterized by a classic rectangular cyclic voltammogram, which plateau capacitive current is proportional to the scan rate. Alternatively, for high energy demanding applications, a different charge storage property is used: a redox reaction characterized by a standard potential occurs in bulk electrode material leading to redox peaks in cyclic voltammetry.4 A third category of charge storage material has been described as pseudocapacitors were reversible redox reactions are deemed to occur at or near the surface of an electrode material, but leading to EDLC-like electrochemical features such as quasi-rectangular cyclic voltammograms.5,6 Pseudocapacitive materials are mainly transition metal oxides such as RuO2,7 MnO28 or Nb2O5.9 Despite many studies,10-15 the intimate mechanism at work leading to EDLC-like electrochemical features, whereas redox reactions in principle characterized by a redox standard potential (and hence expected to lead to a peak wave in cyclic voltammetry) are evocated, is still unclear.16 Theoretical calculations on RuO2 indicate that the usual picture where electron-proton double-insertion leads to a valence change of the metal should be treated with caution due to the delocalized nature of the electronic states near the Fermi level.17 A recent formal analysis shows that pseudo-capacitors should be considered as actual capacitors.18 Besides their EDLC electrochemical features, most of pseudocapacitive metal oxides also exhibit peak waves in cyclic voltammetry which can be attributed to localized redox couples presumably at the surface and/or in the bulk material (Scheme 1).
Scheme 1. Sketch of a cyclic voltammogram for a pseudocapacitor showing both an EDLC response (red arrow, current proportional to scan rate) and an additional contribution of charge storage (blue arrows) through a redox couple with a defined apparent standard potential (E0ap).
Due to charge balance, valence change of the metal center has to be compensated by insertion or disinsertion of a counter ion in the bulk material which behaves as a metallic conductor. In aqueous electrolyte, the corresponding ion may typically be a proton and such a process of proton intercalation enhances charge storage19-21 as does Li+ intercalation in other conditions.9,22,23 Such behaviors have also been recently unraveled for electrodeposited phosphate cobalt oxide films electrocatalytically active for oxygen evolution reaction.24 Models describing ion intercalation processes associated to charge storage have been described in the literature focusing on (i) ion diffusion exclusively inside the material and (ii) phase transformation electrodes but (iii) without interference of diffusion outside the material.25-27 The purpose of the present contribution is to provide a framework for studying the effect of proton transport interplay inside and outside the material on the cyclic voltammetry response, considering that proton transport in aqueous electrolyte near the electrode surface is provided by buffer diffusion. The formulation of the problem through introduction of dimensionless variables will allow defining the minimum number of parameters that govern the cyclic voltammetry response considering a simple description of the system geometry. This approach will then be illustrated by analysis of proton insertion in a mesoporous TiO2 film.
potential curr ent E0 ap Pseudocapacitive current
2
RESULTS AND DISCUSSION
Model
We consider a conductive film of thickness df deposited on an
underlying chemically inert conductive electrode. A homogeneous distribution of immobile redox centers (volumic concentration 0
O C ) is assumed within the bulk film. Because the film is electronically conductive, we can consider a uniform potential in the bulk film and also assume that there is no potential drop at the film/underlying electrode interface. Neglecting ohmic drop in the solution, the potential drop at the film/solution interface is the electrode potential E imposed by the potentiostat vs. a reference electrode. Real films are usually porous, so that the accessible solid surface area Sa for proton insertion is larger than the geometric surface
area S. To take into account the film porosity in a simple way, we assume that constrained diffusion within the pores is negligible so that the porous film can be replaced by a flat film with an accessible surface Sa and thickness da, and wherein solid-state diffusion of
proton in the film is linear and finite, whereas diffusion outside the film is linear and semi-infinite but toward a surface area S (Scheme 2).
Scheme 2. Schematic representation of (left) the porous films and (right) the simplified modelling.
Surface enhancement due to film porosity can be evaluated from capacitive current measurement. A more refined model taking into account diffusion in the pores would require adaptation of the general physicochemical and physicomathematical model developed by Amatore.28 The accessible film thickness for proton diffusion in the bulk da is also not the actual film thickness df but
can be defined from conservation of the amount of immobile redox
centers (nO0): 0 0 0, O O O tot a a z f n C S d p C S d where
1
zp p z with p the porosity factor, i.e. the ratio of the void volume vs. the geometric volume Sdf and z a stoichiometric factor indicating the fraction of immobile redox centers able to be reduced, i.e. O0 / O0,
tot
zC C .
The aqueous electrolytic solution contains a buffer couple AH/A which components diffuse with the same diffusion coefficient Dext and the proton transfer in solution always remains at equilibrium. At the solution-film interface, proton insertion in the film occurs through a proton-coupled electron transfer process between three partners: an oxidized form (O) of the immobile redox centers at the interface, an electron,
free to move in the conductive bulk, and the weak acid AH in solution so as to finally produce a reduced species RH. Then proton transport within the bulk film is assumed to occur through a series of self-exchange proton-coupled electron transfers equivalent to a H-atom hopping process as depicted on Scheme 3. Covalent bond formation between H and the oxidized form of the immobile redox couple O acts as an electron trap as described in rutile TiO2 nanoparticles from theoretical calculations.29
Scheme 3. Schematic representation of proton transport.
As shown in the Supplementary Information (SI) this hopping process is equivalent to a diffusion process characterized by a derivative equation on RH or O concentrations valid for
0 x da, x being the distance from the film/solution interface toward the underlying electrode:
2 O O H 2 C C D t x and 2 RH RH H 2 C C D t x (1) H
D is then the apparent solid-state diffusion coefficient of proton inside the bulk material.
Outside the film (i.e. for x0), there is buffer and proton diffusion coupled with an equilibrated proton transfer:
AH k A H k
thus corresponding to three coupled diffusion-reaction differential equations: 2 AH AH AH,ext 2 A H AH C C D k C C k C t x (2) 2 A A AH 2 A ,ext A H C C D k C C k C t x (3) 2 H H AH 2 H ,ext A H C C D k C C k C t x (4)
where Di ext, is the diffusion coefficient of each subscript
species i in homogeneous solution, and
A H A AH AH 10 s pH A s C C C k K k C C , CAs
and CAHs being the
concentration of the buffer components in the bulk solution. Boundary conditions as well as initial conditions have to be defined to fully describe the system. At the film-solution interface (x0), proton-coupled electron transfer is described using Butler-Volmer kinetics assuming a concerted process, i.e.: df under ly ing el ec trode solution S AH solution da A-+ H+ Sa S AH A-+ H+ porous film
3
0 O H 0 O 0 AH 0 0 RH 0 A 0 exp exp S x x x x x F E E C D k x RT C C F E E C C RT (5)where E0 is the standard potential for the (O+AH)/(RH+A -) proton-coupled electron transfer couple, kS the standard rate constant (in mol/s/cm3) and the transfer coefficient assumed to be 0.5 in the following. At the film-underlying electrode interface (xda), there is no barrier for electron
flow but proton insertion within the underlying inert electrode is not possible leading to the boundary condition:
O 0 a x d C x
As for initial conditions, we consider that the electrode potential is positive enough so that the redox species in the film are fully
oxidized (
0O t 0 O
C C and
CRH
t00) and the AH and A-solution concentrations are uniform (
A 0 A s t C C and
AH AH 0 s t C C ). Finally, usual conditions of cyclic voltammetry
are used, i.e. linear scan vs. time of the potential from an initial value (Ei) to a final value (Ef ) at a sweep rate v and reverse
scan.
General expression of the current-potential equation
The current (noted i ) is evaluated as being proportional to the sum of all oxidized species in the film being reduced by unit of time:
O 0 a d x a C i dx FS t
(6)and the variation of oxidized species concentration at each position in the film (i.e.
O x
C
t ) is governed by the apparent
diffusion process described by eqn (1). Therefore, the general expression of the current-potential equation is obtained by solving the differential eqns (1) to (4) taking into account boundary conditions and current expression (6). This is
conveniently performed introducing a dimensionless
formulation of the problem as detailed in the SI with dimensionless time / t RT Fv , space ext / x y D RT Fv (here ext
D corresponds either to DAH,ext or DA ,ext , which both
were assumed equal), potential F
E E0
RT
and current
AHs ext / i
FSC D Fv RT
. It is shown that three dimensionless
parameters govern the current-potential response:
H / a d l D RT Fv , 0 O H ext AH a s C S D S D C and AH H / s S k C D Fv RT .
The parameter l compares two lengths, i.e. the accessible film thickness for proton diffusion in the bulk and the diffusion layer length of the diffusion-like proton transport, the latter being a decreasing function of the scan rate by means of its square root as expected for linear-like diffusion. depicts the competition between diffusion inside the film and diffusion outside the film. measures the kinetics of the proton-coupled electron transfer process at the film-solution interface compared to solid-state proton diffusion rate in the film. As shown in the SI, the general expression of current-potential is given by:
1
10
exp
exp a pH pK l l J I J I (7) where 0 1 I d
is the convolution integral and
1 0 1 tanh l J L d s l s
, where L1f s
represents the inverse Laplace transform of function f s
at value. Note that there is actually a fourth parameter, 10pHpKa, but it does not depend on any specific characteristic of the film and is fully determined by the experimentalist so that we do not consider it as a parameter in the following but just as a known constant.
This general equation can be solved numerically for any value of the three parameters (see the procedure detailed in the SI) to get the corresponding vs. cyclic voltammetry trace. However to be able to use this modelling for extracting kinetic information from experimental data (e.g., diffusion coefficient of proton inside the bulk material, standard rate constant for interfacial PCET, etc.) it is useful to discuss the various limiting situations and transitions between limiting behaviors in the form of a zone diagram.
Zone diagram and analysis of cyclic voltammetry responses Various limiting behaviors of the dependency of the - responses from the parameters may be reached for extreme values of the three above-defined dimensionless parameters. This would lead to a three dimension zone diagram. For the sake of simplicity and clarity we first consider a fast (Nernstian) interfacial PCET, i.e.
. We also consider the case where pHpKa, i.e
AH A
s s
C C . Eqn (7) then simplifies into:
Jl
1I
Jl
1I
exp
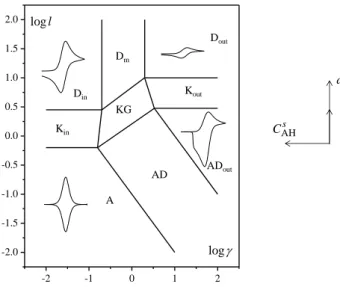
(8)The limiting behaviors obtained for extreme values of l and are represented under the form of a kinetic zone diagram as shown in Fig. 1.
4
Fig. 1. Kinetic zone diagram for . See text and Table 1 for description of the various zones. The shape of CVs corresponding to each zero-parameter zone is shown.
When l , the accessible film thickness for proton diffusion in the bulk is large relative to the diffusion layer length of the diffusion-like proton transport so that purely diffusive behaviors are obtained corresponding to the upper part of the zone diagram. We have JlI and therefore eqn (8) becomes
I
1I
I
1I
exp
. The cyclic voltammogram is controlled by diffusion of AH outside the film when (Dout zone). The peak current is then proportional to the acid form of the buffer; its expression obtained from numerical calculation of the above CV equation (see SI) isAH ext
0.419 s /
p
i FSC D Fv RT , with no information on proton transport in the film. Such an information could in principle be obtained from the wave position, the apparent standard potential (midpoint of the cathodic and anodic peak potentials) obtained from numerical calculation of the above CV equation being 0 0 0 O H ext AH 0.38 ln a ap s C S RT RT D E E F F C S D .
However, the standard potential E0 being usually unknown, the proton diffusion coefficient may not be obtained. Conversely, when 0, the cyclic voltammogram is controlled by the apparent diffusion of the proton inside the
film (Din zone) and the peak current is
0
O H
0.446 /
p a
i FS C D Fv RT . It is then independent from buffer concentration and the quantity S Ca O0 DH can be
easily evaluated. The wave position allows then estimation of the standard potential Eap0 E0. Passage from Dout zone to Din zone through the mixed diffusion Dm zone can be achieved by increasing the buffer concentration at a given pH and the corresponding evolution of the peak current is depicted in Fig. 2.
Fig. 2. Passage from Dout zone to Din zone. (left) Evolution of peak current
(dimensionless representation). (right) Simulated voltammograms for l and
0.1 (blue), 0.5 (red), 1 (green), 2 (orange), 5 (yellow), 10 (magenta).When l0 (lower part of the zone diagram), the accessible film thickness for proton diffusion in the bulk is small relative to diffusion layer length of the diffusion-like proton transport
so that 0 0 l J d l
and therefore eqn (8) becomes:
0 0 1 1 exp l d I d I
.Interference of buffer diffusion outside the film is governed by the parameter 0 O AHs ext / n l C S D RT Fv
comparing the total
amount of immobile redox centers able to be protonated to the available proton donor in the solution diffusion layer. If
0
l
(A zone), a reversible surface wave is obtained indicating a thermodynamic control (Nernstian control) of the electrochemical transformation of the redox centers up to complete saturation of the redox features of the material with protons. The peak current in this case is given by
0 O 4 p Fn Fv i RT .
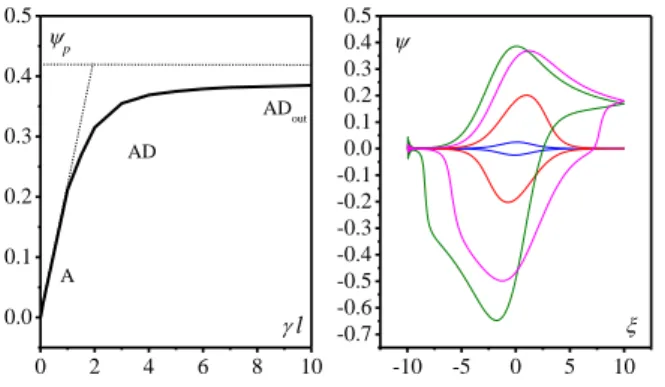
Upon increasing l , interference of buffer diffusion increases up to the point where the limiting behavior l is obtained (zone ADout), passing thus through the intermediate zone AD (Fig. 3). The limiting voltammogram in the ADout zone has the same forward peak as in the Dout zone but the reverse peak is different and its characteristics depend on the inversion potential. The peculiar shape of the reverse trace has already been discussed elsewhere.18
Integral equations and characteristics of the cyclic voltammograms of each limiting zone are summarized in Table 1. Note that the boundaries between zones have been obtained by maximizing the extend of the zero-parameter versus the one-parameter zones, and the latter versus the general two-parameter zone (KG), taking into account experimental uncertainty, i.e. 5% of the peak current. The effect of varying the experimental parameters on the location and movement of the point representing the system in the zone
-2 -1 0 1 2 -2.0 -1.5 -1.0 -0.5 0.0 0.5 1.0 1.5 2.0 KG log l log Din Dout Dm A ADout AD Kin Kout v a d AH s C 0 1 2 3 4 5 6 0.0 0.1 0.2 0.3 0.4 0.5 Dm Din p/ Dout -10 -5 0 5 10 -0.4 -0.3 -0.2 -0.1 0.0 0.1 0.2 0.3 0.4 0.5
5
Fig. 3. Passage from A zone to ADout zone. (left) Evolution of peak current.
(dimensionless representation). (right) Simulated voltammograms for l0 and l
0.1 (blue), 1 (red), 4 (magenta), 10 (green).
diagram is summarized, in direction and magnitude, by the arrows in Fig. 1.
Analysis of the interference of proton coupled electron transfer kinetics at the film-solution interface through variation of the
parameter AH H / s S k C D Fv RT
is now analyzed in the limiting case of
a film with large accessible film thickness for proton diffusion in the bulk ( l ). Still considering pHpKa, eqn (7) becomes:
1
1
exp
exp I I I I
(9)
Either for the outside buffer diffusion controlled domain ( ) or the inside material proton diffusion controlled domain (0), the effect of proton-coupled electron transfer kinetics is to transform a reversible wave when or (Din or Dout zone) to an irreversible wave when 0 or 0 (IRin or IRout zone) as shown in Fig. 4 and summarized in Table 2.
Fig. 4. Effect of PCET kinetics for l . Left: transition Dout zone to IRout
zone, 1000 (blue), 100 (red), 10 (green), 1 (magenta), 0.1 (yellow). Right: 0
transition Din zone to IRin zone, 10 (blue), 1 (red), 0.1 (green), 0.01
(magenta). 0.5.
Finally, the effect of interference of proton coupled electron transfer kinetics is described in the thin film limit (l0) with the following equation, still considering pHpKa:
0 0 exp 1 1 exp /l l d I d I
(10)Again, two limiting behaviors are encountered. Firstly, l where buffer diffusion is involved and the effect of proton-coupled electron transfer kinetics is to transform a reversible wave, when /
l (ADout zone), to an irreversible wave, when /
l0 (IRout zone). Secondly, l0 where there is no effect of buffer diffusion and the surface reversible wave corresponding to / l (A zone) is transformed into an irreversible wave when /l 0 (IRA zone) (Fig. 5 and Table 2).Fig. 5. Effect of PCET kinetics for l0. Left: l transition ADout zone to
IRout zone, / l 10 (blue), 1 (red), 0.1 (green), 0.01 (magenta). Right:
0 l
transition A zone to IRA zone, / l 10 (blue), 1 (red), 0.1 (green), 0.01
(magenta). 0.5.
Application to proton insertion in TiO2 mesoporous films As recalled in the introduction, some metal oxides exhibit EDLC electrochemical feature but also peak waves in cyclic voltammetry which are attributed to localized redox couples presumably at the surface and/or in the bulk material (Scheme 1). This has been recently shown to be the case for electrodeposited cobalt phosphate oxide thin films. The redox wave attributed to a CoIV/CoIII PCET couple has been shown to depend on solution buffer concentration as well as scan rate and total amount of deposited cobalt. Data have been thus analyzed in the framework of the present model but, at that time, purposely restricted to the thin film behavior (i.e. l0). Data have been notably fitted to the
working curve corresponding to variation of
0 Co AHs ext / n l C S D RT Fv
parameter, thus showing a first
application of the model allowing determination of the amount of redox species able to store extra charge in the porous material.24
0 2 4 6 8 10 0.0 0.1 0.2 0.3 0.4 0.5 A AD ADout l p -10 -5 0 5 10 -0.7 -0.6 -0.5 -0.4 -0.3 -0.2 -0.1 0.0 0.1 0.2 0.3 0.4 0.5 -20 -15 -10 -5 0 5 10 -0.4 -0.3 -0.2 -0.1 0.0 0.1 0.2 0.3 0.4 0.5 IRout Dout -10 -5 0 5 10 15 -0.4 -0.3 -0.2 -0.1 0.0 0.1 0.2 0.3 0.4 0.5 IRin Din -20 -15 -10 -5 0 5 10 -0.8 -0.6 -0.4 -0.2 0.0 0.2 0.4 ADout IR out -10 -5 0 5 10 -0.3 -0.2 -0.1 0.0 0.1 0.2 0.3 IRA A l
6
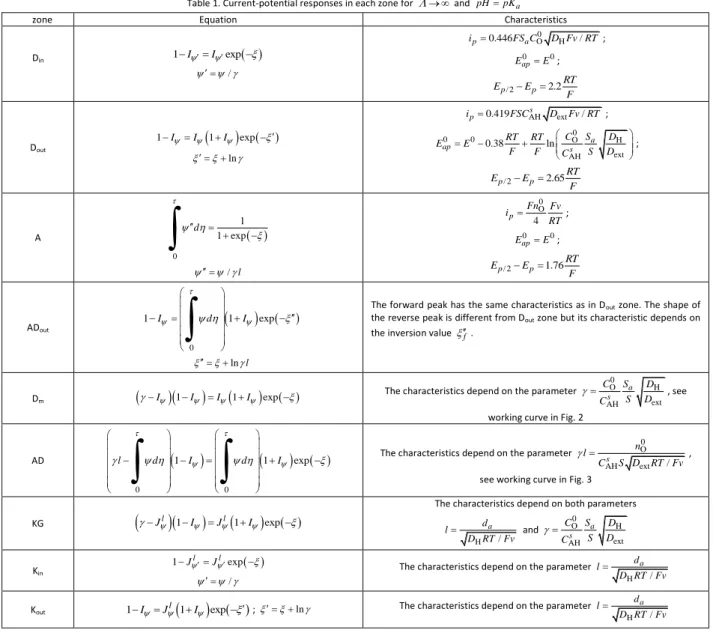
Table 1. Current-potential responses in each zone for and pHpKa
zone Equation Characteristics
Din 1IIexp / 0 O H 0.446 / p a i FS C D Fv RT; 0 0 ap E E ; / 2 2.2 p p RT E E F Dout
1II 1I exp ln AH ext 0.419 s / p i FSC D Fv RT ; 0 0 0 O H ext AH 0.38 ln a ap s C S D RT RT E E F F C S D ; / 2 2.65 p p RT E E F A 0 1 1 exp d
/ l 0 O 4 p Fn Fv i RT ; 0 0 ap E E ; / 2 1.76 p p RT E E F ADout
0 1 I d 1 I exp
ln l The forward peak has the same characteristics as in Dout zone. The shape of
the reverse peak is different from Dout zone but its characteristic depends on
the inversion value f.
Dm
I
1I
I
1I
exp The characteristics depend on the parameter
0 O H ext AH a s C S D S D C , see
working curve in Fig. 2
AD
0 0 1 1 exp l d I d I
The characteristics depend on the parameter
0 O AHs ext / n l C S D RT Fv ,
see working curve in Fig. 3
KG
Jl
1I
Jl
1I
exp The characteristics depend on both parameters
H / a d l D RT Fv and 0 O H ext AH a s C S D S D C Kin 1JlJlexp /
The characteristics depend on the parameter
H / a d l D RT Fv
Kout 1IJl
1I
exp ; ln The characteristics depend on the parameterH / a d l D RT Fv
Table 2. Current-potential responses in zero-parameter zone for irreversible cases and pHpKa
zone Equation Characteristics
IRin
1 exp I and ln
/
0 O H 0.496 / p a i FS C DFv RT 0 AH H 0.78 ln / s S p k C RT RT E E F F D Fv RT IRout
* * * 1 exp I * and *ln
/
AH ext 0.496 s / p i FSC D Fv RT 0 0 O ext 0.78 ln / S a p k C S RT RT E E F F D Fv RT S IRA
0 1 exp d
/ l and ln / l 0 O 0.368 p Fv i Fn RT 0 ln AH / s S p a k C RT E E F d Fv RT 7
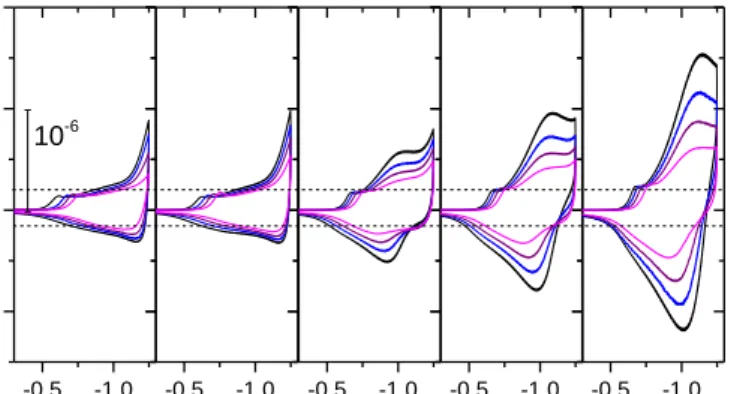
Fig. 6. Cyclic voltammograms recorded at a 1-µm-thick GLAD-TiO2 electrode in
water at pH = 7 and v = 0.05 (black), 0.1 (blue), 0.2 (violet) and 0.5 (magenta) V/s. From left to right CAHs [HepesH] = 0, 0.77, 19.2, 38.5 and 77 mM.
Horizontal axis: potentials in V vs. Ag/AgCl. Vertical axis: electron flux divided by scan rate (in mol/cm2/V). Horizontal dashed lines represent the EDLC capacitance contribution to the current. T = 298 K.
As a second application, we now consider data gathered on mesoporous nanocolumnar amorphous TiO2 films (df 1 µm)
obtained by Glancing Angle Deposition (GLAD) on an underlying flat ITO electrode as described in the SI and already preliminary discussed elsewhere.30 Upon scanning the potential of such a semiconductor electrode cathodically in neutral pH aqueous media, a transition from insulating to conductive behavior is observed.31 This transition is initially associated to a chemical capacitance charging corresponding to the storage of electrons in the conduction band of the semiconductive material until the semiconductive metal oxide is becoming fully degenerated once the applied potential reaches the conduction band potential.32 At potentials more negative than the conduction band potential, the TiO2 film behaves as a metallic conductive electrode and so the capacitive charging current becomes then dominated by the EDLC capacitance30 leading to a EDLC electrochemical feature as for metal oxide pseudocapacitors.18 This is indeed observed with the GLAD-TiO2 electrode when cyclic voltammograms are run in the absence of buffer or in the presence of a small buffer concentration (Fig. 6), the current due to the EDLC capacitance being proportional to scan rate as expected. Upon increasing the amount of buffer, a reversible redox wave appears in addition to the capacitive current as sketched in Scheme 1 and shown in Fig. 6.
Subtraction of the capacitive component of the current both on the cathodic and anodic scan allows a better characterization of these redox responses and of their variations with the buffer concentration. The reversible process may be assigned to titanium redox species involving TiIV/TiIII proton coupled couple with freely diffusing buffer components AH and A-:
IV III
2
Ti O + AH + e Ti O OH + A
At a given buffer concentration, the faradaic current component is proportional to the square root of the scan rate indicating a diffusing controlled process for both small and high buffer concentrations (Fig. 7). Besides, as already
described in a preliminary analysis of the same experimental data,30 whereas the cathodic peak current is proportional to the concentration of the acid form of the buffer (HepesH) at low buffer concentration, deviation from this proportionality is observed at higher buffer concentration (see Fig. 3 in reference 30).
These observations indicate that the investigated system stands in the upper part of the zone diagram shown in Fig. 1, navigating between Dout and Din zone as buffer concentration is increased, i.e. H 10 / a d l D RT Fv
at the slowest scan rate
(i.e. 0.05 V/s).
Fig. 7. Faradaic component of cyclic voltammograms recorded at a 1-µm-thick GLAD-TiO2 electrode in water at pH = 7 and v = 0.05 (black), 0.1 (blue), 0.2
(violet) and 0.5 (magenta) V/s. From left to right CAHs [HepesH] = 19.2, 38.5,
77, 154 and 662 mM. Horizontal axis: potentials in V vs. Ag/AgCl. Vertical axis:
iiC/FS v. iC is the capacitive component of the current obtained at
AHs
C [HepesH] = 0.77 mM. T = 298 K
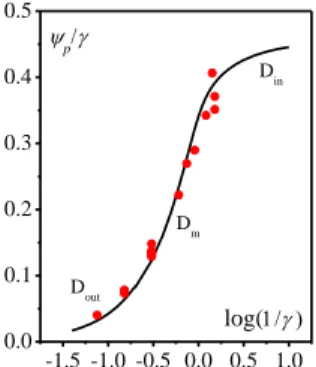
Although the peak separation and width are not canonical, we consider the limiting case because no obvious effect of scan rate is observed on peak separation, the non-canonical behavior being rather attributed to some standard potential distribution as in the case of cobalt phosphate oxide films.24 All experimental values of the faradaic cathodic peak current may thus be plotted as a function of log
selecting Dext1.5 ×10-6 cm2/s and 0IV H
Ti a
S C D 9.23 × 10⁻⁸ mol/s1/2 so that all data points fall onto the same p/ log 1/
theoretical curve (Fig. 8). These parameters are in agreement with those obtained from a preliminary analysis of the same experimental results.30 We emphasize that the present analysis allows for rigorously extracting information on the proton diffusion in the bulk material from the fit of the model to the experimental data deviation, leading thus from extrapolation to the limiting behavior corresponding to the diffusion limitation in solution. This approach is better than that previously done by us using an approximate estimate of the extrapolated limiting current in the Din zone, a limit that cannot actually be reached experimentally (Fig. 8).30 In other word, the present analysis allows for a full description of the transition from Dout to Din-0.5 -1.0 -0.5 -1.0 -0.5 -1.0 -0.5 -1.0 -0.5 -1.0 1mM 25 mM 50 mM 100 mM no buffer 10-6 -0.5 -1.0 -0.5 -1.0 -0.5 -1.0 -0.5 -1.0 -0.5 -1.0 8.0x10⁻⁷ 4.0x10⁻⁷ 0.0 -4.0x10⁻⁷ -8.0x10⁻⁷ 50 mM 860 mM E (V) 200 mM 100 mM 25 mM i/F Sv 1/ 2 (mol cm -2 V -1/ 2 s -1/ 2)
8
zone upon variation of buffer concentration (Fig. 1) and thus leads to a more accurate evaluation of 0IV HTi a
S C D (the
previously estimated value was 1.23 x 10⁻⁷ mol/s1/2). Taking
a
S 162 cm2 (estimated from BET for a geometric electrode
surface S of 0.3 cm2), and IV IV 0 0, Ti 0.5 Ti tot C C 0.024 mol/cm3 ( IV 0, Ti tot
C is the concentration of titanium ions in amorphous TiO2 and 0.5 the maximal mole fraction of protons that can be inserted in the fully reduced phase as estimated by analogy to that reported for Li+ in anatase),33 we obtain: DH5.6 × 10
-16
cm2/s, a value already discussed elsewhere.30 We note that the characteristic distance D RT FvH / is smaller than 0.2 nm (at the lowest scan rate 0.05 V/s) and thus the condition
H 10 / a d l D RT Fv
is fulfilled. Finally we observe that, as
expected from the theoretical analysis, the apparent standard potential of the reversible TiIV/TiIII proton coupled couple (Fig. 7) is shifting cathodically as buffer concentration is increased and the system passing from Dout zone to Din zone.
Fig. 8. Dimensionless cathodic faradaic peak current as a function of log . Red dots: experimental data p/ as function of log with Dext1.5 × 10-6
cm2/s and IV 0 H Ti a
S C D 9.23 × 10⁻⁸ mol/s1/2. Black line: theoretical curve
obtained for l and (as in Fig. 2 left but plotted differently).
Conclusions
A simple model has been presented to evaluate proton transport effects on charge storage in conductive material associated to a redox process coupled with proton insertion in the bulk material from an aqueous buffered solution, a situation frequently encountered in metal oxide material. It is shown that the cyclic voltammetric responses are governed by three dimensionless parameters: (i)
H / a d l D RT Fv which
compares two lengths, i.e. the accessible film thickness for proton diffusion in the bulk and the diffusion layer length of the diffusion-like proton transport; (ii)
0 O H ext AH a s C S D S D C
which depicts the competition between diffusion inside the
film and diffusion outside the film, and (iii) AH
H / s S k C D Fv RT
which measures the kinetics of the proton-coupled electron transfer process at the film-solution surface compared to proton diffusion rate in the film. Analytic expression of the current-potential response is given in each limiting situation allowing deciphering the parameters that can be obtained from experimental data. This procedure is illustrated through the analysis of a previously described behavior of proton insertion in a GLAD-TiO2 mesoporous films,30 allowing for an evaluation of the proton apparent diffusion coefficient in the bulk material.
Acknowledgements
Pr. Kenneth D. Harris (University of Alberta, Edmonton) is gratefully thanked for the gift of TiO2-GLAD electrodes.
Notes and references
1 P. Fairley, Nature 2015, 526, S102.
2 K. Naoi and P. Simon, Interface 2008, 32-37. 3 J. R. Miller and P. Simon, Science 2008, 321, 651. 4 Special issue on batteries Chem. Rev. 2014, 114, 11413.
5 B. Conway, Electrochemical Capacitors: Scientific
Fundamentals and Technology Applications, Kluwer Academic/Plenum Publishers, New-York (1999).
6 T. Brousse, D. Bélanger, and J. W. Long, J. Electrochem. Soc. 2015, 162, A5185.
7 S. Ardizzone, G. Fregonara and S. Trasatti, Electrochim. Acta 1990, 35, 263.
8 M. Toupin, T. Brousse and D. Bélanger, Chem. Mater. 2004, 16, 3184.
9 V. Augustyn, J. Come, M. A. Lowe, J. W. Kim, P-L. Taberna, S H. Tolbert, H D. Abruna, P. Simon and B. Dunn, Nat. Mat. 2013, 12, 518.
10 W. Dmoski, T. Egami, K. E. Swider-Lyons and D. R. Rolison, J.
Phys. Chem. B 2002, 106, 12677.
11 W. Sugimoto, H. Iwata, K. Yokoshima, Y. Murakami, and Y. Takasu, J. Phys. Chem. B 2005, 109, 7330.
12 N. Yoshida, Y. Yamada, S. Nishimura, Y. Oba, M. Ohmuna, and A. Yamada, J. Phys. Chem. C 2013, 117, 12003.
13 K. –W. Nam, M. G. Kim and K –B. Kim, J. Phys. Chem. C 2007, 111, 749.
14 J. –K. Chang, M. –T. Lee and W. –T.; Tsai, J. Power Sources. 2007, 166, 590.
15 O. Ghodbane, F. Ataherian, N-L. Wu and F. Favier, J. Power
Sources. 2012, 206, 454.
16 V. Augustyn, P. Simon and B. Dunn, Energy Environ. Sci. 2014, 7, 1597.
17 V. Ozolins, F. Zhou and M. Asta, Acc. Chem. Res. 2013, 46, 1084.
18 C. Costentin, T. P. Porter and J-M. Savéant, ACS Appl. Mater.
Interfaces 2017, 9, 8649.
19 F. Cao, G. Oskam, C. Searson, J. M. Stipkala, T. A. Heimer and G. Meyer, J. Phys. Chem. 1995, 99, 11974.
20 G. Boschloo and D. Fitzmaurice, J. Phys. Chem. B 1999, 103, 7860.
21 M. Zhu, W. Meng, Y. Huang, Y. Huang and C. Zhi, ACS Appl.
Mater. Interfaces 2014, 6, 18901.
22 H. Lindström, S. Södergren, A. Solbrand, H. Rensmo, J. Hjelm, A. Hagfeldt and S-E. Lindquist, J. Phys. Chem. B 1997, 101, 7717. -1.5 -1.0 -0.5 0.0 0.5 1.0 0.0 0.1 0.2 0.3 0.4 0.5 Din Dm Dout p log(
9
23 M. Opitz, J. Yue, B. Smarsly and R. Roling, Electrochim. Acta2015, 168, 125.
24 C. Costentin, P. T. Porter and J-M. Savéant, J. Am. Chem. Soc. 2016, 138, 5615.
25 S. Yu, E. E. Levin and V. A. Nikitina, Electrochim. Acta 2016, 190, 1087.
26 K. P. Ta and J. Newman, J. Electrochem. Soc. 1998, 145, 3860. 27 Y. Zhu and C. Wang, J. Phys. Chem. C 2011, 115, 823. 28 C. Amatore, Chem. Eur. J. 2008, 14, 5449.
29 J. Zhang, M. Steigerwald, L. Brus and R. A. Friesner, Nano
Lett. 2014, 14, 1785.
30 Y-S. Kim, S. Kriegel, K. D. Harris, C. Costentin, B. Limoges and V. Balland J. Phys. Chem. C 2017, 121, 10325.
31 I. Abayaev, A. Zaban, F. Fabregat-Santiago, J. Bisquert, Phys.
Stat. Sol (a) 2003, 196, R4.
32 C. Renault, L. Nicole, C. Sanchez, C. Costentin, V. Balland and B. Limoges, Phys. Chem. Chem. Phys. 2015, 17, 10592. 33 A. G. Dylla, G. Henkelman, K. J. Stevenson, Acc. Chem. Res.