Vale: How to improve its competitive advantage to export Iron Ore via the
Brazilian Maritime Terminal of Ponta da Madeira, through the enhancement of its
infrastructures and processes?
Picture: Aerial view of the Maritime Terminal of Ponta da Madeira. Vale 2015 1.
Bachelor Project submitted for the Bachelor of Science HES in Business Administration with a Major in International Management
Erisvelton TAVARES
Bachelor Project Advisor:
Dr. Nicolas DEPETRIS, HES Professor
Geneva, Aug 14th, 2015
Haute Ecole de Gestion de Genève (HEG-GE) International Business Administration Picture: Aerial view of the Ponta da Madeira Maritime Terminal, Vale 2005.1
Declaration
This Bachelor Project is submitted as part of the final examination requirements of the Geneva School of Business Administration, for obtaining the Bachelor of Science HES-SO in Business Administration, with major in International Management.
The student accepts the terms of the confidentiality agreement if one has been signed. The use of any conclusions or recommendations made in the Bachelor Project, with no prejudice to their value, engages neither the responsibility of the author, nor the adviser to the Bachelor Project, nor the jury members nor the HEG.
“I attest that I have personally accomplished this work without using any sources other than those cited in the bibliography. Furthermore, I have sent the final version of this document for analysis by the plagiarism detection software URKUND using the address supplied by my adviser”.
Geneva, Aug 14th, 2015
ii
Acknowledgements
This Bachelor Project was made possible through the support of many people who contributed to make it real. I want to thank first all my HEG gallant professors who helped to improve my knowledge and my career through their teachings.
I express my special thanks to my advisor, Dr. Nicolas Depetris, who humbly and patiently shared his precious time and outstanding knowledge and guided me to make this Bachelor Project come true. It was a tremendous experience for me to work with him. I thank Mr. Robert Piller, my Commodities Trading Major Professor, for his teachings that helped me to boost my knowledge in commodities and motivated me to work on the Commodities Trading field.
I express great appreciation to ANTAQ (Brazilian maritime authority), Brazilian Port of Itaqui authorities and specially Vale Operations and Management teams in Switzerland and Brazil (Rio and Maranhão), who contributed to this project through interviews, which gave me a unique opportunity to understand and get deeper on the Brazilian Ports System and in the Maritime Terminal of Ponta da Madeira.
I thank sincerely all my brave classmates and friends who patiently helped me to go through these years at HEG, supporting and helping me to make it real. I thank Wagner Pinheiro, my friend who manages finance processes and operations in Latin America for Google, who contributed with his expertise in Finance and Accounting to this project.
Finally, I express my eternal gratitude to my incredible family for their great support, patience and love, my beloved wife, my amazing and patient son and my dear mother, who contributed enormously to realize this dream to have an outstanding Bachelor Degree in a prestigious university to sum up with my working experience.
Executive Summary
This project aims to understand and propose improvements about the competitive advantage to export Iron Ore via the Vale’s Maritime Terminal Ponta da Madeiral (PDM) in the northeast of Brazil, through the enhancement of its infrastructures and processes. This is one of the world’s largest ports operated by Vale SA and accounts for 10% of the worlds Iron Ore cargo mevements. Vale is one of the largest mining company and one of the largest publicly traded companies in the world with market capitalization of around US$ 100 billion. It is the world’s largest producer of Iron Ore and pellets, key raw materials for steelmaking 2.
Over the last 70 years, it produced more than 5 billion metric tons of Iron Ore 3. In fact, Vale in doing some multibillionaires projects to increase its Iron Ore output export through the PDM port. China is the major Iron Ore market driver, because it consumes more than 60% of the market share. In 2014, because of China’s slowdown economy, the Iron Ore prices declined around 50% of its value. The last day of 2014, the Iron Ore price was US$ 68.80 ton 4. Vale break-even costs in 2015 lies between USD$ 37/ton and US$ 41/Ton 5.
Therefore, Vale needs to get competitive advantage to overcome its major’s competitors, BHP (Anglo-Australian) and Rio Tinto (British-Australian) which have lower break-even (US$ 31/Ton or 32/Ton CFR), so it can offer Iron Ore at a better price 6. We interviewed and collected data from reliable sources such as Vale Management and Operations teams in Brazil and Brazilian Maritime Government authorities. We analyzed the main issues in the PDM Port related to the export of Iron Ore, and proposed recommendations to the enhancement of its infrastructures and processes, so Vale Management can use it for decision-making.
In our findings, we realized that the port had ships cracking at least twice in the port, which affected its operations during this non-operating time. Moreover, Vale multibillionaires projects will increase its Iron Ore output that will choke the port capacity to export Iron Ore since it does not have yet appropriate infrastructure for this increase in supply. In addition, in our research we perceived that the port has issues with locals because of the port enhancement projects. We recommended the use of a Cargo Plan to avoid ships cracking, the construction of another Pier and 11 stockyards, the creation of Communities Councils to deal with locals involved in Vale projects. Last, we believe that the port could use its existent infrastructure to diversify its exports, increasing its agriculture commodities exports, since Iron Ore is not a renewable commodity.
iv
Methodology
This project methodology will include 3 phases.
Phase I, Context (Introduction, Chapters 1, 2 and 3). We provided a brief introduction of this research in order to furnish an overview of this work. We provided a literature review about the Iron Ore market in Chapter 1, describing the market in a macroeconomic and microeconomic view. Moreover, we made a brief presentation of Vale in Chapter 2, the Brazilian giant mining company. In addition, we explained the Brazilian Ports System in Chapter 3. The data for this phase was collected from Iron Ore specialists and specialized websites, top Vale Management and Operations teams in Brazil and Brazilian ports government authorities, through interviews and their websites.
Phase II, Analysis (Chapters 4). This phase consists of the study of the infrastructure and processes of the Maritime Terminal of Ponta da Madeira. We studied its concept, Iron Ore logistics infrastructure and processes of the Port of Ponta da Madeira known officially as Maritime Terminal of Ponta da Madeira in the Brazilian state of Maranhão, through official port agent’s officers (management level) and top Vale Operations port team interviews. Moreover, we will briefly present the world’s dry bulk port benchmark for the Iron Ore market that can help us to enhance the Maritime Terminal of Ponta da Madeira efficiency.
Phase III, Conclusion, Recommendations and Limitations. Based on the analysis of the Phases I and II, we spotted in the Conclusion the main issues on the port which slows down Vale and propose Recommendations for Vale management team decision makers based on our research. Last, we will explain in the Limitations, the main issues we had in our research and propose improvements.
Contents
Declaration ... i
Acknowledgements ... ii
Executive Summary ...iii
Methodology...iv
Contents ... v
List of Tables ...vii
List of Figures ...vii
Abbreviations ... x
INTRODUCTION ... 1
CHAPTER 1: IRON ORE ... 2
1.1 Characteristics ... 2
1.2 Quality Specifications ... 3
1.3 Freight: Bulk Carriers ... 3
1.4 The Iron Ore Industry... 5
1.5 Key Market Drivers ... 7
1.6 Key Market Players ... 9
1.7 Global Demand...10
1.8 The Iron Ore production in Brazil ...11
1.9 The Weight of Iron Ore for the Brazilian Trade Balance ...11
CHAPTER 2: VALE, BRAZIL’S MINING GIANT ...13
2.1 History ...13
2.2 Vale Today ...14
2.3 Vale Economies of Scale Strategy ...15
2.4 The Bunker Fuel Cost for Vale ...16
2.5 Valemax, the giant ship ...17
2.6 Operating Systems ...18
2.7 The Carajas Mine ...19
2.8 The Carajás Railroad - EFC...19
2.9 The Port of Tubarão ...20
CHAPTER 3: THE BRAZILIAN PORTS SYSTEM OUTLOOK ...22
3.1 Brazilian Ports ...22
3.2 Ports Hierarchy Structure ...23
3.3 Private Use Terminals (TUPs) ...24
vi
CHAPTER 4: VALE’S MARITIME TERMINAL OF PONTA DA MADEIRA ...28
4.1 The Complex of Itaqui ...28
4.2 The Port of Itaqui ...29
4.3 The TUP Alumar Consortium ...29
4.4 The TUP Ponta da Madeira (PDM Port): History and Overview ...30
4.5 Port Information ...31
4.6 The Iron Ore Production and Loading Process at PDM ...33
4.7 Future Projects ...34
4.8 Sustainable Aspects ...35
4.9 PDM Operational Issues ...36
4.10 Worlds Benchmark: Port of Port Hedland ...37
4.11 PDM Port SWOT Analysis ...39
CONCLUSION ...41
RECOMMENDATIONS ...43
LIMITATIONS ...49
APPENDICES...50
List of Tables
Table 1: PDM Port Piers Comparative Table: ...33
Table 2: PDM Port Environmental and Social Impacts Aspects Table: ...35
Table 3: Carajás Railroad Accidents ...36
Table 4: PDM Port Cargo movements types 2014 ...46
Table 5: PDM Port Pier V + 4 Stock Yards Return on Investment Calculation ...47
Table 6: Recommendations Summary ...48
List of Figures
Figure 1: Most of the Iron Ore mined ... 2Figure 2: Bulk Carrier Fleet types ... 4
Figure 3: Break-even cost position of major Iron Ore producers (US$/ Dry Ton, 62%) ... 6
Figure 4: Countries that export Iron Ore. Total Country Trade: US$ 126 Billion... 7
Figure 5: Countries that import Iron Ore. Total Country Trade: US$ 129 Billion... 8
Figure 6: Products exported by Brazil. Total Country Trade: US$ 247 Billion ...12
Figure 7: Vale’s Logo Before and After ...13
Figure 8: Vale Global Presence ...14
Figure 9: Vale Gross Revenues by market and product ...15
Figure 10: High correlation between Bunker Fuel VS Oil Prices ...17
Figure 11: Valemax Routes to Asia ...18
Figure 12: Vale, The Northeast System ...18
Figure 13: The Port of Tubarão ...20
Figure 14: Brazilian Ports Structure ...23
Figure 15: Ports Location of the Complex of Itaqui in the São Marcos Bay ...28
Figure 16: Overview of the Port of Itaqui with its berths and dimensions ...29
Figure 17: TUP Alumar ...30
Figure 18: Maritime Terminal of Ponta da Madeira Location ...30
Figure 19: PDM Piers Location ...31
Figure 20: PDM Pier I ...32
Figure 21: PDM Pier III (North and South Berths) ...32
Figure 22: PDM Pier IV South ...32
Figure 23: PDM Port Logistics and Operation Process ...33
Figure 24: Port of Port Hedland ...37
Figure 25: Port of Port Hedland Commodity Breakdown ...37
Figure 26: PDM SWOT Analysis ...39
Figure 27: Carajás mine output forecast for 2018 ...41
Figure 28: Communities Council Scheme ...43
Figure 29: PDM Port Iron Ore Loading Flowchart Recommendation ...44
Figure 30: PDM Port Pier V future installations location ...45
viii
Glossary
Backwardation: A situation in which the spot or cash price of a commodity is higher than the forward price.
Bunker Fuel: It is a derivative of crude oil. It is the gunk that is leftover after refineries have processed all the more valuable fuels from the crude source. It is thick and heavy and must be heated before it can be used in an engine.
CAGR: The compound annual growth rate (CAGR) is a useful measure of growth over multiple time periods. It can be thought of as the growth rate that gets you from the initial investment value to the ending investment value if you assume that the investment has been compounding over the time period. Source: investing Answers.
CAPEX (Capital Expenditure): These are funds used by a company to acquire or upgrade physical assets such as properties, industrial buildings or equipments.
CFR: The seller delivers the goods on board the vessel. The risk of loss or damage of the goods pass on board of the vessel. The Seller pays the costs to the port of destination. (Incoterms® 2010)
Commodities: Means merchandises like minerals (Iron Ore, Oil, gold), agricultures (soybeans, cattle, coffee), financials (foreign currencies, governments bonds) and environmental (Carbon credits) that are produced in large scale and traded worldwide. Commodities are traded in financial markets having its prices set globally by the international Market.
Contango: A situation where the futures price (or forward price) of a commodity is higher than the expected spot price.
DWT: Deadweight Tonnage refers to the carrying capacity of a vessel. Deadweight tonnage is calculated by taking the weight of a vessel not loaded with cargo and subtracting that figure from the weight of the loaded vessel.
FOB (Free On Board): This Incoterms means that the seller delivers the goods on board the vessel nominated by the buyer at the named port of shipment. The risk pass when the goods are on board the vessel. (Incoterms® 2010)
Granulated: Material between 0.6 and 5 centimeters in diameter that can be fed directly into the blast furnace.
Incoterms: The Incoterms rules explain a set of trade terms reflecting business-to-business practice in contract for the sale of goods.
Iron Ore Swap Contract: An Iron Ore Swap Contract is a cash-settled derivative, between a seller and a buyer of Iron Ore at a fixed price for a set amount of time that provides price certainty for both the buyer and the seller.
Pellet-feed: Iron Ore powder that passes through the agglomeration process to be converted into pellets.
Pellets: Pellets are small balls of Iron Ore used in the production of steel. It is made with technology that uses the powder that is generated during the ore extraction process, once considered waste. Source: Vale Website.
Sinter-feed: Finer particles than the granulated ones, up to 0.6 centimeters in diameter. Spot price: commodities contract terms agreed now but delivery and payment will occur
at a future date.
SOLAS regulation VII/7: It identifies Dangerous goods in solid form in bulk through
classification as dangerous goods by the International Maritime Dangerous Goods Code. For environmentally hazardous dry bulk materials, the classification is either: ENVIRONMENTALLY HAZARDOUS SUBSTANCE – SOLID N.O.S or "MARINE POLLUTANT" subsidiary risk (where material has other hazards). Source: International Maritime organization.
T/h: Ton per hour (means the speed).
Vetting Inspection: This is the process by which a charterer determines whether a vessel is suitable to be chartered, based on the information available to it. Ports, terminals, insurers and other maritime industry operators also vet ships to identify and manage risks (answers.com).
x
Abbreviations
Brazilian States: AP (Amapá), ES (Espírito Santo), MA (Maranhão), MG (Minas Gerais), PA (Pará) and RJ (Rio de Janeiro).
BT: Billion Metric Tons COGS: Cost of Goods Sold
CO2: Carbon dioxide (CO2) is the chief greenhouse gas that results from human activities and causes global warming and climate change.
MT: Million Metric Tons NOx: Nitrogen dioxide is an irritant gas, which at high concentrations causes inflammation of the airways.
Sox: Refers to all sulphur oxides, which is a colourless gas with a pungent, irritating odour and taste that can harm crops, trees, textiles, building materials, animals, and person’s respiratory system.
PDM: Ponta da Madeira Port (known oficially as Maritime Terminal of Ponta da Madeira) TUP: Private Use Terminal (From the Portuguese: Terminal de Uso privado)
INTRODUCTION
The aim of this study is to identify the main issues that can jeopardy the competitive advantage of the Maritime Terminal of Ponta da Madeira (PDM) to export Iron Ore. This is a private port in the northeast of Brazil, which belongs to Vale SA and therefore is responsible for the port operations and enhancements needed. The port accounts for one-tenth of the world’s Iron Ore cargo movements. It exports the world’s best Iron Ore quality.
We analyzed its infrastructures and process in order to propose recommendations so it can enhance its competitiveness compared to its main competitors in Australia. This study was made with the support from senior PDM operations team and high Vale Iron Ore executives as well as senior maritime authorities in Brazil.
This study researched not only the port physical facilities and its access issues but also the method it operates to load/export Iron Ore, since load/unload is usually a major issue in the ports. Moreover, the study analyzed the port layout and configuration in order to understand of possible measures to be taken to expand or diversify its operations and products handled since Iron Ore unlike steel, is not a renewable resource.
This port is well known for its excellent dredging capacity to operate large ships, being one of the few ports to operate the large dry bulk ships, which helps Vale to get competitive advantage to export large quantities of Iron to its consumers in Europe and far Asia.
The study searched for possible issues that may exist between the port and its main stakeholders, the local communities living in the port neighborhood and the locals from where is extracted the Iron Ore handled in the port. Moreover, it also searched for possible hazards and port capacity.
In addition, we produced three chapters of Literature Review in order to give to the reader a basic understanding of the importance of the Iron Ore market in Chapter 1, the Brazilian company Vale SA in Chapter 2 and how the Brazilian port system work in Chapter 3.
In our research, we found answers for the main stakeholder issues. On top of it, there were some serious problems in how the port operate its loading process, which caused damages in the past and affected the port productivity. Furthermore, there is a mandatory enhancement to the port facilities due to a large project of expansion of the Iron Ore supply. Additionally, we found a solution to diversify its activities, which can possibly help to drive the Iron Ore market price up and therefore increase the company profitability.
2
CHAPTER 1: IRON ORE
Source: Vale 7
1.1 Characteristics
The Eiffel Tower, skyscrapers, aircraft carriers, oil tankers, all these megastructures has one thing in common: Iron Ore in its structures, the key raw material to make Steel. Roughly, 98% of the global Iron Ore production is employed to produce steel 8. Steel is broadly used in construction and other applications because of its high tensile strengths and low cost.
Iron Ore and Steel together are the second largest commodity bloc by value after crude oil. These linked markets produce every year not less than 800 MT of Iron Ore and 1.1 BT of Steel 9, actually in 2014, global Iron Ore production was 2’201 MT and crude steel was 1’662 MT.
Figure 1: Most of the Iron Ore mined
Source: Rock Tumbling Hobby 10
Hematite and Magnetite are the most common rocks where Iron is found, having Hematite 70 percent Iron and magnetite 72 percent Iron of it. These are considered "high-grade" Iron Ores, since each has a high concentration of Iron. The PDM port exports high-grade Iron Ore coming from Vale mines. There are other types of rocks found with a lower grade or smaller concentration of Iron such as taconite, which has only up to 30 % and considered as waste for a long time but since high-grade decreases with consumption, it becomes an option 11.
Although Iron is dark and silver gray, its colors vary when it found in other rocks in mineral, being blue, yellow, pink, gray or black, and because of this characteristic it is used to color consumer products like plastics, paints, and cosmetic products as eye shadow 12. Iron Ore contributes to the environment, since Steel is on top among the most recycled materials or 60% of it becomes new steel 13.
1.2 Quality Specifications
Iron Ore is qualified by where it is produced and by how much ferrous it has, which is indicated by percentage. High grade are the Iron Ore, which has more than 60% of Iron and the Low grade that contain between 25% and 30% of Iron.
The low grade requires additional processing called beneficiation to improve the ore concentration and remove impurities, what increases costs of production. Crushing, milling, gravity or heavy media separation, screening, and silica froth flotation are some of techniques applied 14. In this process, the Fe content is improved to a maximum possible extent. The highest can be 70% i.e. purest form. As high, the concentration of Iron better is the quality. Typically, Iron Ore with 62% or higher are those with better quality.
1.3 Freight: Bulk Carriers
Bulk Carriers are vessels made to carry bulk solids such as cereals, coal, ore and cement. These vessels are more than a third of the world’s merchant fleet 15. There are “Major Bulks” or the biggest group, designed to carry Iron Ore and Coal and “Minor Bulks” designed to transport steel products, forest products, bauxite or alumina cement, and fertilizers 16.
Ship classes: According to volume, trade routes, ports limitations, a variety of classes of
4
Figure 2: Bulk Carrier Fleet types
Source: BUNGE. Mr. Alex SASS Presentation on Dry Bulk Freight at Commodity Trading Major 2015 in HEG 17.
The Handysize are small-sized ships with a capacity ranging between 15,000 and 35,000 DWT. It is used because of its versatility and maneuverability.
The Supramax are ships with capacity between 50,000 and 60,000 DWT. These ships offer cargo loading and unloading flexibility with onboard cranes 18.
The Panamax are ships with capacity between 60,000 and 79,999 DWT. They are used to carry coal, iron ore, grains, and to a lesser extent, minor bulks. These ships are capable of passing through the Panama Canal, which makes them more versatile than larger ships in terms of access to different trade routes 19.
Capesize are large-sized bulk carriers and tankers above 150,000 DWT. They are too big to pass through the Suez Canal or the Panama Canal. These ships are routinely used to carry coal, iron ore and commodity raw materials, that is why they are often called as bulk carriers instead of tankers 20.
There are the Very Large Ore Carriers (VLOC) carriers with capacity above 200,000 DWT. These ships are made to exploit economies of scale on long-haul Iron Ore routes 21.
Around 30% of total dry bulk shipments are Iron Ore. In 2013, 2 BT of Iron Ore were produced, being 1.2 BT of seaborne or US$ 170 Billion worth roughly 22. Along with coking coal, it is one of the main two ingredients employed to produce pig iron, which is used to produce steel.
1.4 The Iron Ore Industry
The global Iron Ore industry is very competitive. The key points affecting competition are price, quality and range of products offered, reliability, operating costs and shipping costs 23. The year 2014 was very tough for this industry due to the slowdown of the 70% seaborne consumer, China. The reduction of the Chinese economy speed led to a more than 50% drop in the Iron Ore prices, being the lowest level in 10 years 24.
The big players are taking advantage of economy of scale to squeeze small competitors and gain market share. Efficiency in reducing costs is crucial to survive in an environment, which already led some small players to bankruptcy filings.
On December 2013, Iron Ore price was US $135/Ton, and on April 2015 was US$ 51/Ton (Dry Metric Ton) or a 62% fall 25. The Deutsche Bank even forecasted a dark scenario where prices could hit US$ 40/ Ton before it begins to recover. Figure 4 shows the Australia’s main Iron Ore producers and Vale breakeven cost.
Competitive rivalry: High
BHP, Rio and Vale are amongst the world’s largest companies with strong liquidity that could pose a threat to any rival company. There are smaller players like Fortescue that are better located to China like the other Australian competitors. However, Vale has a better product with higher Iron Ore content that is better for China for processing steel. Location and Quality plays a role in the competitive rivalry, since both can represent a cost reduction for consumers, notably China.
6
Figure 3: Break-even cost position of major Iron Ore producers (US$/ Dry Ton, 62%)
Source: UBS Australia. Retrieved from The Australian Business Review 26.
Supplier power: Low
Labor and Energy are the major suppliers of the Iron Ore industry and do not exert a too much power on it compared to the other industries. However, Labor Unions can be an issue for them in case of strike.
Threat of substitutes: Low
Although Aluminum, the most found mineral on earth, being a substitute at certain places instead of steel, it is not a threat to steel because of the robustness of the Steel. Since Iron Ore is key for the production of Steel, it might last for a long period except a new technology shows up.
Buyer power: High
Although Buyers are dispersed and did not have much power on prices in the past, recently due to oversupply, the scenario changed and Chinese steel makers are exerting pressure on Iron Ore producers.
Barriers to entry: High
The Iron Ore industry is characterized for big numbers in CAPEX, meaning high investments, such as long railroads, trains, huge trucks, buildings, vehicles, heavy earthmoving equipment, ports, expertise and legal permissions as barriers, meaning those who want to adventure in this must have high leverage 27.
1.5 Key Market Drivers
The Iron Ore industry has three countries who are major drivers in this market, notably Australia and Brazil on the Supply side and China, holding more than 60% of the market share on the Demand side. The recent more than 50% drop in the Iron Ore prices let the Iron Ore market to a backwardation price curve, and added a new driver in the market, India, which can help the market prices to come back to a contango prices curve for the benefit of the producers. Global Iron Ore production in 2014 was 2’201 MT and Imports accounted 1’404 MT in the same period. Chinese alone imported 930 MT last year 28.
There are many countries capable to exploit Iron Ore but their percentage fine content and costs to produce are not profitable, having Brazil and Australia the lowest cost to produce and great quality material unlike China, which has the highest reserves but not good product quality (See Appendix 1).
SUPPLY SIDE
Figure 4: Countries that export Iron Ore. Total Country Trade: US$ 126 Billion
Source: The Observatory of Economic Complexity 29.
Australia
Iron Ore accounts for 21% of Australia’s total exports and around 4% of its GDP 30. Australia earned US$ 75 billion in Iron Ore exports in 2014, having employed more than sixty thousand Australian employees in the Iron Ore industry. It is the second largest Iron Ore producer after China and it is the largest exporter accounting to 30% of global production 31. The country produced 660 MT of Iron Ore in 2014 accounting to roughly 20% of global Iron Ore output, an 8.4% increase compared to 2013 32 (See Appendix 2).
8
Australia has 35 BT of Iron Ore reserves being 17 BT of Iron what makes it to have the largest Iron Ore reserves. Its main reserves or 95% of it are concentrated in Western Australia at Pibara region where its main companies Rio Tinto, BHP and Fortescue are located 33.
Brazil
Brazil exported 320 MT of Iron Ore in 2014 or 0.95% growth compared to the previous year. It is the second largest Iron Ore producer but the first in terms of Iron Ore content and host the largest Iron Ore company producer, Vale SA 34. The country has the Iron Ore content quality its main advantage over the other countries as product differentiation, having High Iron content and low silica 35 (See Appendix 3).
DEMAND SIDE
Figure 5: Countries that import Iron Ore. Total Country Trade: US$ 129 Billion
Source: The Observatory of Economic Complexity 36.
China
China drives the Iron Ore demand, accounting for more than 60% of seaborne in 2013. Due to slowdown of its economy where it had more than 14% GDP growth in 2007 37 to 7,4% GDP growth in 2014 (7,7% in 2013) 38, and is forecasted by specialists to slow even further in the coming years. In China, real estate, infrastructure, and machinery, account for more than 80% of total steel demand. These sectors have no good prospects for the coming years, particularly real estate and infrastructure (See Appendix 4).
India
In 2010, India had 8 BT of Iron Ore reserves, being one of the world’s largest reserves. (Source: IBM). In 2013 its production decreased by 19,5% (136 MT) compared to 2012 (169 MT). The peak production was 2010 when it reached 207 MT (See Appendix 5).
India can be a substitute for a former voracious China Iron Ore consumer. According to the India steel ministry, the government mining company National Mineral Development Corp will increase output to more than 75 MT/ year by the 2018-2019 until it produce 100 MT/ year by 2020-2021, which is the goal. The ultimate goal is to produce 500 MT/ Year of Iron Ore so it can produce 300 MT/Year of steel by 2025 39.
1.6 Key Market Players
“…I’m very conscious of the fact that Rio and BHP are Australia’s biggest corporate taxpayers… I want them to continue making a lot of profits here in Australia.”
Tony Abbott MP - Prime Minister of Australia 40
A situation in which a particular market is controlled by a small group of firms is called Oligopoly, what indeed may be the case of the Iron Ore industry, where three companies control the market, although there are many players. Rio Tinto, BHP and VALE, known as "The Big Three", which mined 44% of the total Iron Ore production last year, or 1,929 MT. Vale, the world's number one producer, mined 320 MT last year. Rio Tinto and BHP Billiton mined 295 MT and 225 MT respectively. These companies have the Supply Power to decide whether the Iron ore price will go on a Contango or Backwardation situation.
Rio Tinto
A British-Australian multinational metals and mining corporation with headquarters in London, United Kingdom. It is the second largest Iron Ore miner and has the lowest production cost in the industry or US$ 19.5/ Ton.
Despite the market volatility in Iron Ore, the company managed to increase Net Earnings by incredible 78% to US$ 6.5 billion compared to a year ago (US$ 3.6 Billion). Company's management adheres to the economy of scales strategy of lower prices and higher volumes, which allows them to gain market share from small producers 41.
10
Vale
The Brazilian giant mining company is one of the largest logistics operators in Brazil and the world largest Iron Ore producer. Likewise, Vale is adapting to tough times in the Iron Ore market. It is equally using of its strong CAPEX to do economies of scales to smashes small producers. Although its production output increased in 2014 (332.4 MT) compared to 2013 (310.7 MT), its Net Income in 2014 was US$ 353 Million or a 13% drop compared to 2013 (US$ 406 Million) which is understandable due to the constant drop in the Iron Ore prices its main product. Iron Ore in 2014 accounted to 51.4% of its operating revenues (US$ 37.5 Million) (Source: Annual Report 2014) 42.
Vale had an adjusted EBITDA of US$ 13.353 billion in 2014, a 40.8% drop from the US$ 22.560 billion achieved in 2013, mainly due to lower commodity prices which negatively impacted adjusted EBITDA by US$ 10.580 billion in 2014. COGS amounted to US$ 25.064 billion in 2014, an increase of US$ 819 million compared to the US$ 24.245 billion in 2013, what could be a result of higher volumes as the company argue 43. Besides Iron Ore, other major business segments include base metals (21.8%), fertilizers (6.7%) and other minerals (18%) 44.
BHP
Anglo-Australian mining, metals and petroleum company headquartered in Melbourne, Australia. One of the world’s largest producers of major commodities, including aluminium, coal, copper, Iron Ore, manganese, nickel, silver and uranium, and have substantial interests in oil and gas. For 2015, BHP will continue with its strategy for Iron Ore on producing at the lowest possible cost with Western Australia Iron Ore unit costs now below US$ 20/Ton. Total Iron Ore production for the nine months ended March 2015 increased by 17 % to a record 172 MT. Production for the 2015 financial year is now expected to be 230 MT, 2% higher than prior guidance. Western Australia Iron Ore (WAIO) production increased by 16% to a record 188 MT (100% basis) underpinned by continued improvements in integrated supply chain 45 (See Appendix 6).
1.7 Global Demand
Although Iron Ore prices were for long months in backwardation, a recent switch to contango suggest that the market is gaining a new breath. The demand for Iron Ore and Steel will keep going globally and China is expected to consume 1 BT/Year by 2030 46.
China and India large populations constant growing will demand high quality Iron Ore to make Steel to create infrastructure to respond to their needs. The rest of Asia is also continuing to urbanize and industrialize, and will emerge as fast growing regions, meaning demand for steel, and thus Iron Ore, will continue for the next decades and urbanization and industrialization will drive it 47 (See Appendix 7).
1.8 The Iron Ore production in Brazil
Brazil produces Iron Ore in open mines 48. It has 13,6% of the 170 BT world’s Iron Ore reserves. The country Iron Ore fine is the best with a 49% Fe Iron content average. The main Brazilian states Iron Ore reserves holders are: MG (72,5% of its reserves and Iron Ore fine 46,3% Fe content average), MT (13,1% Brazilian reserves and 55,3% Fe content average) and PA (10,7% Brazilian reserves and 64,8% Fe content average, a very good Iron Ore quality) where Vale has its main projects.
In 2013, the Brazilian Iron Ore production was 386, 3 MT with 63,6% Fe content average. It was a 3,6% decrease related to the previous year due to the weather conditions in the regions North and Southeast and due to delay in the environmental permission to exploit new section in some mines from Vale, which made impossible to operate in its full capacity. The production value was US$ 18,7 Billion worth or 14,3% increase compared to the previous year, corresponding to 59,3% of the Brazilian mineral production value.
This was the production in 2013 by states: MG (68,8%), PA (27,3%), MS (2,0%) and AP (1,6%). The main companies producers were: VALE S/A (MG, MS e PA), Samarco Mineração S/A (50,0% VALE) (MG), Companhia Siderúrgica Nacional-CSN (MG), Mineração Usiminas (MG), Itaminas Comércio de Minérios (MG), MMX Sudeste Mineração (MG) and Anglo Ferrous Amapá Mineração (AP) which together accounted for 89,9% of the production 49.
1.9 The Weight of Iron Ore for the Brazilian Trade Balance
In the last years, the results of the Brazilian Trade balance only worsened. In 2011, there was a surplus of US$ 30 Billion, but in 2012, this figure decreased to US$ 19 Billion. In 2013, Brazil had a modest surplus, but in 2014, it was not possible, having a more than US$ 4 Billion deficit because of the drop in the commodities prices, which Brazil is highly dependent on its commodities. The mining industry accounted for 1.1% of GDP and approximately 1% of employment in 2013, but when we talk about the Trade Balance its significance is much more important 50 (See Appendix 8).
12
Although Mining was the second main Brazilian segment exported in 2014 accounting to 12,6% or US$ 28,4 Billion of the Brazilian Trade Balance and Soybeans & products was the first accounting 14% or US$ 31.4 Billion, these positions change often based on their prices. Iron Ore is the main product Brazil exports accounting to 13.25% of its exports, and the main product moved in its ports in 2013, being 7,4 times bigger than Soybeans 51 and Vale has roughly 80% share in the Brazilian Iron Ore exports 52.
Despite the fact that Brazil has exported 15 MT more of Iron Ore in 2014, the world’s price dropped more than 50% what contributed to the drop of the Trade Balance and the loss position in the country export rank. If the Iron Ore prices applied in 2014 were the same as 2013, Brazil would have a US$ 8 Billion surplus 53.
Figure 6: Products exported by Brazil. Total Country Trade: US$ 247 Billion
CHAPTER 2: VALE, BRAZIL’S MINING GIANT
MISSION: To transform natural resources into prosperity and sustainable development.
VISION: To be the number one global natural resources company in creating long term value, through excellence and passion for people and the planet. 55
2.1 History
In the seventy decade, Vale became one of the largest mining company, position that holds until these days. On May 6, 1997, when Vale produced 114 MT of Iron Ore, had US$ 350 Million as Net Income, 11 thousand employees and was US$ 10,5 Billion worth, it was privatized by a group which acquired 41, 7% shares for US$ 3,338 Billion, investment returned after one year for them. In 2003, Vale was US$ 100 Billion worth, meaning its sale was below its real Market value 56. In 2014, Vale had US$ 657 Million as Net Income, 76,5 thousand employees and was US$ 40,5 Billion worth. It has the wonderful city of Rio de Janeiro as its headquarter 57.
In 2007, it spent $19.4 billion on Inco, a Canadian nickel producer 58 and in the same year “Vale do Rio Doce” changed its logo and name to “Vale SA” as a positioning strategy answering to international market.
Source: B9 website59
In 70 years of operations, Vale produced 5 BT of Iron Ore, this is equivalent to 375.000 Eiffel Towers 60. The Brazilian government holds direct and indirect shares and is the main shareholder with its 12% golden (preferential) shares what gives veto powers over changing Vale’s headquarters location and corporate purposes 61.
Before After
14
2.2 Vale Today
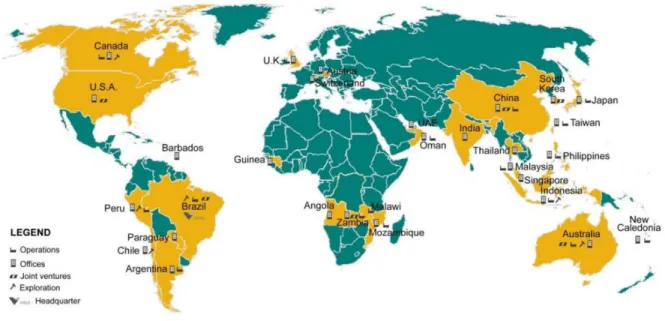
Figure 8: Vale Global Presence
Source: Vale 62
Nowadays, besides Iron Ore, Vale produces and sells pellets, manganese, alloys, gold, nickel, copper, kaolin, bauxite, alumina, aluminum, and potash 63. It is one of the three largest mining company along with BHP and Rio Tinto and it is present in the five continents and has in Rio de Janeiro its headquarters. It is not only the largest Iron Ore producer but also the largest nickel producer. Essentially it is a logistic company since it depends of its logistics efficiency to compete against its main competitors (BHP and Rio Tinto) since they are closer to the main market, Asia, notably China. Vale has 10,000 kilometers (6,200 miles) of railroad tracks, this is or more than the distance between Geneva and Rio de Janeiro according to Google Maps (9,141 km) and uses the world’s biggest ore carriers and ships. Moreover, it has eleven ports (See Appendix 9) and a large fleet of ships 64.
Figure 9: Vale Gross Revenues by market and product
Source: Vale 65
Vale has in Asia (47%) its main market. The drop in the Iron Ore prices and the world’s economies slowdown as a whole let Vale to have bad performance compared to the previous years, which is understandable since it is a market trend. However, while BHP managed to decrease its COGS by 0,25% between 2013 and 2014, and Rio Tinto improved its COGS decreasing by 6,08% on the same period, Vale went on the opposite way and increased its COGS by 12,52% on the same period. Apparently, it suggests that Vale is not doing its homework to reduce costs in order to get competitive advantage over its Australian competitors.
Although Vale managed to increase its Net Income by incredible 729,5% between 2013 and 2014, what could be a reduction in income tax from US$ 15,2 Billion to US$ 2,6 Billion, but in terms of absolute value (US$ 954 Million) its bottom line was modest compared to BHP (US$ 13,8 Billion) and Rio Tinto (US$ 6,5 Billion).
2.3 Vale Economies of Scale Strategy
In the commodities industry, a decrease in demand suggest the market to decrease supply, which helps partially since prices goes higher in this scenario and can benefit producers. However, the mining industry apparently skipped this basic economics lesson, since they are oversupplying the Iron Ore market with Iron Ore production records. The aim of their strategy is to gain market share, smashing small Iron Ore suppliers. Vale is not different, since it is increasing its production over the years despite the slowdown economic growth of China where its GDP growth is expected to slow to 6.8% and 6.3% in 2015 and 2016 respectively, from 7.4% in 2014.
16
In the period between 2013 and 2014 it increased its production by 7% roughly, while the Iron Ore prices decreased by more than 50%. The negative aspect of its strategy is that it is not selling its 7% increase in production volume since Iron Ore shipments increased modest 3% in 2014 66.
2.4 The Bunker Fuel Cost for Vale
Compared to its Australian competitors, Vale has a large disadvantage, which is its geographic location since China is closer to Australia compared to Brazil. This geographical situation places Vale upper on the Iron Ore cost curve compared to its main competitors and requires strong logistics efficiency.
Vale’s Iron Ore exports is seaborne, and for a ship, the fuel can represent between 50% and 70% of the total costs of owning and operating a ship 67. The recent drop in the oil prices on the last six months brought some relief for Vale because bunker fuel, a derivative of crude oil, is used to power the ships engines. Last year used to be US$ 21/Ton to carry Iron Ore from Brazil to China (compared to US$ 9–US$ 11 from Australia to China) and now lays on US$ 10/Ton, being a US$ 11/Ton decrease for Vale and only US$ 4/Ton decrease for the Australians Iron Ore producers. The freight costs difference between Vale and BHP and RIO now is only US$ 4 to US$ 5/Ton compared to more than US$ 10/Ton last year 68.
If embargo on Iran is successful lifted, Vale can benefit even more with the drop of oil prices since Iran holds 30 million barrels 69 and is expected to throw it on the market puling the prices to less than US$ 40/barrel 70.
Figure 10: High correlation between Bunker Fuel VS Oil Prices
Bunker fuel: Heavy Fuel Oil (Rotterdam) - Prices in US dollars per ton - FOB - 1% of sulfur. Crude Oil (petroleum), is a simple average of three spot prices; Dated Brent, West Texas Intermediate, and the Dubai Fateh, US Dollars per Barrel. Sources: National Institute of Statistics and Economics, and Index Mundi 71.
2.5 Valemax, the giant ship
Picture: Valemax. Vale 2015 72.
Valemax is the world’s largest ore carriers capable of carrying 400,000 Metric Ton each, being 2.3 times bigger than Capesize ships and its environmental friendly because it emits 35% less CO2 per ton of ore transported. Valemax helped Vale to benefit with the recent drop in the Oil prices reducing its transportation costs of moving Iron Ore from Brazil to China, enhancing competitiveness against its Australian counterparties 73. In 25 years of operations Valemax helped to reduce: 21,000,000 MT of CO2, 520,000 MT of NOx, 350, 000 MT of Sox, Environmental risk: (avoiding around 250 Capesizes calling at Brazilian and Chinese ports).
0 100 200 300 400 500 600 700 800 Year 2015 2015 2015 2015 2015 2014 2014 2014 2014 2014 2014 2014 2014 2014 2014 2014 2014 Month May Apr Mar Feb Jan Dec Nov Oct Sep Aug Jul Jun May Apr Mar Feb Jan
Bunker Fuel (Rotterdam) Oil VS Crude Oil Prices
Bunker Crude
18
Specifications: 400,000 DWT, 30m depth of hull, 23m loaded draft, 65m breadth, 362
length (Valemax standing on its bow would be 38 meters taller than the Eiffel Tower), 15 knots speed, 95 MT/Day Fuel oil consumption 74.
Figure 11: Valemax Routes to Asia
Source: Vale 75
Valemax ships dock at ten ports, plus two floating Vale stations in the Philippines. It takes 15 days to reach Europe, its closest destination and 35 days from the Maritime Terminal of Ponta da Madeira to reach its longest and main destinations in Asia 76 while the Australians competitors take 15 days to reach Asia.
2.6 Operating Systems
Vale operates four systems in Brazil where it produces and distributes Iron Ore: Northeast, Southeast, South and Southwest. The Northeast and the Southeast systems are totally connected, being mines, railroads and ports. Altogether, makes 22 Iron Ore mines and 11 pelletizing plants. The Northeast System is the main production system vale operates in volume and growth expectation. It links the Carajás mine to the Maritime Terminal of Ponta da Madeira through the Carajás Railroad (See Appendix 10). The Northeast System is composed of:
Figure 12: Vale, The Northeast System
Source: Vale 77
Carajás
Mine
Carajás
Railroad
TUP Ponta
da Madeira
2.7 The Carajas Mine
The Carajás open pit operations mine owned by Vale is the largest Iron Ore mine with 7.2 BT, located in the state of Pará, in North region of Brazil. In 2013, Vale produced 104.88 MT of Iron Ore in this mine, a 1.8% decrease compared to the previous year 78. The Iron content is the world’s highest quality having 67% pure Iron Ore or Fe near the surface that reduces COGS with beneficiation, comparing with BHP and Rio Tinto Pilbara operations where Iron Ore is produced with 62%–63% Fe content 79.
Carajás Serra Sul S11D is a US$ 19,67 Billion licensed project of expansion of Carajás that is on ongoing process and will generate 2’600 jobs on operating phase and 30’000 jobs on peak of the construction and US$ 44,59 Billion in logistics infrastructure 80 . It has It has 2.78 BT of Iron Ore reserves 81. This project will increase the mine capacity to 90 MT/ Year by 2017 and to 230 MT/ Year to 2019 82. The Iron Ore cost per Ton (FOB), for producing from the S11D deposit is expected to be US$ 15/Ton 83. (See Appendix 11).
2.8 The Carajás Railroad - EFC
The engineering studies to build the Carajás railroad dates to 1974 and after 8 years the first 15 Km were set, starting officially on February 28, 1985. The railroad that connects the largest open mine in the world has 892 Km extension, 36 crossing yards and 62 bridges. It connects the mine with the Maritime Terminal of Ponta da Madeira. The railroad not only transports 120 MT of Iron Ore but also 350,000 people living in remote areas of Brazil.
According to Vale, this railroad has over 16,000 cars and 276 engines (the train has 3,450 m length and one driver), being 35 compositions circulating on the tracks simultaneously, including one with 330 cars and measuring 3.3 kilometers in length, being among the world's longest train in regular operation.
The Carajás Railroad has lots of technology such as simulators and will have once doubled, Track Switch Devices (TSD), which allow trains to cross from one track to another without speed restrictions, what makes it the most efficient railroad in Brazil, according to the Logistics and Supply Chain Institute published in 2012. It has 40 Km/h as average speed, thanks to its 73% straight line route and only 27% curves what can reduce speed. There are plans to double track 559 Km of tracks, connecting 54 maneuvering yards making it even more efficient 84.
20
2.9 The Port of Tubarão
Figure 13: The Port of Tubarão
Source: Vale 2015 85.
The Porto of Tubarão or Maritime Terminal of Tubarão (TUP), one of the benchmarks for Vale along with the Ponta da Madeira Port, started its operations on April 1, 1966. It was drew to receive large ships smaller than capesize what was unusual for the ports since that time supramax were the largest vessels. According to the University of São Paulo (USP), the Port of Tubarão was “The most Efficient Dry Bulk Loading Port” in 2009 compared to other nine dry bulk ports. The port is 35% more efficient than the Australian and Norwegian dry bulk ports 86. The Port of Tubarão is one of the main ports Vale has along with the port of Ponta da Madeira. According to Vale, this port handles roughly 100 MT/ Year of Iron Ore, but in 2014 it handled 109.808.864, being that 92,4% was Iron Ore 87.
It is located on the north margin of Vitória Bay, in the city of Vitória, Estate of Espírito Santo close to the public Port of Vitória in the Brazilian state of Espírito Santo, this port covers 18 square kilometers, connected through motorway and railway systems and consists of four maritime terminals: Iron Ore, Praia Mole, Diverse Products and Bulk Liquids. The port handles Iron Ore and pellets, coal, grains, fertilizers and bulk liquids 88. The port enjoys of tropical weather, humid (80%-90%) and saline and has its rain season starting on October to April.
Operational Restriction to the Ships:
Deadweight 405.000 MT Maximum Length 365 meters Maximum Breadth 66 meters
Maximum Depth: 22,30 plus tide, limited to 23 meters
The port has 3 mining docks
South Dock 1 with 390m and 1 Berth with 14,5m North Dock 1 with 390m and 1 Berth with 15,2m Dock 2 with 400m with 1 Berth with 20m length
Moreover, it has a grain dock, called Dock 3 with 300m length and I Berth with 14,7 and 1 dock for general cargo and fertilizers called Dock 4 with 240m length and 1 Berth with 11,35m 89.
22
CHAPTER 3: THE BRAZILIAN PORTS SYSTEM OUTLOOK
“The history of the nations is written with the work from their children’s, the richness of their soil and with the movements of their ports”. (Sérgio Matte) 90
3.1 Brazilian Ports
Brazil has 8’511 Km of seashore, in its 8’514.876 Km² of area 91,which gives to it a natural and close relation with the ocean. In fact, in 2012, the Brazilian Foreign Trade was US$ 466 Billion worth, moving 688 MT of cargo and 80% (or US$ 371 Billion) of it was made via maritime and 90% was export cargo 92.
The Brazilian Ports System is “The Land Lord type”, existent in the majority of the countries. It is defined as the infrastructure belongs to the Brazilian government, which gives power to exploit by the private sector. There are two types of ports in Brazil: The Public Ports and the Private Use Terminals (TUP from the Portuguese). In the case of the TUP’s, it is given 25 years authorization to exploit by the ANTAQ (maritime authority).
Although Brazil is very competitive in producing commodities ranked number one in many commodities such as coffee and cattle, its logistics is far from ideal and the situation at its ports are not different. Therefore the ports are more than important to Brazil growth in order to export its commodities, it is essential. The main issues Brazil has with its ports are poor dredging in the ships access, roads ports access, trains and trucks bottlenecks and bad governance 93.
According to ANTAQ, Brazil handles close to 1 BT of cargos every year in its ports and Iron Ore is the main product 94. The Brazilian ports system is composed of 34 Public Ports (Waterways and Maritime) and 128 TUP’s. The system as a whole allowed for the movement of 904 MT (solid bulk, liquid bulk and general cargo) in 2012, compared to 886 MT moved in in 2011 95.
3.2 Ports Hierarchy Structure
Figure 14: Brazilian Ports Structure
Brazilian Federal Government (Presidency of the Republic) Ministry of Transports SEP (Secretariat of Ports of the Presidency of the Republic
Dock Companies
TUP's - Private
Use Terminals
Delegated Ports
ANTAQ (National Waterways Agency) Source: ANTAQ 9624
Key Government Agencies:
SEP - Secretariat of Ports: The Presidency of the Republic of Brazil through the Presidency Secretariat for Ports, here as SEP, is in charge of the Maritime Ports (being 34 Ports under its responsibility) and its policies, programs, concessions to private ports and projects.
Ministry of Transports: It is responsible for the Waterways Ports (Rivers and lakes). ANTAQ: This is a regulatory agency linked to the SEP and Ministry of transports. It aims
to Implement, regulate, and supervise the activities and services in the waterways and maritime ports in order to preserve the society’s interest.
Ports administrators under concessions:
Docks Companies: These are shared private and public companies that have the Federal
Government as the largest shareholder, meaning the Brazilian government has decision power on it. These docs control 18 maritime ports and are seven of them: Dock Company of Ceará State, Dock Company of Pará State, Dock Company of Rio Grande do Norte State, Dock Company of Bahia State, Dock Company of Espírito Santo State, Dock Company of Rio de Janeiro State, Dock Company of São Paulo State.
Delegated Ports: There are 16 of the 34 ports under responsibility of SEP that are delegated and authorized to be operated by the state and city governments (See Appendix 12).
3.3 Private Use Terminals (TUPs)
The TUP’s are private owned lands close to the ports operated under government authorization. It is a private terminal inside of a public port but belonging to private companies for their use to store and move cargos. These terminals accounted for 65% of Brazil's cargo handling in 2012. There are 128 Private Use Terminals (TUPs) authorized to operate in Brazil 97 (See Appendix 13).
3.4 Brazilian Ports PESTEL Analysis (98)
Political: The heads of the Brazilian ministries, including SEP and Ministry of Transports are
chose or negotiated politically by the Brazilian President and political parties, and it is based on politics and not technical skills what compromise the efficiency of the ports due to the corruption risk. The two ministries are disputed by the politics because of the high flow of investments it has.
Recently Brazil had corruption scandals involving politicians and suppliers of its largest company, the oil giant producer Petrobras. These suppliers are authorized by the justice to participate in the investments of public ports what can led to possible increase in final costs of the ports and its access because of corruption, losing the opportunity to invest effectively in the country’s infrastructure and enhance competitiveness 99.
Economical: Although the World Bank states that Brazil had a boom decade between 2003-2013
when more than 26 million people were lifted out of poverty, the recent indicators are not that impressive. In fact, Brazilian GDP decreased by only 0,1% growth what says that its economy did not grow and is stagnated 100.
For 2015, the economic indicators are pessimist. On Jan 9, 2015, the GDP growth was estimated to be 0.40% from 0.50% the previous week and inflation was expected to be 6.60% from 6.56% previously. Moreover, Financial agencies Standard & Poor’s and Moody’s Investors Service downgraded Brazil’s credit rating what can scary those investors more conservatory 101.
In this scenario is difficult to expect high investments in its logistics to enhance its ports and their access. However, Brazil stated it will invest US$ 11,5 Billion in 2015 only in Ports through private investments (concessions) and its reserves. Brazil also will give 63 new authorizations to build TUP’s 102.
Social: Strikes are very common in Brazil from the truck drivers, operational workers and
government’s agencies in the ports. In January 2015, at least ten ports under responsibility of the dock companies had strikes for a period of six hours. They complain about privatizations in the ports what can led to layoffs because the government is looking for investments from the private sector 103. Brazilian work law permits the arrangement of disputes between shipping organizations and Labor Unions. 104.
26
Moreover, the Brazilian ports not only copes with the richness that it produces in its soil, but also neighborhood poverty, prostitution, sexual diseases outbreak and smuggling and drug dealers. In addition, the ports produce (solid/liquid) waste and the risks of chemicals hazards are constant. It is important to point out that the ports usually are very important for the local economies being the main revenue generator what creates hundreds of jobs 105.
Technological: The last year’s lack of investments in the ports led it to a fragile situation in its
installations being in decline. This lack of investments caused a reduced in the number of ships docking and required the shipping ports to accept passenger cruisers to compensate its losses. According to IPEA (Institute of Applied Economics Research), Brazil needs to do 265 infrastructure projects and invest US$ 13,1 Billion in construction, extension and renewal of ports. This includes its access such as roads, railroads, dredging and modernization of equipment’s.
The need does not mean that something will be done. In the last decade, only US$ 2,6 Billion was invested in 34 Ports which responds to 76,7% of the country foreign trade or roughly 0,6% of the GDP. Perhaps the biggest issue in the ports in terms of infrastructure are the deepness of the ports ship access, not adequate for the new ships being building, like Valemax for example 106.
Environmental: According to a top executive from Vale in China and Brazil in special interview
to this Bachelor Project (See Appendix 22), one of the major issues Vale has to keep expanding are the ports licenses that takes a long time for approval. The main conformities to be requested are: Operation License, Dredging License, Environmental Management Units, Individual Emergency Plans, Solid Waste Management Plan, environmental Audit, Risk Management Program, Emergency Control Plan, Environmental Risk Program and Environmental Controlling and Monitoring Program 107.
The SEP (Secretariat of Ports) develops sustainable programs to minimize the impacts that Ports have on the cities where they are located 108. This department requires some mandatory steps to lease an area inside a statutory port or to obtain a license to construct a Private Use Terminal (TUP) that are:
Submit a Project Draft to the environmental authority. This includes contact data, size of the construction, localization of the installations, technical details, liquid effluents, solid waste and atmospheric emissions, among others.
After that, the environmental authority will issue the Term of Reference in order to conduct the environmental impact study.
When the study is evaluated positively, the Previous License, which is valid for five years, is conceded.
In addition, it needs to apply for the Installation License in order to begin construction. To do so, the applicant must present the Execution Project, a Basic Environmental Program and an Environmental Management Program. If successful applied, the authorities grant a six-year license.
Finally, once the construction work is concluded, must apply for ten years Operation License.
Legal: Those who work in international logistics in Brazil know very well how bureaucratic is the
Brazilian Port System. The excess in bureaucracy to do the customs clearance creates a bottleneck and makes the Brazilian products less competitive. There are many government agencies such as Ministry of Defense, Brazilian Health Surveillance Agency, Federal Revenue Department, and Ministry of Agriculture. Each Agency will issue a mandatory document and check the shipments physically. Brazil do not have only one system linked to provide all information’s but the exporter/Importer must provide data and fill different forms to each of the agencies/departments 109.
Moreover, the bureaucracy in the ports led to payment of demurrages because of the time that the ship last in the ports, what increases the costs to produce in Brazil and lose competitiveness compared to other countries. According to specialists, today is impossible to avoid demurrage in Brazil 110.
Demurrage and Customs Clearance responds to 18,56% and 17,84% of the costs respectively for those companies who operate in the Brazilian ports. The ports costs grew by 27, 26% between 2009 and 2012 according to the Brazilian Institute Tax Planning. In 2012 these costs were US$ 9.55 Billion, a 27,1% increase compared to 2009 (US$ 7,51 Billion) and this costs hit US$ 4,86 Billion in the first semester of 2013 111.
28
CHAPTER 4: VALE’S MARITIME TERMINAL OF PONTA DA MADEIRA
4.1 The Complex of Itaqui
In order to understand the Maritime Terminal of Ponta da Madeira (here as PDM), we need first figure out where it is located.
Figure 15: Ports Location of the Complex of Itaqui in the São Marcos Bay
Source: Bachelor Thesis Interview by email with Mrs. Luciana Ferreira Kuzolitz, New Business Manager – Port of Itaqui. Sent on Jul 9, 2015 112.
The Brazilian state of Maranhão located in the Northeast of Brazil is a strategic place for Vale. Iron Ore produced in Carajás Mine and carried through the Carajás Railroad is shipped to the main markets in Europe and Asia from its private port called Maritime Terminal of Ponta da Madeira (from the Portuguese: Terminal Maritimo da Ponta da Madeira or PDM). The company’s private terminal is located in the Complex Port of Itaqui in São Luís city, on the east bank of São Marcos Bay. The Complex is made of:
Port of Itaqui (Public Port belonging to the Brazilian State Government);
The Maritime Terminal Alumar (TUP) belonging to the Alumar Consortium (Alcoa, Rio Tinto, Alcan e BHP Billiton companies, where ships docs in a 252m dock length;
The Maritime Terminal of Ponta da Madeira - PDM (TUP) which belongs to Vale SA; It is the busiest cargo complex port in Brazil, having handled 107 MT of Iron Ore in 2013 and had 10,7 MT storage capacity in the same year (See Appendix 14) 113.
4.2 The Port of Itaqui
The Port of Itaqui started its operations on Jul 4, 1974. It is located in São Marcos Bay and serves to the states of Maranhão, Tocantins and norths of the states of Goiás and Mato Grosso, being that the two last benefit of the port infrastructure because they are large producers of cattle and soybeans respectively. It has 1.616 m of docks length with different depths: 9m and 21,5m, distributes in six berths called berths 101, 102, 103, 104, 105, 106.
Figure 16: Overview of the Port of Itaqui with its berths and dimensions
Source: PDZ. Porto do Itaqui 114
The port handles around 15 MT/ Year of cargo: 52% solid grains (pig iron, coal, copper, soybeans, fertilizers, rice and wheat), 45% liquid grains (refined oil products) and 3% are containers 115. In fact, in 2014, it handled 18.028,302 MT of cargo in its installations or a 17, 89% growth compared to the previous year. Refined Oil raked first and accounted to 43,7%, followed by Soybean with 16,9% 116.
4.3 The TUP Alumar Consortium
The Maritime Terminal of Alumar is located in São marcos bay having a 5,5 km canal access from the Port of Itaqui. It has 545 m dock length and 19,6m width and is owned by a consortium of large aluminum producers (Alcoa, Rio Tinto, Alcan e BHP Billiton) 117. It has two berths, 01 (320m length and 13m depth) and 02 (225m length and 13m depth). Its Terminal can dock ships up to 50 Ton (Handymax) 118. This TUP handed 13.678.369 MT of Cargo in 2014, 6,86% growth compared to 2013, handling mainly bauxite 66,5% and Aluminum 23,9% 119.
Berth 106 420 m Length 19 m Depth Berth 105 280 m Length 18 m Depth Berth 104 200 m Length 13 m Depth Berth 103 251,5 m Length 12 m Depth Berth 102 235,1 m Length 10 m Depth Berth 101 231,4 m Length 9 m Depth
30
Figure 17: TUP Alumar
Source: Foto Imagem Website 120.
4.4 The TUP Ponta da Madeira (PDM Port): History and Overview
Figure 18: Maritime Terminal of Ponta da Madeira Location
Source: Vale 2015 121.
The Maritime Terminal of Ponta da Madeira (here as PDM Port) is located near the public Port of Itaqui. The terminal is capable of accommodating up to five ships at the same time. It is a deep-draft port, capable to dock the Valemax megaships. This port was the first to receive Valemax ships 122. In fact, the PDM Port is the home of one of the world’s deepest draft terminals. The world’s largest bulk carriers operates in this port often bound for Rotterdam, which is able to accommodate vessels of an equally deep draft 123.
It exports not only Iron Ore, but also manganese ore, copper concentrate and pig iron produced by Vale, and soybeans and pig iron produced by third parties 124 (See Appendix 15). It exports roughly 110 MT/ Year of Iron Ore 125. The port has Iron Ore storage capacity of 10.7 MT 126, and
has capacity to handle 130 MT/Year of Iron Ore, or 10% of the world’s Iron Ore handled standing as one of the largest ports in the world 127, being a very important logistical corridor for Vale 128. (See Appendix 16). It exported more than 3,500,000 tons of pig iron 129. In 2011, 13 trains with 330 wagons circulate daily to deliver Iron Ore to this port 130.
It was built to load Iron Ore from Carajás and export to Asia. Its excellent deepness favors the operation of large vessels such as Valemax. The project of the PDM Port had the analysis of the location and the development of the port operations as its main concern. The location was taken into consideration the width and the deepness of the São Marcos Bay so it could provide conditions for large bulk carriers to dock and a canal to have at least two ships to operate on both ways. In addition, it had a great visibility to operate and it is out of the storms route and could operate almost the whole year without the waves influence. The port started its operations on Jan 6, 1986, when 11,6 MT of Iron Ore was loaded 131. (See Appendix 17).
4.5 Port Information
The Port had 4 piers, Pier I, Pier II, Pier III and Pier IV, but the Pier II used for loading pig iron, soybean, corn and other commodities was give back to the Port of Itaqui since it was a leasehold contract. Now PDM Port has 3 piers that load only Iron Ore 132.
Figure 19: PDM Piers Location
* Pier IV was under construction. Source: INCHCAPE SHIPPING SERVICES 133
Pier I Pier III N
Pier IV
Pier II Pier III S
32
Figure 20: PDM Pier I
Receives ships up to 420.000 DWT and has 590 m berth extension with a 23 m depth. Loads Iron Ore at a 16.000 T/h loading rate.
Figure 21: PDM Pier III (North and South Berths)
Receives ships up to 200.000 DWT Berth South and 180.000 Berth North. It has 655 m berth extension with a 21 m depth. Loads Iron Ore and manganese at 8.000 T/h loading rate.
Figure 22: PDM Pier IV South
Receives ships up to 450.000 DWT and has 1.600 m berth extension with a 25 m depth. Loads Iron Ore at a 16.000 T/h loading rate
Source: Vale 134
Source: Vale 135