TRAVAIL DE
BACHELOR
2013
K
INECTA
UGMENTEDR
EALITYO
RGANV
ISUALIZATIONETUDIANT: JOEL¨ VOISELLE
Abstract
A quick Internet research gives many results of Augmented Reality (AR) applications, even more since smartphones and tablets appearance. AR can provide many advantages in different fields of work and the increas-ing AR application number resultincreas-ing from a quick simple Internet search shows it is a concept more and more studied. In the case of medicine, AR can provide surgeons with pertinent information during an operation like the radiography of a patient mapped at the right place. In the video game industry, AR is more and more used and manufacturers like Microsoft cre-ate hardware and software like the Kinect to be present in this new market. Microsoft recently opened to developers a beta version of its new device, the Kinect for Windows version 2. This thesis explores the capability of the new Kinect to be integrated in an AR software allowing the display of a 3D model of a patient’s organ, created from the Magnetic Resonance Imaging (MRI) resulting file. The development process was split in steps with a new functionality added at each step, starting with a simple 3D model displayed over a video and ending with an organ model over the Kinect video data. The resulting software is functional but Kinect limitations, probably due to the fact it is still in beta, give a bad image quality. This result shows that such a hardware is good for video games and, in some cases, can be used in some other fields. But the constraints given by specific applications like the one exposed here, are not compatible with the hardware. In the case of the concept developed in this thesis a simple webcam coupled with com-puter vision gives better results and flexibility than a proprietary hardware like the Kinect.
Sworn Statement
I hereby certify that I have written the present Bachelors thesis on my own, without any help other than listed in the reference section, and that I have not used any sources other than the ones specifically mentioned. I will not give any copies of this report to anyone without the authorisation of both the RF and the supervisor of the Bachelors thesis. This includes the applied research partner with whom I have worked, but not the persons who have provided me with the key information required for writing this thesis and which are listed hereafter:
• Yann Bocchi • Yashin Dicente • Stefano Bromuri
Contents
List of Figures i
List of Tables iii
1 Introduction 1
I Background 2
2 Technologies 3
2.1 C# and .NET . . . 3
2.2 Windows Presentation Foundation (WPF) . . . 4
2.3 LATEX . . . . 4
2.4 Version Control . . . 4
2.5 Digital Imaging and Communications in Medicine (DICOM) . 5 3 Tools 6 3.1 Visual Studio 2013 . . . 6 3.2 Mercurial (Hg) . . . 7 3.3 Microsoft Project 2013 . . . 7 3.4 Sublime Text 2 . . . 8 3.5 Inkscape . . . 9 3.6 TeX Live 2013 . . . 10 3.7 HxD . . . 10
4 The Kinect for Windows v2 12 4.1 Kinect 1 and 2 Hardware Comparison . . . 12
4.2 Kinect XBox One Features . . . 14
4.3 Current Features . . . 14
4.4 Future Features . . . 15
4.5 Features Description . . . 15
4.5.1 Color Application Programming Interface (API) . . . . 15
4.5.2 Depth API . . . 16
4.5.4 Infrared API . . . 18
4.5.5 Coordinate Mapping . . . 18
4.5.6 Use of Kinect in Specific Domain . . . 20
4.5.7 Use of Kinect in Medical Field . . . 20
II The System 22 5 Development Process 23 5.1 Kinect Software Development Kit (SDK) Analysis . . . 23
5.2 Software Architecture . . . 23
5.3 3D renderer . . . 24
5.4 Kinect data and 3D model display . . . 25
5.4.1 3D Projection . . . 26
5.5 3D Model Creation From DICOM File . . . 36
5.5.1 DICOM File Structure . . . 36
5.5.2 Marching Cubes Algorithm . . . 39
6 Resulting Software Prototype 50 III Evaluation and Conclusion 68 7 Evaluation 69 7.1 The Original Idea . . . 70
7.2 Kinect Related Issues . . . 70
7.2.1 The Poor Resolution Issue . . . 70
7.2.2 A Missing Detail . . . 70
7.3 The Kinect Use in AR . . . 70
7.4 The Marching Cube Algorithm . . . 71
7.5 Surgeon Use of the System . . . 71
8 Future Work 73 8.1 Hardware . . . 73
8.2 Software . . . 73
8.3 Mixing Technologies . . . 74
8.4 A Full System to Think About . . . 74
9 What Was Learned 76 9.1 Microsoft Kinect SDK . . . 76 9.2 3D . . . 76 9.3 DICOM . . . 77 9.4 Computer Vision . . . 77 9.5 Visual Studio . . . 77 9.6 Tortoise Hg . . . 77
9.7 LATEX . . . 78 9.8 Report Writing . . . 78 Bibliography 80 Acronyms 87 Glossary 89 Appendices 92 Appendix A Specification 93 A.1 Step . . . 93
A.2 Work Organisation . . . 94
A.2.1 Stakeholder . . . 94
A.2.2 Methodology . . . 94
A.2.3 Planning . . . 97
List of Figures
3.1 Visual Studio 2013 interface . . . 6
3.2 Mercurial interface through TortoiseHg . . . 7
3.3 Microsoft Project 2013 Interface . . . 8
3.4 Sublime Text Interface . . . 9
3.5 Inkscape Interface . . . 9
3.6 HxD interface . . . 11
4.1 Kinect v2 Joints Tracked . . . 17
5.1 The software principle . . . 24
5.2 A 3D cube over a registered video . . . 25
5.3 An orthographic projection . . . 27
5.4 The orthographic projection principle . . . 28
5.5 The perspective projection principle . . . 29
5.6 Giant shadow and pixel misalignment . . . 31
5.7 Distance range data filtering result . . . 33
5.8 Body data filtering result . . . 34
5.9 AR window with cube result . . . 36
5.10 Basic DICOM file structure . . . 37
5.11 Data element structure . . . 38
5.12 MRI slice image example . . . 39
5.13 Indexing convention . . . 40
5.14 Isosurface crossing a cube . . . 41
5.15 Medical image visualization using WPF Capabilities Screen-shot . . . 43
5.16 File Selection Window . . . 44
5.17 Model Display . . . 45
5.18 Model Mapping Example . . . 46
5.19 Model Resized to 0.4 Times its Original Size . . . 47
5.20 Model Position Adjustement . . . 48
6.1 File Selection Window . . . 50
6.2 Cleaned model displayed . . . 51
6.4 Model Resized to 0.4 Times its Original Size . . . 53
6.5 Model Display . . . 54
6.6 Model Position Adjustement . . . 55
6.7 The class diagram . . . 65
List of Tables
4.1 Kinect v1 and v2 Hardware Comparison . . . 13
4.2 Kinect Coordinate Systems . . . 19
A.1 Planification . . . 96
Chapter 1
Introduction
In 2013 the Microsoft Research Cambridge team released an AR video showing a brain tumor inside the head of a mannequin when launching the Kinect Fusion API for the Kinect for Windows version 1 [46]. This thesis mo-tivation is to explore the possibility of creating a similar AR system by using the new features and accuracy provided by the new Microsoft Kinect for Windows version 2. The project related to this thesis will focus on the fea-tures available in the April 2014 SDK. Because hardware and software are still in beta at the writing date, their available features may have changed since.
Part I: Background
This part contains Chapter 2, Chapter 3 and Chapter 4. Chapter 2 gives an overview of the technologies used for or related to this project. Chapter 3 presents the tools used during this project, for programing as well as time manager and backup software. Chapter 4 is a pre-sentation of the material used for the project, the Kinect for Windows version 2.
Part II: The System
This part contains Chapter 5 and Chapter 6. Chapter 5 describes the step by step development process of the prototype, showing prob-lems, solutions and alternatives. Chapter 6 presents the prototype and how to use it. It shows also which features the prototype is capa-ble of.
Part III: Evaluation and Conclusion
This part contains Chapter 7, Chapter 8 and Chapter 9. Chapter 7 presents the evaluation of the prototype. Chapter 8 gives some ideas for improving the system. Chapter 9 describes what was learned dur-ing this project realization.
Part I
Chapter 2
Technologies
2.1
C# and .NET
C# is a programming language created by Microsoft to create applications for the .NET Framework. It is similar to the C++ programming language [56] but is executed in a software environment, which means the resulting application works, in a similar way as the Java programming language, in a virtual machine whereas C++ application are run in the hardware environ-ment. The virtual machine, named Common Language Runtime (CLR), provides services like memory management, exception handling, input, output [14]...
This virtual machine, and the services it provides, allows a faster devel-opment process by adding an additional layer which masks some low level processes to the programmer, allowing him to focus only on writing applica-tion code. Indeed, writing or opening files are quite common operaapplica-tions in computing. By delegating these operations to the CLR the programmer can focus on the file content treatment and not the stream manipulation which decreases the time taken to write an application.
In terms of performance, because of the added layer, there is a loss in the execution speed, which could be a problem in some cases. Most often the loss of speed is counterbalanced by the benefits this layer provides [55, 73].
C# is one of the program studied in the Haute ´Ecole Sp ´ecialis ´ee de Su-isse Occidentale (HESSO) and one choice for the Kinect SDK as said in section 5.3. Thus it is naturally the language adopted in the early develop-ment of the project.
2.2
WPF
WPF is a presentation system for building Windows applications. It sepa-rates the user interface from the software processing logic by using XAML, similar to eXtensible Markup Language (XML), for Graphic User Interface (GUI) elements linked to background C# code realizing the processing logic.
This separation of tasks reduces maintenance and development costs. Because the logic and the appearance are not coupled it is easier to modify one or the other without risking to break the software by a bad manipulation. It also improves the development efficiency by allowing designers and pro-grammers to develop the application in parallel and merge their work later. Globalization and localization are simpler to implement with a separated design like the one offered by WPF [59].
Due to its advantages it was used in the project development.
2.3
L
ATEX
LATEXis a typesetting system, more specifically a document preparation
sys-tem, well suited for the scientific and technical document writing. The con-cept of LATEXis to encourage authors to focus on the content of their writing
instead of worrying about the appearance of the document, by separating presentation and content. This concept is similar to what can be observed on website with HyperText Markup Language (HTML) defining the content and Cascading Style Sheets (CSS) defining the presentation, or in a way like WPF which separate logic and user interface [8].
The structure of a LATEXdocument is quite similar to a XML one with
tag defining a document part. Despite the small amount of time required for learning and memorizing the different tags, the advantages are numer-ous and outperform this light inconvenience. For example the gains with LATEXare in flexibility, control, portability, quality, stability [74]...
This thesis was written with LATEX.
2.4
Version Control
Version control, also named revision control and source control, is a way to organize and control changes to documents. It is often coupled with a cen-tralized repository allowing a backup in case of failure of the first repository, but also collaborative work by centralizing the team work. It numbers every change or set of changes with a revision number and allows one to restore a specific version also compares and merges different revisions.
To keep track of the changes of the project, a version control system was set and used to manage changes of the software source code and this thesis writing. A centralized repository allowed multiple work places as well as backup in case of a computer failure.
2.5
DICOM
DICOM is an international standard for medical images and information related to the patient. It is implemented in almost every medical imaging devices and more and more in devices in medical fields like ophthalmology and dentistry. It was first published in 1993 and is considered as the In-ternet of the medical imaging [2]. Because it is a standard, it enables the integration of multiple devices like scanners or servers of multiple manufac-turer, into a single system.
DICOM is not only a file structure specification which allows to store image related information like JPEG can do, it is also a network application protocol specification to communicate between systems [13].
The developed software uses DICOM files as input and creates a 3D model from the data they contains. The file structure is described in sec-tion 5.5.1.
Chapter 3
Tools
3.1
Visual Studio 2013
Visual Studio 2013 is a Microsoft Integrated Development Environment (IDE) supporting many languages such as C, C++ but also .NET languages and ASM. Like a majority of IDE it provides an editor, compiler and debug-ger. It has a graphic editor for GUI designing, and includes a version control with a repository linked to a Microsoft account or a Team Foundation Server. A lighter version running in the browser called ”Monaco” is also available. The figure 3.1 shows the GUI of Visual Studio 2013. Some plug-ins are available giving Visual Studio more functionalities like Bizztalk or business intelligence features development.
Figure 3.1: Visual Studio 2013 interface
pro-vided by Visual Studio 2013, this IDE was used to develop the prototype. Website: http://www.visualstudio.com/
3.2
Hg
Hg is a free open source version control software. It is platform indepen-dent, mostly written in Python with portable C for some part which need performance. It is possible to add extensions to the software by download-ing them or writdownload-ing them in Python. It is quite similar to Git and Bazaar. Its GUI is called TortoiseHg, it is a shell extension for Windows packed with a series of applications like KDiff3, which allows to see the difference between 2 files and merge them. Its interface is shown on figure 3.2.
Figure 3.2: Mercurial interface through TortoiseHg
To keep track of changes in the source code or in the report, Hg was used through the TortoiseHg GUI for this project.
Website: http://tortoisehg.bitbucket.org/
3.3
Microsoft Project 2013
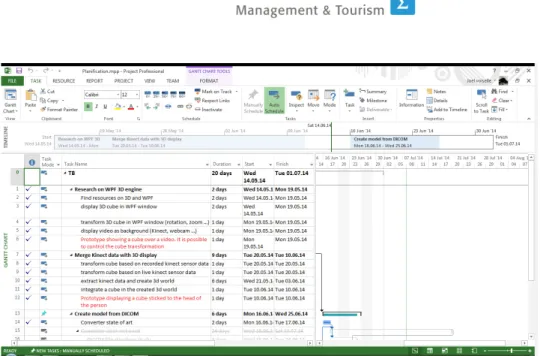
Microsoft Project 2013 is a Microsoft Software for project planing and man-agement. It offers various views of the project, the time line, a Gant chart, the budget, the resources needed. . . It can generate various reports, such as burndown charts, to measure and anticipate the project’s evolution. Fig-ure 3.3 shows the interface of Microsoft Project 2013.
Figure 3.3: Microsoft Project 2013 Interface
This project development was split in different subtasks as shown by table A.1. Microsoft Project 2013 was used to have a look on the planning and task completion during all the project’s duration.
Website: http://office.microsoft.com/en-us/project/
3.4
Sublime Text 2
Sublime Text 2 is a text editor full of useful features for code edition or markup. It allows for example multiline edition, multiple selection and syn-tax coloring. It is cross platform and highly customizable with JavaScript Object Notation (JSON) files and Python plugins. It can be used for free for a lifetime with a pop up appearing at regular interval when opening the software. An example of the interface design is shown on figure 3.4.
Figure 3.4: Sublime Text Interface
This software was used for the report writing in LATEXmainly for its syntax
coloring feature and LATEXplugin.
Website: http://www.sublimetext.com/
3.5
Inkscape
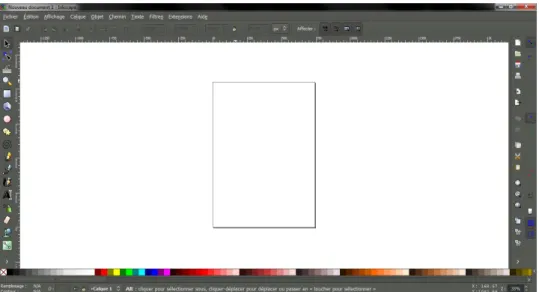
Inkscape is a multiplatform vector graphics software. It is free and open source. It can import and export multiple formats and is extensible by the use of plugins. The interface at the software launch is visible on figure 3.5.
Because the report was written with LATEX, and because the figures are
best rendered when in Encapsulated PostScript (EPS) format, Inkscape was used during this project for screenshots and images conversion in EPS.
Website: http://www.inkscape.org/en/
3.6
TeX Live 2013
TeX Live 2013 is a free distribution containing the major programs, pack-ages and fonts for LATEXdocument production. Such a distribution is
compul-sory for creating documents written with LATEXbecause the ”source”
docu-ment needs to be compiled. The purpose of such a distribution is to provide a set of elements necessary for creating documents with LATEX.
Because the report is written with LATEXthis distribution was installed to
provide an environment for compiling LATEXsources.
Website: https://www.tug.org/texlive/
3.7
HxD
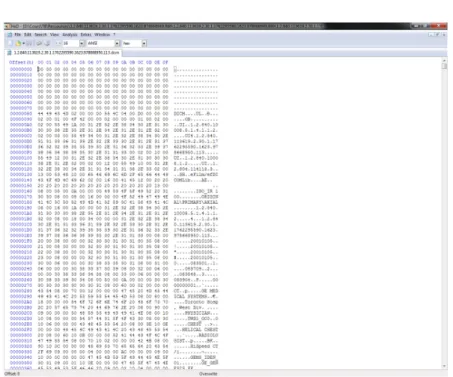
HxD is a hexadecimal editor which can handle files, hard drives and com-puter memory. It is an independent software created by a German, Hrz Mal. It is a Word like editor displaying the file content, in hexadecimal in one column and the corresponding value in a selectable format (ANSI ...) in another column as visible on figure 3.6.
Figure 3.6: HxD interface
Because DICOM are binary files, it is more convenient to use such a program to inspect their structure and content. This software was used for this purpose during the project’s development.
Chapter 4
The Kinect for Windows v2
In 2010 Microsoft launched a new device for the gaming platform Xbox: the Kinect. Beside its principal use, a number of fields had found a new use for the Kinect, adapted to their specific need. In the near future Microsoft will release a new version of its device with improved hardware and software. The purpose of this chapter is to review the Kinect uses by comparing the different existing versions (Kinect 1, Kinect for Windows, Kinect for Xbox 360 and Kinect for Windows 2), describing the new version’s features and the projects around the previous versions in the specific medical field.
4.1
Kinect 1 and 2 Hardware Comparison
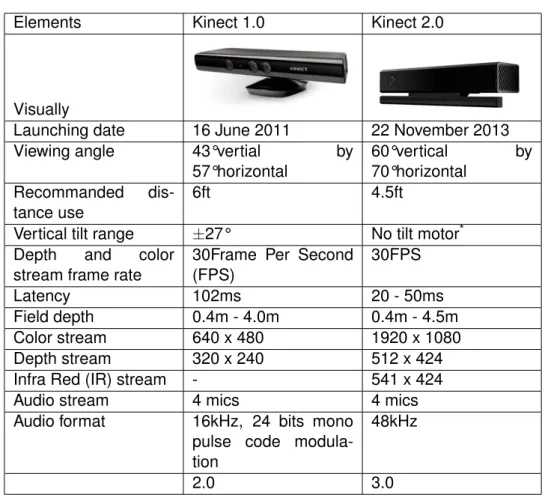
The previous Kinect version provides numerous functionalities but the new version 2 is not simply an update and provides a number of new possibili-ties. The hardware of the new Kinect has largely evolved [34, 62] as seen in table 4.1
Elements Kinect 1.0 Kinect 2.0
Visually
Launching date 16 June 2011 22 November 2013 Viewing angle 43°vertial by
57°horizontal 60°vertical by 70°horizontal Recommanded dis-tance use 6ft 4.5ft
Vertical tilt range ±27° No tilt motor* Depth and color
stream frame rate
30Frame Per Second (FPS) 30FPS Latency 102ms 20 - 50ms Field depth 0.4m - 4.0m 0.4m - 4.5m Color stream 640 x 480 1920 x 1080 Depth stream 320 x 240 512 x 424 Infra Red (IR) stream - 541 x 424
Audio stream 4 mics 4 mics
Audio format 16kHz, 24 bits mono pulse code modula-tion
48kHz
2.0 3.0
*The tilt motor of the first version, allowing it to automatically orientate
itself in a vertical plane, has been removed because it is no longer useful on the new version due to a more important vertical field of view on the new camera.
4.2
Kinect XBox One Features
Kinect for Xbox One was released in November 22nd 2013, the device is automatically given with the new Xbox One game system. The Kinect 2 for Xbox One possesses an integrated 30FPS color 1080p camera that pro-cesses two gigabits of data per second to accurately read its environment. It uses the Time of Flight technology [26] which allows a rapid image cap-ture, and integrates a microphone arrays. The new Kinect 2 for Xbox One has several extra features than the Kinect for Windows version 2:
• Browsing the Xbox One Interface by gesture and voice. • Voice detection like ”Xbox One” that activate the system [6].
• Biometric scanning that allows anyone in the room to take control of the Xbox One gaming system at the sound of their voice. After registering with the Xbox One, users are recognized when they enter the room, and can confirm the setup with their voice [3].
From our preliminary test with the new Kinect for Xbox One we discov-ered that there are several interesting features:
• Kinect can detect a full list of vocal commands like ”Xbox start”, ”Xbox Select” etc. It can also detect these commands in other language. • Kinect can detect hand motion to create a full set of activities such as
selecting something, browsing through a menu, holding a command, going back to the start screen.
• Kinect can also detect players that it has in front of him, it can detect several players at the same time and change the setting and the menu according to the user.
4.3
Current Features
The Kinect for Windows version 2 is currently under beta so the available features are about to change. At the writing date we are currently using the April update of the Kinect for Windows v2 SDK (Tech Preview). Currently available features are the following [38, 62]:
Colour API Get data from the color camera
Depth API Get data from the depth camera
Simple body API Get data from a body mapped skeleton of each human
user the Kinect detects
Infrared API Get data from the infrared camera
Coordinate mapping Map depth value with the RGB value
4.4
Future Features
The Kinect for Windows version 2 will have several features added during the following months. Some of them are already implemented in the Kinect for Xbox One version. Futures features are the following:
Multiple Sensors Connect more than one Kinect for Windows version 2 to
your application.
Facial Recognition API Detecting people with their faces [38].
Audio API Getting vocal commands with Microsoft Speech SDK, API that
handle voice command for Windows [60].
4.5
Features Description
This part shows how the different features works by giving some hardware and software details. Some features use proprietary algorithms and are based on patents or reverse engineering made by people on the internet.
4.5.1 Color API
This is the most basic feature available which should be provided by such a device.
It uses the color camera which is a full HD camera sending frames in the default YUY2 format. The underlying buffer is an array of bytes accessible for raw format [38]. It is possible to convert the frame data to other formats with a slight Central Processing Unit (CPU) cost [38].
4.5.2 Depth API
To track user movements the Kinect uses the depth camera.
The depth camera is composed of one infrared sensitive camera and an infrared sending component. The depth camera seems to function by analysing a speckle pattern of infrared laser light sent by the second com-ponent and uses a depth from focus algorithm coupled with a depth from stereo algorithm to determine depth distance of each pixel [77].
Frame data is two bytes per pixel and is stored in millimetres with a max value of 4500 [38]. Also accessible from the depth API is a body index which track the index of the body at the corresponding pixel, determined by the body tracking algorithm. Data is one byte per pixel giving the body index number from -1 (no body detected), 0 to 5 [38].
4.5.3 Simple body API
To track users, which is the main use of the device, the Kinect matches a virtual body onto the depth data.
Body parts seem to be inferred using a randomized decision forest, learned from over 1 million training examples. There are two sub-stages, the first starts with 100,000 depth images with known skeletons (made from a motion capture system) and uses a randomized decision forest [78]. The second transforms the body part image into a skeleton by using a mean shift algorithm [76].
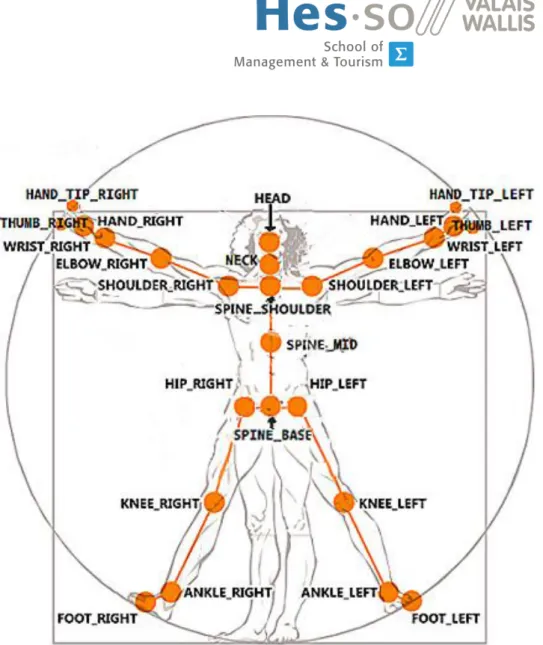
The Kinect v2 is able to track up to 6 bodies with 25 joints each as shown in figure 4.1 [38].
Figure 4.1: Kinect v2 Joints Tracked https://connect.microsoft.com
Each joint has a 3D position, and orientation specified by a quaternion. The state of each joint can be not tracked, inferred or tracked [38]. It can also track hands position such as open, closed, ”lasso”, unknown and not tracked. It has a high and low confidence property. The hand state tracking is limited to 2 bodies at the same time [38].
Some face activities are detected (eye closed, mouth open, mouth mo-tion, looking away), if the user wears glasses and some facial expressions (happy, neutral). Each of these characteristics are stored in a key-value pair dictionary with value indicating probability of that state (unknown, no, maybe, yes) [38]. Lean direction property of the body can also be retrieved. Each body is given a unique 64 bits tracking id when first detected [38].
4.5.4 Infrared API
The IR camera used for depth computing can also be used as a standard camera to provide black and white images.
The IR camera is an active camera which uses an emitting infrared source light illuminating the environment. The camera receives the re-flected light in the same way a classic visible light camera works. This allows a clear view during low environmental light conditions [38, 47]. There are two forms of use, infrared and long exposure infrared.
The infrared is a single frame whereas long exposure is the sum of three infrared frames [38]. Infrared frame data structure is 2 bytes per pixel infrared intensity value [38].
4.5.5 Coordinate Mapping
Because the variety of sensors the Kinect has three coordinate systems depending on data sensors. Details of the coordinate systems are shown in table 4.2
Name Applies to Dimensions Units Range Origin
ColorSpaceP
oint
Color 2 pixels 1920x1080 Top left
corner DepthSpaceP oint Depth, Infrared, Body index
2 pixels 512x424 Top left
corner
Camer
aSpaceP
oint
Body 3 meters - Infrared/Depth
camera Table 4.2: Kinect Coordinate Systems
Coordinate mapper allows simple conversion of single or multiple points between each system. It allows for example to create a simple green screen effect [38].
4.5.6 Use of Kinect in Specific Domain
Robotic
The NASA’s Jet Propulsion Laboratory is trying to use Kinect 2.0 to manip-ulate a robotic arm. Some Engineers were able to hook up the Kinect to an Oculus Rift in a way to create ”the most immersive interface”. With this combination they were able to control the entire rotation of a robotic limb [28].
Augmented Reality
With Kinect 1.0 several applications has been created like the Kinect Fitnect [42]. With this application you can see clothes on you without putting them on. It is like a mirror in front of you but you see your body with other clothes, givin access to a virtual dressing room.
Interactive Application
Kinect also gives you the opportunity to create an interactive wall, to nav-igate into some menus and playing a small game based on movement recognition [48].
Ecology and House Automation
Kinect sensors can also be used with the array of microphones to detect or-ders and scenarios. This can be used to control a house, or some features in the house like turning on a light or turning it off [29].
4.5.7 Use of Kinect in Medical Field
Actually the Kinect v2 is in beta and a lot of ideas gravitate around it. The medical domain did not wait for the version 2 to come out to see the poten-tial of such a device when health comes to mind. Some products running on the first Microsoft Kinect are currently running or being tested [28].
In physiotherapy, Natumed, a Polish company uses Kinect for rehabilita-tion. Their product, Heremo, offers exercises tailored to the patient’s needs (pregnant, older, injured person) and tracks the accuracy of the performed exercises. This allows to limit the number of visits to the doctor which can monitor results and consult patient reports made by the software [50].
In the US another company, Reflexion Health, is testing Vera, a similar product. This product provides a virtual coach which monitors, encourages and tracks the patient during rehabilitation exercises [49]. This product al-lows physiotherapists to find which exercises their patients react best with by reviewing patient’s data, and customize the patient’s rehabilitation plan. Vera also helps patients to properly perform their exercises, thus it improves their effectiveness, decreases the patient stress due to fear of making mis-takes with the exercises, and finally lowers the treatment cost by reducing doctor visits and shortening treatment duration [43].
In Esbjerg, Denmark, Welfare Denmark uses a virtual rehabilitation tool similar to Heremo and Vera since April 2012 [79]. In a same way it pro-vides patients with exercises from articulations diseases to muscle issues, monitoring and coaching them during the exercise time. It allows doctors to see their patients, call them and correct them if necessary, enhancing the efficiency of the treatment. This remote monitoring/coaching induces a cost reduction by limiting the doctors visit and gives new options for an aging population [36, 61].
The Kinect is finding a place in the operating room. A student is working with Siemens and IxD hof, an integration design group, to introduce the Kinect to allow surgeons to view and manipulate images and 3D model without the use of their hands [83].
Still in the operating room, Microsoft has suggested an augmented re-ality system using a Kinect to visualize 3D scans over the patients’ body for surgery preparation [46]. This system uses 2 current API allowing a 3D modelling from the Kinect sensors [45, 57] and a real time animation using the user’s body as an animating model [65].
The precision of the new Kinect sensors allows us to imagine a lot of new possible uses, in a various field. For example, it seems possible to calculate heart rate without contact [37]. With the new type of devices coming out like the Google glasses [44], the Leap motion [66] and even the Oculus rift [80] we can imagine the future of medicine full of augmented reality allowing surgeons to see inside the body before the first incision or a virtual doctor looking at his patient without moving from his office.
Part II
Chapter 5
Development Process
The development process was split in different main tasks with a working prototype as a milestone. Refer to table A.1 for detail of tasks planification.
5.1
Kinect SDK Analysis
The first part of the development process consisted in analysing the Kinect SDK possibilities and code reading. The SDK is provided with a set of examples showing the capacity of the hardware and the code to use it. The analysis began with reading the code provided and rewriting some of the examples, like the display of the color camera data and fetching the different body positions in the environment. Finally a merge of multiple features was done in a single software to have an idea how to use the SDK.
5.2
Software Architecture
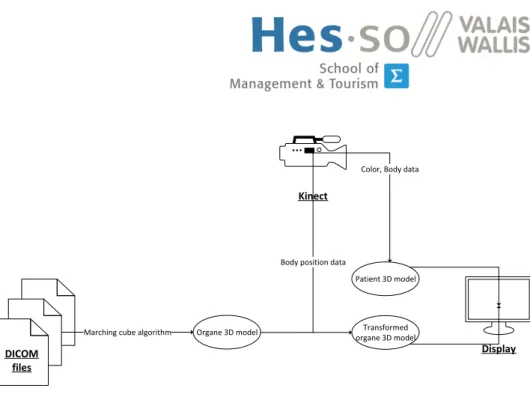
After the Kinect SDK analysis the architecture of the software was defined as shown on the figure 5.1.
DICOM files Organe 3D model Display Kinect Patient 3D model Transformed organe 3D model
Color, Body data
Marching cube algorithm
Body position data
Figure 5.1: The software principle The software works as follow :
First the DICOM files data passes through the marching cubes algo-rithm to create a 3D model of the organ.
The Kinect data is used to first, create a 3D model of the patient with the color, depth and body data ; second, the body position data is applied to the 3D model of the organ to transform it according to the patient position (rotation, scaling, translation).
Finally, the patient 3D model and the transformed organ 3D model are displayed on the screen in a virtual world creating the AR view.
5.3
3D renderer
Because AR induces the display of 3D elements, the first step during the work is to learn how to display 3D geometries in a window. This first step poses the bases of the final software and gives precision on the usable technology and time requirement. The goal of this task is to produce a window displaying a 3D cube over a video. The cube has to be manip-ulated (translation, rotation, scaling) in the window using computer input (keyboard, mouse), or directly coded. Once developed, software will be modified to transform the cube by using Kinect data input and the displayed video will come from the Kinect color camera.
The Kinect API is available in C# and C++, and Microsoft provides an example in each language for each feature provided by the Kinect. The choice of sticking with Microsoft C# and WPF technology for the GUI was made. The simplicity and rapidity of development with this technology was really impressive and appreciable for this time limited work. The WPF tech-nology is widely documented on the Microsoft website as well as its 3D features [58] and a number of tutorials can be widely found on the Internet.
The C++ example was reviewed in case of C# revealing itself too slow for the software purpose. During the technology documentation research an API, Helix 3D Toolkit [69], was found. It wraps parts of native methods and allows to easily make 3D view in a window. This API was used in order to simplify and accelerate the development process.
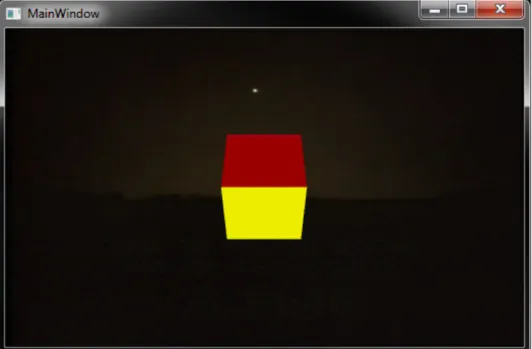
At this stage the 3D WPF feature was functional and it was planed to merge the Kinect data flow with my prototype showing a cube over a regis-tered video as shown in figure 5.2.
Figure 5.2: A 3D cube over a registered video
5.4
Kinect data and 3D model display
In AR, virtual models are displayed in real time. The goal of this work part is to transform the 3D model accordingly to the Kinect data and display the color camera view in background to have an AR visualization software. The development base already has all necessary functions for 3D transfor-mations, this part will focus on fetching data from Kinect then transforming them in order to be correctly used by the already existing algorithm. At the end of this task we will have a virtual cube following the head position and orientation of a real person filmed by the device. Once developed, this prototype could load a model of an organ which will be visible in AR.
The development process lead to the discovery of a projection problem. Basically the Kinect camera makes a projection which gives us a 2D rep-resentation of the 3D environment. This projection is used in a virtual 3D
environment which is also projected on the screen by the virtual camera. This method results with the cube to not be properly placed. This issue has implied to change the fundamental functioning of the program. Instead of making a double projection the idea is to create a virtual model of the real world by using the Kinect depth camera, then place the cube in this world and finally make the final projection.
5.4.1 3D Projection
The 3D projection is a method to map 3D points to a 2D plane like when capturing a photo or when the graphic card render a 3D scene on the screen. The 3D projection can take multiple forms, we restrict here in Or-thographic projection and Perspective projection.
Prerequisite
Before detailing these projections we need to define the view volume and the canonical view volume.
The view volume is the region of the space that contains objects you want to project on the plane.
The canonical view volume is the volume resulting from the transforma-tion of the view volume. The canonical view volume has its coordinates normalized to the device coordinates.
Orthographic Projection
This projection is a parallel projection, it means all the projection lines are orthogonal to the projection plane so parallel to each other. This methods ignore the perspective of the scene and result in images as you can see on figure 5.3.
Figure 5.3: An orthographic projection
http://www.codeguru.com/cpp/misc/misc/graphics/article.php/ c10123/Deriving-Projection-Matrices.htm
It is a simple technique where parallel lines in 3D are parallel in the 2D projection, the object has the same size in 2D and 3D but the feeling of distance disappears.
In this technique the view volume is aligned to an axis of the canonical view volume as shown in figure 5.4
Figure 5.4: The orthographic projection principle
http://www.codeguru.com/cpp/misc/misc/graphics/article.php/ c10123/Deriving-Projection-Matrices.htm
A simple orthographic projection matrix [23] onto the plane with z = 0 is
P = 1 0 0 0 1 0 0 0 0
Thus for a 3D point v = (vx, vy, vz)the projected point P v is found by a
simple matrix multiplication
P v = 1 0 0 0 1 0 0 0 0 vx vy vz = vx vy 0
But in computer graphic we talk about near clipping plane and far clip-ping plane. These planes define a z interval in which objects are rendered. Beyond these two planes objects are simply ignored. The resulting matrix [40] is a little more complex but works the same way
P = 2 w 0 0 0 0 2h 0 0 0 0 f −n1 f −n−n 0 0 0 1
With w the width of the view volume, h its height, f the far clipping plane and n the near clipping plane.
Perspective Projection
This projection is more complex but gives the illusion of distance so it is more frequently used. The main difference with the orthographic projection is the view volume is a truncated pyramid called a frustum like in figure 5.5.
Figure 5.5: The perspective projection principle
http://www.codeguru.com/cpp/misc/misc/graphics/article.php/ c10123/Deriving-Projection-Matrices.htm
Because the frustum far plane is bigger than the near plane, the further the object is, the more it has to be scaled down thus appearing smaller than nearer objects.
The principle is to project a frustum point p to the near plane, this gives us p0. Then use the orthographic projection to make the projection of this new point p0 to have the final perspective projected point p00.
Without entering in calculation details well explained at http://www. codeguru.com/cpp/misc/misc/graphics/article.php/c10123/Deriving-Projection-Matrices.htm, the resulting projection matrix [40] is
P = 2n w 0 0 0 0 2nh 0 0 0 0 f −nf −f nf −n 0 0 1 0
Usually we use the camera field of view a instead of the frustum dimen-sion and the aspect ratio r defined as r = w/h. Based on trivial trigonome-try again explained at http://www.codeguru.com/cpp/misc/misc/graphics/ article.php/c10123/Deriving-Projection-Matrices.htm we can find the final projection matrix [40]
P = 1 rcos( a 2) 0 0 0 0 cos(a2) 0 0 0 0 f −nf −f nf −n 0 0 1 0
For more information and calculation details refer to http://www.codeguru. com/cpp/misc/misc/graphics/article.php/c10123/Deriving-Projection-Matrices.htm (Accessed July 3rd, 2014).
For creating the 3D visualization it was decided to use a cloud with real color points to represent the 3D environment. The issue with this idea is the 3D renderer used until now is not able to display point cloud and seems to be limited to around 20 000 points [82] in display, yet according to Microsoft the depth camera has a resolution around 220 000 pixels [39]. Thus, OpenGl as 3D renderer and OpenTK [72], a C# wrapper for OpenGl, were used to keep the development velocity. C++ and native OpenGl were kept as a backup solutions in case of lack of performance in C#.
The first version of the colored point cloud keeps all data from Kinect and recreates the whole environment, including the background. Due to the use by the Kinect of an IR spot to calculate depth as described in the depth API section 4.5.2, a giant shadow appears and provokes misalign-ment of pixels as seen in figure 5.6.
(a) Giant shadow first example
(b) Giant shadow second example
Figure 5.6: Giant shadow and pixel misalignment
Two solutions were developed for avoiding this shadow. The first one consists in keeping only data within a distance range from the Kinect. By
ignoring the background and foreground this solution removes the shadow but also removes some part of the image if the person takes some position or move too close or too far of the device like in figure 5.7.
(a) In range
(c) Too close
Figure 5.7: Distance range data filtering result
The second solution consists in keeping only data linked to a body de-tection. This more complex and computing intensive solution gives better results as soon as the Kinect has identified a body. A result of this solution can be seen in figure 5.8.
Figure 5.8: Body data filtering result
An issue in the program design was spotted during the development of the colored points cloud. The issue lead to a black flickering effect during visualization due to some frame coming from the Kinect not treated. This issue has, after comparison with a green screen effect demo provided by Microsoft, two possible causes. The first cause is due to the program to be treated nearly exclusively by the CPU so, when the rendering method is launched, the incoming frames are no longer caught, leading to a black screen the next rendering. The second cause is maybe due to the fact C# is like Java and uses an intermediate layer before the Operating System (OS) which causes latency resulting in this flickering effect. Some researches were conducted and lead to the discovery of some rendering speed im-provement. One way consists of storing drawing informations directly in the graphic card memory by the mean of Vertex Buffer Object (VBO) [71]. It was also found good practices for optimizing the drawing speed [70]. Con-cerning the supplemental layer added by C#, the solution is to change for C++ which is possible because Microsoft provide a C++ Kinect API and be-cause OpenGL has also a C++ API. By using the improvement techniques and in an extreme case changing the programming language the rendering time will decrease allowing a smooth rendering. Because of the short de-velopment time, these improvements were left apart at the moment and a try will be given to them later if the timing allows it.
At the end of this step the final program was able to show a cube follow-ing the head of a person in an AR window as visible in the figure 5.9.
(a) First example
(c) Third example
Figure 5.9: AR window with cube result
The next step is to use organ models and set their position in the user body for display.
5.5
3D Model Creation From DICOM File
Because the software should use DICOM MRI output files, it has to extract informations from files and create a 3D model from these informations, this is the goal of this part of work.
5.5.1 DICOM File Structure
DICOM files are binary containing information about patients with imaging data. The file has a header containing preamble and prefix, then a dataset containing data element [53, 84].
Header
The header contains a preamble and a prefix. They represent the start of the file and contain informations about the following dataset. Figure 5.10 shows the basic file structure.
Figure 5.10: Basic DICOM file structure
http://www.leadtools.com/sdk/medical/dicom-spec1.htm
Preamble The preamble is a 128Byte (B) long field. Its goal is to facilitate access to data in the DICOM file. It can contain information to allow random image access or it can be not used at all. If it is not used, all 128B are set to 0x00 in order to inform the application that the preamble is not used.
Prefix The prefix is a 4B long field initialized to DICM in uppercase in the ISO 8859 G9 repertoire.
Dataset
The dataset represent an instance of a real world object and contains Data elements.
Data element
The data element contains different fields representing an information about the patient or the image data. It is constituted of a tag, an optional value representation, a value length and the value field. Figure 5.11 shows the data element structure.
Figure 5.11: Data element structure
http://dicomiseasy.blogspot.ch/2011/11/introduction-to-dicom-chapter-iii-dicom.html
Tag The tag uniquely defines the element and its properties. It is com-posed with two short numbers, one is the group while the second is the element. Related tags have often the same group number. For example the group 0028 is the image group, the tag (0028,0010) is rows element that is the height of the image) and the tag (0028,0011) is columns element and give the width of the image.
Value representation The value representation is a two characters code defining the data type of the element. The value representation is rec-ommended but can be omitted because each element has a tag which identify it, the tag implicitly defines the value representation. For exam-ple the rows element (0028,0010) has always as value representation US (unsigned short).
Value length Element have length which is defined by the value length field. This is due to the fact that DICOM is binary and not textual like XML where length is useless. Length is always even, so in the case it is a sin-gle character for example, the element length is set to 2 and the value is padded with a space (0x20) or null (0x0).
For more information have a look at the specification at the DICOM home page at http://dicom.nema.org/ (Accessed June 26th, 2014).
Moreover a MRI creates a set of images representing slices of the pa-tient as it can be seen on figure 5.12, thus the whole set has to be used to create the 3D model.
Figure 5.12: MRI slice image example
http://www.mathworks.ch/company/newsletters/articles/accessing-data-in-dicom-files.html
The technical difficulty of this part resides in the algorithm creating 3D volume from the set of slices (ie. 2D image). Once the model is created from the file set in memory, it will replace the cube in the existing AR soft-ware.
After research, an existing project with required features was found on www.codeproject.com [52]. The open source project Medical image visu-alization using WPF parses DICOM files in a folder and allows the creation of a 3D model using the marching cubes algorithm [52].
5.5.2 Marching Cubes Algorithm
The marching cubes algorithm has the goal of creating a 3D model from a 3D scalar field [22, 33], for example it can serve to create a 3D surface model from a medical volumetric dataset, like MRI scans [35].
Principle
The algorithm takes a regular scalar volumetric dataset. The algorithm considers the cube formed by four points in slice Si and four points in slice
Si+1. Note that because the dataset is regular the four points in Si are
adjacent to Si+1[67, Ch. 2, p. 855].
The example used in section 5.5.2, describing the algorithm, use the indexing convention showed in figure 5.13.
Figure 5.13: Indexing convention
http://paulbourke.net/geometry/polygonise/
Methodology
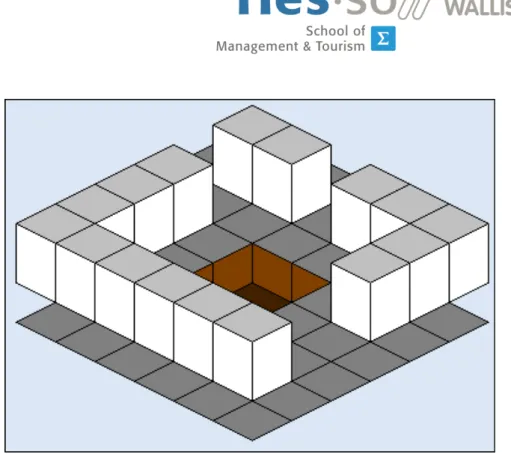
First step The first part of the algorithm maps the vertices under the iso-surface to the intersecting edges of the cube. This mapping produces an 8 bits number where each bit give the position of the cube vertex regard-ing the isosurface, 0 if the vertex is above the isosurface, 1 if the vertex is below. Figure 5.14 shows an example of a cube cut by an isosurface.
Figure 5.14: Isosurface crossing a cube http://paulbourke.net/geometry/polygonise/
The number resulting of this isosurface would equals 8 (0000 1000) because the only vertex below the isosurface is vertex number 3. This number is a cube index and is used as an index for the edge table.
By looking in an edge table, we get a 12 bits number where each bit corresponds to an edge with 1 if the edge is cut by the isosurface or 0 in the other case. In the example showed by figure 5.14, the index of the table is 8 and the value returned by the table will be (1000 0000 1100) which means that edge 2,3 and 11 are intersected by the isosurface.
Second step The second part consist in calculating by liner interpolation the intersection point position by using the formula
P = P1+ (isovalue − V1)(P2− P1)/(V2− V1)
where P1and P2are the vertices of a cut edge and V1 and V2are the scalar
value at each vertex.
Third step Finally, the algorithm forms the facet from the position the iso-surface intersect the grid cell by looking in a table with the possible polygon configuration by using the cube index as the table index. This table return the facet combination in the form of an array of cut vertex. In the example showed by figure 5.14, the result has the value {3,11,2,-1,-1,-1,-1,-1,-1,-1,-1,-1,-1,-1,-1,-1}.
For more information and code example have a look at http://paulbourke. net/geometry/polygonise/, http://www.proxyarch.com/util/techpapers/
papers/survey%20of%20marching%20cubes.pdf and http://www.cs.carleton. edu/cs_comps/0405/shape/marching_cubes.html (Accessed June 27th, 2014).
This software capabilities were tested and screen shots on figure 5.15 present these different capacities .
(a) DICOM viewer
(c) DICOM viewer bone model
(d) DICOM viewer skin model
Figure 5.15: Medical image visualization using WPF Capabilities Screen-shot
After studying the open source Medical image visualization using WPF project two integration solutions were possible. First solution, use its sources, adapt and use them in the current prototype to give it capability of creating 3D models from DICOM files. Second solution, create a DICOM file parser from scratch and use the same marching cubes algorithm to create a 3D model. Because the resulting model from this project has enough quality for a prototype, it was used to keep development time low. A large part of this software was taken and a little was modified to be used in the prototype.
The biggest encountered problem in the resulting model is the tube around the organ. Three ways of removing it were found. The first solu-tion implemented was to find the radius of the tube and remove all triangles at an equal or greater distance. This solution gives a nice result and is quite simple to implement but the cleaning time is quite long (around 30 minutes) probably because it involves two lists. Another solution is to remove the triangles before they are stored in the list representing the model. This so-lution has the disadvantage to imply the modification of the model creation algorithm and the risk of breaking the working software. The last solution is to modify the DICOM file images, and remove the data which creates the tube. This solution has the disadvantage to imply the modification of files or create temporary modified files. The first solution was chosen because of its simplicity and its short development time, but the others are possible improvements. After modifying the cleaning method by using index of the triangle to remove the cleaning time decreases to five minutes. The soft-ware used to create the model uses the Hounsfield scale to select the data to extract and create the model from. For the test, the fixed value 500 was used which gives a skeleton model. A slider allowing the Hounsfield value selection is available during the file selection as seen on figure 5.16.
Figure 5.16: File Selection Window
Figure 5.17: Model Display
Because the organ can be anything from a brain to a knee, the possibil-ity to change the point the model is mapped on was added by using a bullet list as visible on figure 5.18.
(b) Model Mapped to Shoulder Right
Figure 5.18: Model Mapping Example
As the model has no data concerning its size nor its position in the pa-tient body, a slider allowing to resize the model as seen on figure 5.19 and sliders allowing the operator to properly adjust its position on the patient, as seen on figure 5.20 were added to the GUI.
Figure 5.19: Model Resized to 0.4 Times its Original Size
(b) Model moved up on y axis
(c) Model moved down on y axis and left on x axis
Figure 5.20: Model Position Adjustement
At this stage the software uses DICOM files, parses them and creates a 3D model of the organ with the selected Hounsfield value. Once the model
is created, the operator can start the live view, set the body point the model has to be mapped on, and tune its precise position.
Chapter 6
Resulting Software Prototype
The resulting prototype has all functionality described in the appendix A Specification. The following describes the workflow to display a 3D organ model created from DICOM files over a patient’s image with the prototype.When launched the operator has the ability to select the folder contain-ing all DICOM files of the patient by uscontain-ing a file selection window as seen in figure 6.1.
Figure 6.1: File Selection Window
During this selection process the operator can use a slider to select the Hounsfield value of the material he wants to extract from the files. The avail-able range goes from −1000 to +1000. The slider is visible on figure 6.1.
Once files are selected, the software parses them using the DICOM visualizer found on www.codeproject.com. Once parsed it automatically creates the model using the marching cubes algorithm. Once the creation part is over, the software cleans the model to remove the tube around the organ model. During all this process a rotating blue circle indicates oper-ations are running in background. When the cleaning process is over, the resulting model is sent for display and appears on the window as shown on figure 6.2.
Figure 6.2: Cleaned model displayed
Once the model is displayed the operator can select in a bullet list the point on the patient model he wants the model mapped on as it can be seen on figure 6.3.
(a) Model Mapped to Shoulder Left
(b) Model Mapped to Shoulder Right
Figure 6.3: Model Mapping Example
These points are the points the Kinect knows on a body and the position can be easily found by using its API. At this moment the operator can also
resize the model from 0 to 1 by using a slider as shown by figure 6.4.
Figure 6.4: Model Resized to 0.4 Times its Original Size
When the operator wants the live capture to start he presses the button ”start capture” and the Kinect starts capturing frames sending data to the software. The frame data are used by the software to construct the patient model and map the 3D organ model to the patient allowing an AR view of the patient’s organ as seen on figure 6.5.
Figure 6.5: Model Display
During the live capture the operator has the possibility to fine tune the position of the organ model by using three sliders, one for each 3D axis, as shown on figure 6.6.
(b) Model moved up on y axis
(c) Model moved down on y axis and left on x axis
Figure 6.6: Model Position Adjustement
The package Parsing contains classes for parsing a DICOM file and storing its informations in the computer memory ready to use.
The package Helper contains classes to create the 3D model from the informations fetched by the Parsing objects. It contains the MarchingCubes class, responsible for the marching cubes algorithm application on the data ; and a Triangle class containing an array of Point3D objects which repre-sent one of the triangle composing the 3D model created with the marching cubes algorithm.
The MainWindow and OpenFile classes are the background code of each window of the software. The Volume class is creating the 3D model from a set of slices for the specified Hounsfield value. Finally the PointWith-Color structure is a structure containing color and environment position for the patient 3D model reconstruction. As for the CustomEventArgs class, it is launched when the user has selected a files set and contains the path to the files as well as the Hounsfield value selected for the 3D model creation.
Part III
Chapter 7
Evaluation
The resulting software does not present the same quality achievement as the one visible on figure 7.1 and beside the fact that they have a similar objectives they do not use the same principle.
Figure 7.1: Microsoft Augmented Reality
http://spectrum.ieee.org/automaton/robotics/medical-robots/ microsoft-kinect-fusion-augmented-reality-neurosurgeons
The resulting prototype uses the Kinect ability to recognize the body and track different parts of it to map a virtual organ on. The Microsoft version used the first Kinect version, associated with Kinect Fusion and computer vision to display a 3D model over the video provided by the Kinect.
7.1
The Original Idea
The initial idea was, if the position of the body on the screen can be given by the Kinect it should be less computing intensive and quite easy to map a model at these coordinates. Current AR application uses computer vi-sion with image content recognition to display the 3D model at the right place in the image, often with a marker formed by a black and white square pattern. This pattern is recognized by the computer in the image and it ap-plies the transformation to the 3D model before displaying it at the marker place. With the Kinect, because it provides body position and orientation, the marker should not be needed in the case of body tracking, and less computation should be necessary. But the way camera work and the 3D to 2D projection involved to create an image makes my idea not possible as is. With research and discussion about this topic with people who worked in the camera field, the solution, as presented in section 5.4, was to recreate the patient in the virtual world and add on top of it the organ model created from the MRI file. This solution results in the kind of pictures you can see in section 6.
7.2
Kinect Related Issues
7.2.1 The Poor Resolution Issue
The image’s poor quality due to the lack of resolution of the Kinect depth camera. The patient reconstruction uses this camera which has a resolu-tion around 200 000 pixels 4.1 so the result is poor in quality compared to standard current cameras where resolutions are given in mega pixels.
To limit the image degradation due to the small resolution, the size of the viewport was set to the same as the camera resolution. This choice leads to a small window where details are poorly visible.
7.2.2 A Missing Detail
To be really effective, the software should show the model with the patient at any distance of the device, particularly when close to allow the operator to have a closer look at a detail. However, the minimum distance at which this version of the Kinect can work is around 40 cm which is too far for a detailed analysis.
7.3
The Kinect Use in AR
After the prototype issues analysis and the time spent to develop, it is clear that the Kinect version 2 is not really the best choice for use in AR software.
The major reason is because the mapping is generally done in the image by analyzing its content and find one or more key points to map the trans-formed model with this image. Obviously it is possible to use the Kinect as a standard high definition camera with standard computer vision algorithm. The Kinect cost of 199$ in pre-order at the writing date [63] makes it more expensive than a standard 1080p webcam which price is less than 50$ for the less expensive [32].
Moreover, the Kinect is quite big and has to be put on a desk whereas webcams are generally small and designed to be put on a monitor or screwed on wall.
Another point against the Kinect in AR software is that webcams are not SDK dependent, can be used on various systems and are Universal Serial Bus (USB) 2.0 compatible which is not the case of the new Kinect. If you want to use the Kinect you need a Windows 8 computer with USB 3.0 and you have to use the Microsoft Kinect SDK even for a task as simple as getting the video. The SDK is provided in three different programming languages so you have to use one of them. The webcam offers flexibility in term of hardware and software you cannot have with the Kinect.
Finally the Kinect version offers a 1080p resolution which is also avail-able for many current webcams and less expensive. But webcams are evolving faster than the Kinect due to the wider number of manufacturers. With the upcoming 4k resolution we will soon have 4k webcams available on the market at a decent price [54], is Microsoft even thinking to this evo-lution for its Kinect ? This could allow the operator to have a clearer and more detailed view of his work.
7.4
The Marching Cube Algorithm
The marching cubes algorithm is not perfect and in some cases there are ambiguities in the face meshing, which can lead to holes in the mesh. Some algorithms improve these ambiguities such as the asymptotic decider of Nielson and Hamann [68]. There are also different algorithms giving bet-ter results like the Voronoid-based Variational Reconstruction of Unoriented Point Sets [31, 41]. However these algorithms are more complex thus more difficult to implement but could be used as an improvement for future soft-ware.
7.5
Surgeon Use of the System
This kind of system is not very precise due to the limitation of the camera, like the resolution. This kind of system is a possible tool that can give to the surgeon another angle of approach to plan the operation. It cannot replace
the current tools used in surgery because like every kind of tools it has its own usefulness, its strengths, and its weaknesses the user has to be aware of to make a proper use of it.
Chapter 8
Future Work
As mentioned in section 7 Evaluation, the Kinect has some issues and characteristics limiting its use in AR software. This section gives ideas and indicates paths for realizing a more quality oriented system.
8.1
Hardware
As described in section 7.2 about the Kinect issues, the hardware to use could be webcams or high definition webcams. The interest of using we-bcams are, as mentioned in the previous section, reduced cost, platform independence, hardware independence, flexibility, evolution ... By using webcams the range limit of the Kinect is no more a concern and it becomes possible to work on close up and long range (at least more than 4 meters and less than 40 cm). Hardware like the Logitech C615 cost less than a Kinect but provides the same image quality.
The Wii remote controls are able to inform of their position and orienta-tion. By using the same principle they use or by hacking remote controls it could be possible to have patient position information for a 3D mapping.
8.2
Software
Common AR application involves computer vision, which is image acquisi-tion and analyzing, to find relevant informaacquisi-tion like markers or key points in images and add information to these images. In the computer vision field a lot of API are available and on many platforms, Windows, Unix and mobile like iOS and Android.
As example, free open source API like ARToolKik are available and focus on AR applications use. It is a multi-platform API using computer vision to track markers in real time and display 3D content based on the camera position and orientation calculated from the markers position and
orientation [1]. This toolkit should have a try in a future version based on webcams and computer vision because it seems to be quite high level hiding more complicated parts to the programmer.
The more often cited API related to computer vision is OpenCV. It is a free open source multi-language multi-platform API. It can use the hardware acceleration by using OpenVX or OpenCL which were made by the same group that made OpenGL which is a reference in computer graphics. This API seems more active than ARToolKik, and seems also more low level. It seems to be also used in various fields, commercial as well as research [4]. Some books and tutorials are available like Mastering OpenCV with Practi-cal Computer Vision Projects, PACKT Publishing, ISBN : 1849517827. This seems the most powerful open source API available and it really should be explored further.
The advantage of these two API is to accelerate the development pro-cess but the features and algorithms they provides, like SURF and FAST, are quite well known and could be implemented from scratch if necessary, in case of a language or a platform is not supported.
8.3
Mixing Technologies
It is also possible to merge computer vision with the Kinect hability like re-cently found on the video available here http://www.youtube.com/watch? v=aqTMmCWGzKM (Accessed July 15th, 2014). In this video the concept is quite simple. By using computer vision and OpenCV a marker is detected and tracked on the image given by the Kinect. With computer vision it is possible to have the marker coordinates in the image and, by sending them to the Kinect API it is possible to find where is the marker in world coordi-nates. This has the advantage of using only one Kinect to find the world coordinates. But this does not remove the limitations of the Kinect and it is possible to achieve the same work with two or more standard webcams and only computer vision, which keeps the flexibility and the evolution possibility of webcams.
8.4
A Full System to Think About
The full system though, includes multiple specific markers positioned at specific positions of the patient, allowing the system to recognize position and orientation of the patient. Multiple webcams are positioned all around the patient allowing a constant view of the markers on the patient and giv-ing more computgiv-ing precision. The operator could wear hardware like the Google glasses [44] or the Oculus rift [80] which display the augmented images. To allow him to turn around the patient and have a closer look
it could be possible to use markers on the device, or Wii remote controls system like, giving the position and orientation of the operator to the sys-tem. With these data the system can modify the 3D model displayed on the operator display device. To allow a good FPS with a high quality im-age and detailed model the computation could and should be left to a main computer and send to the display device by using a streaming technology.