Lire
la seconde partie
de la thèse
P
ARTIE
2
:
A
NALYSE TRANSCRIPTOMIQUE DES CELLULES DENDRITIQUES DERIVEES DE LA MOELLE OSSEUSE CHEZ DES BREBIS DE LA LIGNEE RESISTANTE ET DE LA LIGNEE SENSIBLE AUXMAMMITES APRES STIMULATION IN VITRO PAR
S
TAPHYLOCOCCUSAUREUS
1 Contexte et objectifs
L’étude de la comparaison des cellules somatiques du lait après infection a permis d’apporter des informations sur les différences exprimées par les cellules du lait, dont les neutrophiles, dans les deux lignées divergentes de brebis. D’autres types cellulaires, qui ne sont pas accessibles par la collecte du lait après infection, peuvent aussi participer aux différences de sensibilité aux mammites. Aussi, en parallèle de la première analyse, nous avons choisi d’étudier les cellules dendritiques car elles ont un rôle important, au carrefour de l’immunité innée et de l’immunité adaptative (Banchereau et al. 2000; Huang et al. 2001).
Les cellules dendritiques ont été découvertes dans les organes lymphoïdes (Steinman et Cohn 1973), mais elles sont également localisées dans les tissus connectifs de tous les organes, sauf le cerveau (Hart et Fabre 1981) et précisément dans les interstices entre les cellules épithéliales mammaires (Joshi et al. 1985). Les cellules dendritiques présentent des antigènes qui peuvent déclencher une réponse immunitaire adaptative (Steinman et al. 1979). En particulier, les cellules dendritiques situées en périphérie de la glande mammaire expriment les molécules du CMH à leur surface (Joshi et al. 1985). La présence de certains marqueurs différencie les cellules dendritiques des macrophages qui les expriment peu ou pas du tout, permettant ainsi de les différencier. Les cellules dendritiques ont la capacité bien connue de stimuler l’activation des lymphocytes T (Steinman et Witmer 1978), mais aussi les neutrophiles (Bohannon et al. 2010) ; et en retour les neutrophiles peuvent modifier le recrutement ou la maturation des cellules dendritiques (Charmoy et al. 2010; Lande et al. 2011). Ainsi il existe un lien étroit entre neutrophiles et cellules dendritiques.
Récemment l’équipe de Schwerin a utilisé un modèle animal comparable au notre pour étudier la résistance aux mammites ; il s’agit de vaches sélectionnées sur les allèles d’un QTL associé au SCS et présent sur le chromosome BTA18 (Kuhn et al. 2008). Cette équipe a montré qu’après stimulation de cultures primaires de cellules épithéliales mammaires, la voie de « maturation des cellules dendritiques » était plus activée chez les vaches résistantes aux mammites que chez les sensibles (Brand et al. 2011). Les résultats de cette étude sont un argument supplémentaire en faveur de l’étude des cellules dendritiques dans les lignées divergentes de brebis.
De plus, il a été montré que les cellules dendritiques de souris ayant une meilleure capacité à éliminer S. aureus secrétaient plus de CXCL2 et favorisaient la réponse Th2, par rapport à celles de souris sensibles à l’infection et qui favorisaient plutôt la voie dite Th1 (Nippe et al. 2011). La réponse de type 1 se traduit par une sécrétion d’IL12 par les CD et un effet pro-inflammatoire plus marqué, tandis que la réponse de type 2 se traduit par une sécrétion d’IL10, qui induit la formation de cellules T régulatrices, et régule la réponse
inflammatoire (Banchereau et al. 2000; Steinman et al. 2003). Ainsi les CD peuvent avoir une action déterminante sur le devenir de l’infection.
Il est possible de collecter in vivo des cellules dendritiques directement à partir du tissu mammaire ou par canulation des vaisseaux lymphatiques, mais les difficultés inhérentes aux techniques pour extraire ces cellules nous ont conduits à utiliser un modèle in vitro qui avait été développé au laboratoire (Foulon et Foucras 2008). Celui-ci permet de générer de nombreuses cellules dendritiques à partir de cellules de la moelle osseuse stimulées avec la cytokine GM-CSF.
Nous avons donc fait l’hypothèse que les cellules dendritiques des brebis de la
lignée résistante, en relation avec leur capacité de détection des agents pathogènes et de transmission du signal, notamment via la voie TLR2 ou du profil des cytokines sécrétées, étaient différentes de celles des brebis de la lignée sensible. Les travaux publiés dans ce
deuxième article ont pour objectif d’évaluer cette hypothèse au niveau transcriptionnel.
2 Résumé
Parmi les brebis qui avaient fait l’objet d’une infection expérimentale, quatre brebis de la lignée résistante et quatre brebis de la lignée sensible ont été choisies pour l’étude des cellules dendritiques (CD). Sept sur huit de ces brebis faisaient également partie de l’étude précédente (Article 1). Des cellules souches de la moelle osseuse ont été différenciées in vitro en CD (Foulon et Foucras 2008). La pureté des cellules après 6 à 7 jours de culture était de 90%. Ces cellules ont été stimulées in vitro avec des bactéries S. aureus inactivées par la chaleur (heat killed S. aureus, HK-Sa). Le contact des CD avec HK-Sa provoque une activation des cellules tout en limitant les effets toxiques qui seraient produits par une bactérie vivante, ce qui permet de limiter les phénomènes d’apoptose et d’obtenir des ARNm de bonne qualité pour les analyses transcriptomiques.
Des CD ont été prélevées avant la stimulation par HK-Sa (T0) et après 3 ou 8 heures de stimulation (respectivement, T3 et T8). Tout d’abord, la réponse des CD a été étudiée au cours du temps. L’analyse de variance a permis d’identifier 3058 gènes dont l’expression variait significativement au cours du temps (p-value corrigée par la procédure de Benjamini-Hochberg < 0.01) et 419 gènes en ne conservant que les gènes dont la variation d’expression était supérieure à 2. Parmi ces 419 gènes, 83% sont activés au cours du temps. Plusieurs gènes sont impliqués dans la réponse pro-inflammatoire (il1α, il1β, il6, tnfα et nkκb), trois sont des marqueurs de la maturation des CD (cd40, cd83 et cdh1), trois sont des colony stimulating
factors (csf1, csf2 et csf3) et sont impliqués dans la différenciation des granulocytes et des
macrophages ; en outre, quatre gènes codent pour des molécules à domaines CXC ou CC (cxcl10, cxcl16) et leurs récepteurs (cxcr5 et ccr7). Parmi les 17 % de gènes réprimés au cours du temps, on peut citer adora3, ccr3, cfos, et sulf2. Les gènes qui évoluent au cours du temps sont principalement impliqués dans les voies de signalisation des interleukines (IL10 et d’IL12), du TNFR1 et 2 et des récepteurs de reconnaissance de bactéries, dans la maturation des cellules dendritiques et la différenciation des cellules T et dans les communications cellulaires entre l’immunité innée et l’immunité adaptative.
Dans un deuxième temps, les répertoires des gènes exprimés par les CD des hôtes résistants et sensibles ont été comparés. Un groupe de 204 gènes différemment exprimés entre les CD des deux groupes de brebis ont été identifiés (p-value corrigée par la procédure de Benjamini-Hochberg < 0.01 et FC > 1.5). Parmi les 204 gènes, 52% sont plus exprimés dans les CD des brebis de la lignée résistante que dans les CD des brebis de la lignée sensible, dont de nombreux gènes du système immunitaire : de la voie classique du complément (c1qa, c1qb
et c1qc) et de sa régulation (cd59 qui était plus exprimé chez les brebis de la lignée résistante après 8h de stimulation), des sous-unités du CMH de classe 1, des gènes de la famille TRAF (traf4, traf7 et traf3ip2), de la famille des motifs tri-partites (trim2, trim39 et trim45) ou de la famille des métallo-protéinases (mmp9 et mmp12). Au contraire, des gènes impliqués dans la migration trans-endothéliale des leucocytes (btk, itgam, vav1, actn1, msn, f11r et cldn1) ont une expression plus élevée dans les CD des brebis de la lignée sensible.
L’étude du transcriptome entre les deux lignées de brebis a aussi été réalisée à chaque temps de stimulation (T0, T3 ou T8). Le nombre de gènes différentiels entre les deux lignées était supérieur pour les échantillons non stimulés (T0) que pour les échantillons stimulés par
S. aureus (153 gènes différentiels entre les lignées à T0, 103 à T3 et 108 à T8) avec une
proportion variable de gènes surexprimés dans les CD des brebis de la lignée résistante (47% à T0, 43% à T3 et 57% à T8). Les principales voies qui différencient les CD entre les lignées sont la voie de signalisation de l’IL17 et des récepteurs des cellules B à T0, la voie de signalisation des intégrines à T0 et T3 et la voie de signalisation du système du complément et de AHR à T8.
3 Article 2
Gene Expression Profiling of Dendritic Cells Reveals Important Mechanisms Associated with Predisposition to Staphylococcus Infections
Toufeer M, Bonnefont CMD, Foulon E, Caubet C, Tasca C, Aurel MR, Robert-Granié C, Rupp R, Foucras G
Plos One, 2011, vol 6, issue 8, e22147 DOI 10.1371/journal.pone.0022147
4 Discussion
L’analyse transcriptomique des CD après stimulation par S. aureus inactivé entre les deux lignées divergentes de brebis a montré des différences d’expression génique par les
cellules dendritiques des deux lignées stimulées par des staphylocoques inactivés par la chaleur.
Tout d’abord, l’étude de la stimulation des CD a montré que celles-ci devenaient plus matures en réponse à la stimulation, qu’elles sécrétaient des cytokines pro-inflammatoires et favorisaient la différenciation des granulocytes/macrophages.
Lors de l’analyse des profils géniques des CD des deux lignées de brebis, le gène TLR2 et sa voie de signalisation n’ont pas été identifiés comme différents. Ainsi la détection de S. aureus par ce récepteur ne permet pas d’expliquer les différences observées. Dans l’analyse globale des CD des deux lignées, aucune interleukine, ni molécule CXC n’étaient significativement différentes, mais le récepteur IL12RB était plus exprimé dans les CD des brebis de la lignée résistante et IL1RAP dans celles des brebis de la lignée sensible. Dans les analyses indépendantes de chaque temps de stimulation, nous avons vu qu’avant la stimulation (à T0), l’expression de l’interleukine IL-6 était supérieure chez les brebis de la lignée résistante par rapport à celles de la lignée sensible, alors qu’après 8h de stimulation le rapport était inversé. Ainsi, aucune différence d’expression des cytokines n’a été clairement démontrée entre les CD des deux groupes. L’absence de différence d’expression de CXCL2, IL10 et IL12 semble montrer que, contrairement au modèle souris sur les capacités d’élimination d’une infection à S. aureus (Nippe et al. 2011), les brebis de la lignée résistante ne favorisent pas la réponse de type 2, même s’il existe une plus forte tendance à l’expression de l’IL-10 dans ce groupe.
Outre les résultats précédents, l’expression de trois sous-unités du complément (c1qa,
c1qb et c1qc) et de ido1 est supérieure dans les CD des brebis de la lignée résistante par
rapport à celles des brebis de la lignée sensible. Le complément a des activités bactéricides dans le lait (Rainard 2003) et il permet la reconnaissance et l’élimination des corps apoptotiques (Reis et al. 2007; Taylor et al. 2000; Castellano et al. 2007) notamment après la phagocytose. Le C1q a aussi la capacité de réguler le seuil d’activation des CD (Castellano et al. 2007). Le gène ido1 quant à lui favorise la différenciation des cellules T régulatrices (Katz et al. 2008). Ainsi les activations du complément et d’ido1 dans les CD des brebis de la lignée résistante permettraient de contrôler l’inflammation en limitant l’activation de la réponse immunitaire.
Les gènes il1rap et myd88 sont plus exprimés dans les CD des brebis de la lignée sensible, or il a été montré chez la souris que, sous forme de dimère dans le complexe IL1R/Myd88, ces éléments participent au recrutement des neutrophiles et à l’élimination d’une infection à Staphylococcus (Miller et al. 2006).
L’expression du gène codant pour la métalloprotéinase mmp12 (aussi appelé
macrophage elastase) est supérieure dans les CD des brebis de la lignée résistante que dans
celles des brebis de la lignée sensible. MMP12 est stocké dans les vésicules de phagocytose des macrophages et a la capacité d’adhérer à la paroi cellulaire des bactéries et de perturber la membrane jusqu’à provoquer la mort de la bactérie (Houghton et al. 2009). Au contraire l’expression du gène mmp9 (aussi appelé gelatinase B) était supérieure chez les CD des brebis de la lignée sensible, mais le rôle de cette metalloprotéinase dans les infections n’est pas connu.
De plus, l’expression de deux gènes codant pour les claudines (cldn4 et cldn5) et un gène codant pour les motifs tri-partites (trim2) est supérieure chez les CD des brebis de la
lignée résistante alors que celle de cldn1 est inférieure après 3h d’exposition à S. aureus tué par la chaleur et celle de trim39 et trim45 est inférieure sur l’ensemble des données. Les claudines sont des protéines membranaires qui jouent un rôle dans les jonctions serrées entre cellules (Elkouby-Naor et Ben-Yosef 2010), il a été montré que CLDN4 était présente lors de l’endocytose de S. aureus (Clark et al. 2009), mais leur rôle en réponse à une infection mammaire n’est pas clairement établi. Les motifs tri-partites sont présents dans le cytoplasme et possèdent trois domaines de fixation du zinc. Le rôle de TRIM2 n’est pas connu, il semblerait que TRIM39 facilite l’apoptose par stabilisation de MOAP1 (Lee et al. 2009) et que TRIM45 soit un répresseur transcriptionnel de MAPK (Wang et al. 2004).
En outre, le gène traf4 est plus exprimé dans les CD des brebis de la lignée résistante, contrairement aux autres gènes de la famille des TNF (tumor necrosis factor) receptor associated factor le seul rôle connu de TRAF4 dans l’immunité est qu’il facilite la migration des cellules dendritiques (Cherfils-Vicini et al. 2008). Au contraire, huit gènes impliqués dans la migration des leucocytes à travers la barrière épithéliale étaient plus exprimés dans les CD des brebis de la lignée sensible que des brebis de la lignée résistante. Ainsi l’interprétation de l’expression des gènes des CD pouvant favoriser la migration des neutrophiles est complexe et difficilement interprétable.
En résumé, les capacités de détection des agents pathogènes via la voie de TLR2 et les profils des cytokines canoniques ne sont pas différents dans les cellules dendritiques des brebis de la lignée résistante et de la lignée sensible. En revanche l’activation de la voie du complément est supérieure dans les cellules dendritiques des brebis de la lignée résistante et il semble que le contrôle de l’inflammation via IDO1 et la différenciation des cellules T régulatrices soient mieux exprimés dans les cellules dendritiques des brebis de la lignée résistante.
P
ARTIE
3
:
C
ELLULES EPITHELIALES MAMMAIRES ET RESISTANCEAUX MAMMITES
:
ANALYSE TRANSCRIPTOMIQUE APRES INFECTIONEXPERIMENTALE IN VITRO PAR
S
TAPHYLOCOCCUS AUREUS OUSTIMULATION PAR SON SURNAGEANT DE CULTURE
1 Contexte et objectifs
Dans les chapitres précédents, nous avons examiné les profils géniques de cellules immunitaires. Même si les CEM ne sont pas considérées comme des cellules à compétence immunitaire, il est indéniable qu’elles jouent un rôle important dans le déclenchement de la réponse immunitaire grâce à la production d’un certain nombre de médiateurs. Elles tapissent entièrement la paroi interne du trayon, des canaux galactophores et des alvéoles mammaires (Korhonen et al. 2000). Elles sont ainsi en première ligne lorsque les agents pathogènes pénètrent par le canal du trayon dans la glande. Elles ont un rôle à la fois de barrière car elles empêchent les bactéries de passer plus profondément dans le stroma ; elles peuvent aussi jouer un rôle de sentinelles car elles ont la capacité de sécréter certaines cytokines dans le milieu intérieur, notamment l’interleukine 8 (IL-8, CXCL8), qui recrute les neutrophiles circulant vers la zone d’infection. Elles peuvent également activer directement les cellules dendritiques (Hammad et Lambrecht 2011) résidentes dans le tissu mammaire.
Aussi, de nombreuses études sur la réponse de l’organisme aux agents pathogènes des mammites ont utilisé les CEM comme modèle cellulaire car elles peuvent être prélevées et cultivées in vitro assez facilement (Boudjellab et al. 2000; Bougarn et al. 2010; Griesbeck-Zilch et al. 2008; Gunther et al. 2009; Lahouassa et al. 2007; Pareek et al. 2005; Rainard et al.. 2008; Swanson et al. 2009; Weber et al. 2006).
Ainsi pour compléter l’inventaire des types cellulaires évalués dans les études comparatives des brebis de la lignée résistante et des brebis de la lignée sensible aux mammites, nous avons décidé d’inclure les cellules épithéliales mammaires afin i)
d’analyser leur réponse à une infection par Staphylococcus aureus ou ses produits de sécrétion présents dans le milieu de culture et ii) d’identifier les différences d’expression entre les deux lignées à la suite de ces stimulations.
Pour cela, des CEM ont été isolées à partir du tissu mammaire de brebis des deux groupes en lactation, puis cultivées in vitro et infectées par S. aureus ou stimulées par son surnageant de culture.
2 Résumé
Les CEM ont été isolées du tissu mammaire de six brebis de la lignée résistante et six brebis de la lignée sensible au début de leur première lactation. Les cellules épithéliales mammaires (CEM) des douze brebis ont été isolées et cultivées in vitro jusqu’à la confluence (Lahouassa et al. 2007). Cinq modalités de stimulation ont été examinées : la première n’a fait l’objet d’aucune stimulation et a été prélevée après 1h de culture (Tref) par rapport au début de l’essai ; deux autres ont été stimulés par S. aureus vivant (Sa) après 1 et 5 heures respectivement alors que les deux autres ont été stimulés par le surnageant de culture (Sp) pour les mêmes durées. Les échantillons seront ainsi désignés selon la durée de la stimulation
(1 ou 5h d’exposition) et la nature du stimulus (les bactéries, Sa ou le surnageant, Sp) : T1Sa, T5Sa, T1Sp et T5Sp.
Dans les CEM stimulées par Sa vivant, 531 gènes avaient une expression qui variait au cours du temps (p-value corrigée par la procédure de Benjamini-Hochberg < 0.01 et fold-change > 1.5) contre 687 après stimulation par le surnageant de culture. La voie de signalisation de IGF1 et la régulation des points de contrôle des dommages de l’ADN ont été modifiées par la co-culture avec Sa, et les voies de signalisation des interleukines, des TLR, de CD40, des TNFR1 et 2, de NFκB et de l’apoptose stimulée par MYC ont été modifiées par l’ajout de surnageant. De plus, seulement 13% des gènes de CEM sont activés dans le temps après contact avec Sa, alors que 59 % le sont avec le surnageant ; de même, 68% sont réprimés avec Sa contre 30% avec Sp. L’expression des autres gènes différentiels fluctue au cours du temps, ainsi le maximum ou le minimum d’expression est atteint après 1h. Environ la moitié des gènes différentiels (n=286) sont communs aux deux stimulations. Ensuite, ces listes de gènes ont été organisées en clusters qui regroupent des gènes dont l’expression est très similaire au cours du temps. Brièvement, les gènes impliqués dans la régulation du cycle cellulaire et les processus cataboliques étaient réprimés dans les CEM pour les deux stimulations, alors que les gènes des processus métaboliques étaient activés. Les voies de l’apoptose étaient fortement modifiées par la stimulation bactérienne, car de nombreux gènes réprimés ou activés étaient impliqués dans la régulation de cette voie. Des gènes impliqués dans la réponse cellulaire au stress étaient plutôt réprimés après stimulation par la bactérie vivante, et plutôt activés après stimulation par le surnageant de culture. Enfin des gènes impliqués dans la réponse immunitaire et notamment dans la régulation de la chimiotaxie étaient activés dans les CEM en présence de Sa.
La comparaison des profils d’expression des CEM entre les deux lignées de brebis a montré que 20 gènes seulement étaient différemment exprimés entre les lignées, avec seulement trois gènes plus fortement exprimés dans les CEM des brebis de la lignée résistante (cat, plet1 et ppa1). Une analyse fonctionnelle des 20 gènes différentiels montre que 15 d’entre eux peuvent être regroupés au sein d’un même réseau, dont la principale fonction est la régulation de l’inflammation. De plus, une comparaison entre lignées effectuée au sein de chacune des 5 conditions de temps et de stimulations a permis d’apporter quelques éléments complémentaires : un plus grand nombre de gènes différentiels entre lignées a été observé après 5h (n=17) qu’après 1h (n=11) d’exposition des CEM à Sp, et une sous-unité non classique du CMH de classe 1 était plus exprimée dans les CEM des brebis de la lignée résistante que dans celles des brebis de la lignée sensible dans les conditions Tref, T1Sa et T5Sa.
3 Article 3
Genetic susceptibility to Staphylococcus aureus mastitis in sheep: transcriptional profiling of mammary epithelial cells in response to living cells or culture supernatant
Bonnefont CMD, Rainard P, Cunha P, Gilbert F, Toufeer M, Aurel MR, Rupp R,
Foucras G
Soumis le 18 juillet 2011 à Physiological Genomics Refusé
Puis re-soumis le 25 octobre 2011 à Physiological Genomics Retour avec des corrections à effectuer le 17 novembre 2011
Genetic susceptibility to S. aureus mastitis in sheep:
differential expression of mammary epithelial cells in response to
live bacteria or supernatant
Cécile MD Bonnefont1,2,3, Pascal Rainard4, Patricia Cunha4, Florence Gilbert4, Mehdi Toufeer2,3, Marie-Rose Aurel5, Rachel Rupp1, and Gilles Foucras1,2
1 INRA, UR631, SAGA, F-31326 Castanet-Tolosan, France 2 INRA, UMR1225, IHAP, F-31076 Toulouse, France 4 INRA, UR1282, IASP, F-37380, Nouzilly, France
5 INRA, UE321, Domaine expérimental de la Fage, F-12250, Roquefort, France CMDB: [email protected] PR: [email protected] PC: [email protected] FG: [email protected] MT: [email protected] MRA: [email protected] RR: [email protected] GF: [email protected] Running title
Epithelial transcriptome in mastitis resistant and susceptible sheep
Contact information
Address for reprint requests and other correspondence: G. Foucras, UMR1225 INRA-INP-ENVT, IHAP, 23 chemin des capelles, 31076 Toulouse cedex 03, France, (E-mail: [email protected]). Tel: +33 561 193 902, fax: +33 561 193 834.
Abstract
Staphylococcus aureus is a prevalent pathogen for mastitis in dairy ruminants, and is
responsible for both clinical and subclinical mastitis. Mammary epithelial cells (MEC) represent not only a physical barrier against bacterial invasion, but are also active players of the innate immune response permitting infection clearance. To decipher their functions in general and in animals showing different levels of genetic predisposition to Staphylococcus in particular, MEC from ewes issued from a divergent selection on milk somatic cell count were stimulated by S. aureus. MEC response was also studied in function of the stimulation condition with live bacteria or culture supernatant. The early MEC response was studied during a five-hour time course by microarray to identify differentially expressed genes with regard to the host genetic background and in function of the conditions of stimulation.
In both conditions of stimulation, metabolic processes were altered, the apoptosis-associated pathways were considerably modified, and inflammatory and immune responses were enhanced with the up-regulation of il1a, il1b and tnfa and several chemokines known to enhance neutrophil (cxcl8, cxcl3) or mononuclear leukocyte (ccl20) recruitment. Genes associated with oxidative stress were increased after live bacteria stimulation whereas immune response-related genes were higher after supernatant stimulation in the early phase. Only twenty-three genes were differentially expressed between resistant and susceptible animals without any clearly defined role on the control of infection. To conclude, this suggests that MEC may not represent the cell type at the origin of the difference of mastitis susceptibility, at least as demonstrated in our genetic model. Supernatant or heat-killed S.
aureus produce biological effects that are essentially different from those induced by live
bacteria.
Keywords:
Mammary epithelial cell, S. aureus, mastitis, genetic predisposition, microarray
Abbreviations:
DC: dendritic cell
DEG: differentially expressed gene IMI: intramammary infection MEC: mammary epithelial cell MSC: milk somatic cell
PI: post infection PS: post stimulation
SCC: somatic cell count SCS: somatic cell score
Sp: Staphylococcus aureus culture supernatant
Introduction
Mastitis is considered the most costly disease of dairy cattle (4, 18, 63) and sheep (6). Infections are associated with huge changes in the defence system of the mammary gland (52) and cause a reduction in milk yield (63) and quality (6). Amongst mammary pathogens,
Staphylococci, particularly S. aureus, are the most prevalent bacteria for intramammary
infections (IMI) in small ruminants (6); they often lead to chronic infections and a strong increase in the somatic cell count (SCC) (53). After infection, somatic cells, mainly polymorphonuclear neutrophils (38, 47, 55) are recruited to the mammary gland through the local synthesis of chemokines such as interleukin 8 (IL-8, CXCL8) (37). MEC line the lumen of the mammary gland and represent the first and most abundant cell type in contact with invading bacteria and their secreted products (29). MEC has the ability to synthesize CXCL8
in vitro (26). MEC may contribute actively to the early immune and inflammatory responses
of the mammary gland via the synthesis of proinflammatory cytokines and then by promoting neutrophil recruitment (27, 31, 32, 37, 45).
S. aureus IMI have already been studied in small ruminants (8, 41), The complexity of
the mammary defence and the dynamic crosstalk between host cells and the pathogen (2) make the study of mastitis particularly difficult. To offset part of these issues, in vitro models of MEC cultures have been largely used to study the interaction of Escherichia coli or S.
aureus with the host cells (11, 24, 27, 31, 54, 62). Although the interaction of MEC with live
bacteria has already been studied in several reports (31, 33, 36), heat-killed bacteria (24–27), and pathogen-associated molecular patterns (PAMP) such as lipopolysaccharide (LPS) for E.
coli or lipoteichoic acid (LTA) for S. aureus (1, 11, 13, 32, 39, 43, 62), or supernatant (Sp)
(36) are more commonly used. The recourse to synthetic or inert stimuli avoids bacterial development in the culture medium, and ensuing consumption of nutrients by the bacteria or release of high toxic compounds. However, they do not cover the full array of bacteria-cell interactions, and the difference between both types of stimulus is poorly known (36).
At the host level, mastitis outcomes depend not only on the virulence of the bacteria, but also on the strength and timely development of the host’s defences. Thus, genetic improvement is considered to be an interesting option of diminishing mastitis frequency. In this context, we have developed a divergent selection protocol of Lacaune dairy sheep based on somatic cell score (SCS) extreme breeding values (49). Staphylococcal IMI and abscess development were more frequent in high SCS animals than in low SCS animals (49, 8) and bacterial count after experimental infection with S. aureus was significantly lower in the low SCS animals (8). Therefore, high SCS animals were associated with higher susceptibility to mastitis. Up to day, two experiments were performed on these sheep lines to investigate associated gene mechanisms that operate in response to Staphylococcus infection in animals with a different degree of susceptibility. After intramammary inoculations of S. epidermidis or
dendritic cells (DC) were also analyzed after stimulation by S. aureus to describe gene reprogramming in cells of the monocytic lineage (58).
Until now, very few works have addressed the question of mastitis resistance and measurement of gene expression in ruminants. Recently, another group has established two models in dairy cattle to address the same question. In the first approach, cows were chosen according to extreme breeding values for SCS (25) and in the second one, a QTL localised on BTA18 was used to distinguish two groups of cattle on their susceptibility to mastitis (14, 25, 30). MEC of cows with resistant or susceptible alleles at the BTA18 QTL were examined in
vitro after they were stimulated by either heat-killed S. aureus or E. coli over a period of
24hrs (14).
Thus, the model of divergent sheep lines represents an interesting opportunity to examine the response of MEC to Staphylococcus infection in relation to genetic predisposition to mastitis. Therefore, MEC were isolated from ewes in the two divergent lines and were stimulated in vitro with S. aureus to compare their response. We evaluated the MEC response to two different kinds of stimuli, either live bacteria or their soluble factors that are present within the culture supernatant. To look into the network of genes that coordinate the early immune and inflammatory response of MEC upon interaction with live S. aureus or its culture supernatant, gene expression profiling was done using an ovine-specific microarray.
Material and Methods
Animals and sample collection
Mammary epithelial cells (MEC) were obtained from primiparous dairy ewes at onset of lactation. The animal model has been previously described (49). Briefly, animals were from a divergent selection of French Lacaune ewes based on extreme breeding values for the SCS. Previous studies indicated that the low SCS ewes (designated in this paper as “resistant”) are characterized by enhanced mastitis resistance when compared to the high SCS ewes (designated as “susceptible”) (49) and show a lower frequency of infection in natural conditions (49) and a lower bacteriological count after experimental infection (8). Here, two groups of six ewes with no parental links were chosen from the resistant and susceptible lines. Mammary parenchyma was collected after the ewes had been slaughtered.
Isolation and culture of ovine MEC
Mammary tissue was obtained upon slaughter. The ewes were sacrificed in the Institute’s slaughterhouse as per established standards and in compliance with the policies of INRA’s Animal Care Committee. Ovine MEC were isolated from mammary secretory tissue as previously described for bovine MEC (31). After one passage, cell cultures that displayed the typical cobblestone morphology at confluence (Additional File 1) were cryopreserved in liquid nitrogen. Then they were expanded and prepared for stimulation as described (12) and were used at their third passage. After thawing, MEC were multiplied in growth medium comprising Advanced DMEM/F12 medium (Gibco, Invitrogen, Carlsbad, CA, USA) which contains albumin (0.4 mg/ml), supplemented with 2 mM L-glutamine, 10 ng/ml IGF-1
(Peprotech, Rocky Hill, NJ, USA), 5 ng/ml fibroblast growth factor (Peprotech), 5 ng/ml human recombinant epidermal growth factor (Sigma-Aldrich, St. Louis, MO, USA), 1 µg/ml hydrocortisone (Sigma), and 20 mM HEPES (Cambrex Biowhittaker, East Rutherford, NJ, USA). Cells were seeded in 6-well tissue culture plates (5 x 10⁵ cells/well) and cultured until confluence. Then the growth medium was replaced with stimulation medium composed of Advanced DMEM/F12 medium with 2mM L-glutamine, 20 mM HEPES, and 4 ng/ml hydrocortisone as additives 18 hours before stimulation.
Bacterial strain, culture conditions and stimulation of ovine MEC
The S. aureus strain Sa9A was isolated from the milk of a mastitic ewe. The isolate was typed by PCR and shown to be of the agr2 group (23) and to possess the genes for the hemolysins hla and hlb, and for the leukotoxins lukE/D and LukM/F’ but not for the Panton-Valentine leucocidin. It produced a supernatant after overnight culture in Brain Heart Infusion broth with a cytotoxic titer of 80 to bovine neutrophils (moderate activity), determined as described previously (42).
For the preparation of bacterial culture supernatant, Sa9A bacteria were cultured for 7 hours in Advanced DMEM/F12 medium. When the culture was discontinued, the optical density at 660 nm was 0.513, approximately half of the OD value reached at the stationary phase. Following centrifugation at 4000 x g for 20 min at 4°C, the supernatant was sterile filtered (0.2 µm) and stored in aliquots at -70°C. Live bacteria were grown overnight in Advanced DMEM/F12, washed once in Dulbeccos’s phosphate buffered saline and adjusted to the concentration of 3 x 10⁵ cfu/ml in Advanced DMEM/F12 by reference to the absorbance value at 660 nm and with retrospective checking by means of cfu plate assays.
For the stimulation experiments, ovine MEC were incubated with either live bacteria (Sa samples) or bacterial supernatant (Sp samples) for 1 (T1 samples) or 5 (T5 samples) hours. Just before stimulation, the medium was removed from the confluent epithelial monolayers and replaced with fresh medium plus stimulus. The final concentration of bacteria was 3 x 10⁵ cfu/ml, i.e. equivalent to an initial multiplicity of infection of 1 cfu per cell. The final concentration of the bacterial supernatant was 20% in Advanced DMEM/F12 during incubation with MEC. After 1 h and 5 h of incubation, the cell culture medium was pipetted out, sterile filtered and stored at -70°C. The monolayers were washed twice with HBSS, and cells were harvested for RNA extraction. The control cell culture consisted of MEC which received fresh culture medium at time 0 and were harvested 1 h later (Tref samples), at the same time as cells which had been incubated for 1 h with live Sa9A or bacterial supernatant.
Quantification of CXCL8 and CXCL3 by ELISA
The sandwich ELISA for CXCL3 (previously known as GROγ), the “constitutive/inducible” chemokine in milk of dairy ruminants, was carried out as previously described (44). Cell culture supernatants were tested undiluted. Concentrations of the chemokine CXCL8 were determined as for CXCL3 except that commercial antibodies were used to set up the sandwich ELISA. Microtiter plates (96-well; NuncTM Immunoplate Maxisorp) were coated with a monoclonal antibody (clone 8M6; MCA1660, Serotec, Osford, UK) at the concentration of 2 µg/ml in Na carbonate/bicarbonate buffer 0.1 M pH 9.6 overnight at 4°C. After blocking the plates with phosphate buffered saline (PBSG) supplemented with 0.5% (w/v) gelatin (Gibco), samples diluted 2 to 10 fold in PBSG were incubated for 2 h at 37°C. Recombinant bovine CXCL8 (44) was used to establish a standard
curve. Rabbit anti-ovine CXCL8 (AHP425; Serotec) diluted 1/2000 in PBSG was used as the detection antibody. After an 1-h incubation at 37°C and washes, anti-rabbit IgG-peroxidase conjugate (Jackson Immunoresearch) diluted 1/20000 in PBSG was incubated for 30 min at 37°C. Finally, the ELISA was revealed by incubation with TMB ELISA substrate (Uptima, Interchim, Montluçon, France). After addition of stop solution, optical density was read at 450 nm with a plate reader (Multiskan RC, Labsystems, Helsinki, Finland).
Microarray analysis
RNA extraction, amplification, labelling and RNA quality
Total RNA was extracted by a double extraction method using first Trizol (Invitrogen) and then RNeasy columns (Qiagen). Quantification was performed using a spectrophotometer (NanoDrop Technologies) and RNA quality was assessed using an Agilent Bioanalyzer 2100. The RNA Integrity Number (RIN) index was 8.6 ± 1.4 (m ± sd). Two hundred ng of RNA were converted into double-stranded cDNA and amplified with the Quick Amp Labelling kit, two colors (Ref : 5190-0424, Agilent Technologies®) and RNA was then labelled with Cy3 and Cy5.
Hybridization, scanning and raw data storage
Sixty microarrays were hybridized using the ovine oligonucleotide slide (ref 019921, Agilent Technologies®) in a two-colour dye-swap experimental design. On each microarray, two samples from the same experimental condition, one from a resistant ewe and the other from a susceptible ewe were hybridized simultaneously (Additional File 2). Chips were hybridized at 65°C for 17 h and then washed according to the manufacturer’s protocol. Intensity values were recorded with a 4000B Axon scanner. Two channel images were imported into the Agilent’s Feature Extraction software for spot finding and alignment. One microarray was removed from the analysis due to poor hybridization quality.
Only 8,547 genes among the 15,008 different probes that are present on the ovine oligoarray, were annotated with the Human ortholog Gene Nomenclature Committee (HGNC) (http://www.sigenae.org/, sheep oligo annotation version 7 of 2011/03/02) (16). We obtained additional information on un-annotated probes using the Basic Local Alignment Search Tool programme on the NCBI website (http://blast.ncbi.nlm.nih.gov/Blast.cgi) and using the ENSEMBL website (http://www.ensembl.org/index.html).
Statistical analysis of microarray data
Raw data from Agilent’s Feature Extraction were imported in R (version 2.9.0) through the LIMMA package (51). For each sample, probes were flagged if their intensity was of good quality, unsaturated and uniform. Flagged probes were conserved for further analysis. A total of 4,225 out of 15,008 probes were retained. Previously, the same probe filter was performed on other datasets and it enabled to retain much more genes in other cell types like DC and MSC. Lowess normalization without background correction was applied to raw intensity data to correct the dye effect. Then T-quantile normalization was applied considering the five class-conditions (Tref, T1Sa, T5Sa, T1Sp and T5Sp) to correct the array effect. A log2 transformation of data was applied and then pre-processed data were imported in SAS (version 9.1). The log2-intensity of each dye was analyzed separately, since Bossers et al.
showed that this method enhanced the reproducibility and the sensitivity of the detection of differentially expressed gene (DEG) analysis when compared to ratio-based analysis (9). Differences of expression in MEC were analyzed probe by probe by an analysis of variance using the SAS MIXED procedure. First, MEC responses to infection were studied separately in the “live bacteria” condition (Tref, T1Sa, T5Sa) designed by Sa or “supernatant” condition (Tref, T1Sp, T5Sp) designed by Sp using an ANOVA model including the time effect (M1.1). Then stimulation forms were compared within time effect; an ANOVA was performed with T1 and T5 data to analyse T1Sa vs T1Sp and T5Sa vs T5Sp (M1.2). Finally, the differences between resistant and susceptible animals were analyzed using two models; the first model (M2.1) included a global line effect, a time*stimulation effect and the color effect; in the second model (M2.2) the line effect was fitted within the time*simulation condition:
M1.1: log2(inorm) = µ + Time + Color
M1.2: log2(inorm) = µ + Stimulus(Time) + Color
M2.1: log2(inorm) = µ + Line + TimeStim + Color
M2.2: log2(inorm) = µ + TimeStim + Line(TimeStim) + Color
Log2(inorm) was the normalized intensity of a probe; Time was either Tref, T1Sa and T5Sa or Tref, T1Sp and T5Sp, Stimululus was Sa or Sp, Line was resistant or susceptible, TimeStim represented the 5 conditions: Tref, T1Sa, T5Sa, T1Sp and T5Sp and Color stood for the dyed label: Cy3 or Cy5.
All p-values were corrected with the Benjamini-Hochberg FDR procedure (40). Fold-changes (FC) were computed as the ratio of the ANOVA-estimated-log2-intensity of samples from two conditions. For the time analysis, the numerator was the latest time and the denominator the earliest time, so a positive FC meant an up-regulation during the time-course. For the stimulation analysis, the numerator was Sa and the denominator Sp. For the line effect analysis, the numerator was the resistant ewes and the denominator, the susceptible ewes. Probes were declared to be differentially expressed if their corrected p-values were below the threshold of 0.05 and if their absolute FC was superior to 0.585, which corresponds to a minimal 1.5-fold increase in gene expression in one of the conditions.
Furthermore, as few DEG between resistant and susceptible animals were identified, gene set enrichment analysis (GSEA) was performed. It was based on the list of genes found in the ANOVA (Model 2.1) with a Benjamini-Hochberg corrected p-value inferior to 0.05 (n = 596 probes, with 537 HGNC annotated genes). Gene sets with at least 15 genes were retained for analysis. The p-value was calculated by computing the enrichment score in 1,000 phenotype permutations. Gene sets with a p-value inferior to 0.05 were declared as significantly enriched.
The experiment was deposited in GEO at the identifier number GSE30390 (BioArray Software Environment - version SIGENAE).
Biological interpretation of the focus genes
Two hierarchical clustering of the DEG in the time course based on the Pearson-centred distance metric and centroid linkage rule were performed with GeneSpring®. Samples were averaged to present mean values for Tref, T1 and T5. Using the heatmap, genes
were sorted into clusters that showed different time profiles and these clusters were interpreted with the available biological information.
Canonical pathway analysis was performed using Ingenuity Pathways Analysis (IPA, Ingenuity® Systems, www.ingenuity.com). Canonical pathways analysis identified the pathways from the IPA library of canonical pathways that were most significant to the data set. DEG associated with a canonical pathway in Ingenuity’s Knowledge Base were considered for the analysis. As all spots of the Agilent microarray were not annotated, the whole slide cannot be used as a reference database for the canonical or function analysis. Human databases were used as references. The significance of the association between the data set and the canonical pathways was measured in two ways: i) a ratio of the number of molecules from the data set that mapped to the pathway over the total number of molecules that map to the canonical pathway; and ii) Fisher’s exact test was used to calculate a p-value determining the probability that the association between the genes in the dataset and the canonical pathway could be explained by chance alone. Only the canonical pathways with a ratio superior to 10% and a p-value inferior to 0.05 were presented in this paper. About network analysis a score is calculated for the significance of the network. The higer the score is, the more significant it is.
Gene Ontology analyses were performed using DAVID (Database for Annotation, Visualization and Integrated Discovery) (http://david.abcc.ncifcrf.gov/). The singular enrichment analysis and the modular enrichment analysis tested the enrichment of each annotation term in a linear model and led to establishing relationships between genes with similar biological functions. Thereafter, we considered that a gene list was enriched for an annotation term if this term was represented by at least three genes and had an EASE Score inferior to 0.05. The gene lists and the biological functions of the DEG in the time course after stimulation by Sa or Sp were compared by generating Venn diagrams. To further interpret these data, the sense of the regulation (up or down) was considered.
Overrepresented transcription factors that are known to bind to the promoter regions of the listed focus genes were identified with InnateDB (http://www.innatedb.com). This analysis was performed to all DEG during the time course following stimulation by Sa or Sp. First, two lists were created by pooling the genes from the down-regulated (C0 and C1 from Sa experiment, and CA and CD from Sp experiment) and up-regulated (C4 and C5 from Sa experiment, and CB and CC from Sp experiment) clusters. Then the genes were annotated by ENSEMBL and the files with p-values and annotations were imported in InnateDB. The hypergeometric algorithm was applied to the data and the p-values were corrected by Benjamini-Hochberg at 5%.
Reverse transcription
cDNA was generated from 300ng of total RNA using the Superscript III First Strand Synthesis System Kit (Invitrogen) and random hexamer primers, and following the manufacturer’s instructions. The relative mRNA expression levels were verified for Tref, T5Sa, T1Sp and T5Sp samples. The gene expression of T1Sa samples was measured only for
cxcl3 and cxcl8; for the other genes it was not measured because too few differences were
observed when compared with the Tref samples after microarray analysis.
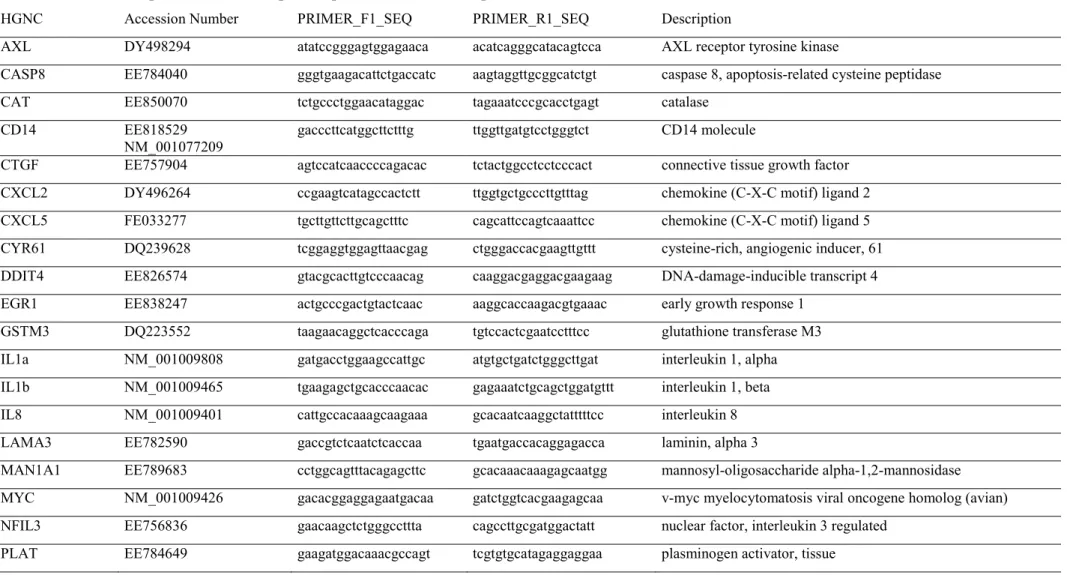
For quantification of mRNA transcripts, primer pairs were designed using Primer3 (48) based on the relevant ovine mRNA sequences and synthesized commercially (Eurogentec). The specificity of designed primers was checked with BLAST
(http://blast.ncbi.nlm.nih.gov/) and Primer Express® v2.0. For some genes for which ovine sequence was not available, a comparative gene alignment of bovine, human, rat and mouse sequences was performed, and primers were then designed on the most conserved regions between these species. Optimal annealing temperatures were determined for each primer pair, and the primers were checked for the absence of primer dimers and efficiency before use. The primers used in RT-qPCR experiments are listed in Table 1.
RT-qPCR was performed following two different protocols depending on the number of genes to be tested. When measuring expression of a small number of genes, an Applied Biosystems 7300 Real time PCR system was used. All assays were carried out in duplicate and each reaction contained 5 µl of diluted cDNA with 2.5 µl (0.5 µM) of each forward and reverse primer along with 12.5 µl of Power SYBR® Green PCR Master Mix (Applied Biosystems).
The high-throughput microfluidic BioMark™ qPCR platform (Fluidigm) was used for qPCR analysis running the 48.48 dynamic array. Methods were essentially as described before (57). Briefly, cDNA from all samples was pre-amplified using a pool of forward and reverse primers. After priming the empty dynamic array, 5 µl of sample reaction mixtures were then loaded into the sample wells carefully avoiding any bubbles, 5 µl of primer reaction mixtures were loaded into the assay wells and the NanoFlex™ 4-IFC Controller was used for loading and mixing. The loaded dynamic array was then transferred onto the BioMark™ HD system. For both approaches, the qPCR cycling program was 10 min at 95 °C for activation of the hot-start enzyme, followed by 40 cycles of denaturation at 95 °C for 15 s, annealing at 60 °C for 1 min, and elongation at 72 °C for 20 s. Melting curve analysis was performed after completion of the qPCR by collecting fluorescence intensities between 60 and 95 °C.
RT-qPCR data analysis and normalization
The stability of six house keeping genes (gapdh, hprt, rp19, rp26, sdh and tyr), previously mentioned in the literature, was checked in our 48 samples and data obtained was analyzed by GeNorm (http://medgen.ugent.be/~jvdesomp/genorm/) (59), a software package freely available for research use. Hence, RT-qPCR data were normalized against the four most stable genes (rp19, rp26, tyr and gapdh) as determined by GeNorm analysis. Specific amplification of each targeted cDNA was confirmed by melt curve analysis. Measured Ct values were exported from the BioMark™ software to Excel for data analysis. qPCR technical replicates of samples were averaged and expression ratios were calculated by the delta delta Ct method normalized to the multiple housekeeping genes (59) tests with the NPAR1WAY procedure of SAS® (v.9.1). The values were expressed as a ratio of the sample with the reference made of susceptible animal samples at Tref.
Results
1- MEC response to Staphylococcal stimulations
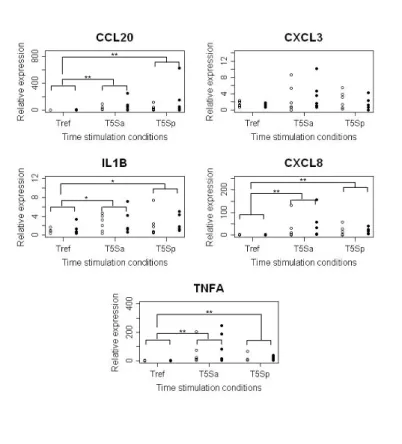
MEC were cultivated in vitro and stimulated with Sa or Sp. MEC were collected without any stimulation (Tref) or at 1 or 5 hours post-stimulation (T1, T5). To ascertain that MEC responded to the stimulations, the expressions of five genes were measured by RT-qPCR (ccl20, cxcl3, cxcl8, il1b and tnfa) at Tref and T5 (Figure 1). The genes cxcl8, ccl20,
il1b and tnfa were significantly up-regulated at T5 with both Sa and Sp (p-value < 0.01,
except for il1b p-value < 0.05). The amplitude of gene expression was weak for il1b with a FC between T5Sa vs Tref and T5Sp vs Tref near to 2, whereas it was high for ccl20 and tnfa after Sa stimulation with a FC (T5Sa vs Tref) around 15 and 100, respectively. Neither comparison (between lines or stimulations) was significantly different. Expression of CXCL3 and CXCL8 was also confirmed by ELISA at the protein level after 5 hours of stimulation (data not shown).
1-1 MEC stimulation with live bacteria
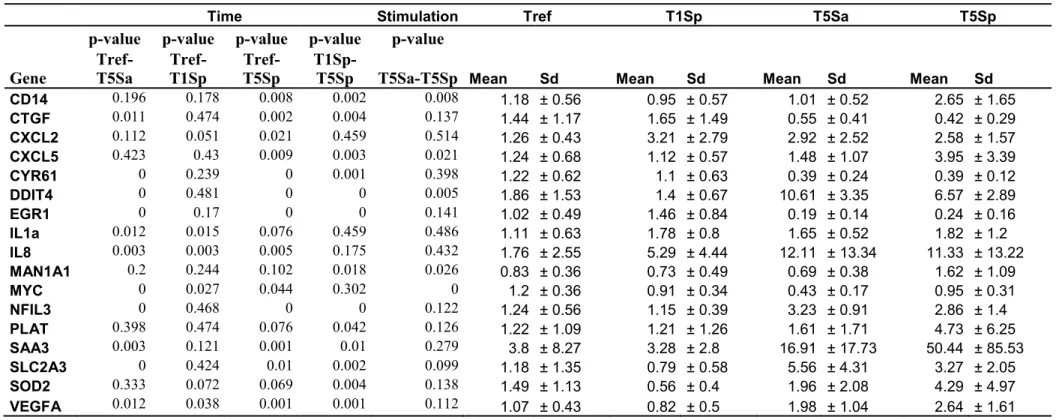
When stimulated with Sa, a total of 531 probes, corresponding to 378 genes, were differentially expressed in MEC during the time course (Model M1.1, Additional file 3). The expression of four down-regulated genes (ctgf, cyr61, egr1 and myc) and seven up-regulated genes (ddit4, il-1a, cxcl8, nfil3, saa3, slc2a3 and vegfa) was measured by RT-qPCR. The expression changes of these 11 genes were indeed confirmed (p<0.015) (Table 2). For the global gene list obtained from the microarray analysis, the canonical pathways “IGF1 signaling” (p<0.001, with the genes ywhaq, pxn, ctgf, ywhab, csnk2a1, igfbp3, rac1, prkaca,
pik3r2 and cyr61) and “DNA damage checkpoint regulation pathways” (p<0.001, with the
genes ywhab, ywhaq, cks2, , ccnb3, cdkn1a, mdm2) belonged to the list of pathways that were significantly affected after Sa stimulation.
Furthermore, hierarchical clustering of the DEG with time produced six clusters (Figure 2A). First, the expression of 361 probes was down-regulated in the time course (clusters 0 and 1). A first cluster of 154 probes (cluster 0) showed no change in expression levels between Tref and 1hr of stimulation and then a diminution between 1 and 5hrs. The GO analysis of the cluster 0 revealed an enrichment in genes involved in the regulation of cell cycle (“Cell cycle”, “Cell Cycle process”, “Regulation of cell growth”, “Mitosis”…, p<0.001), induction of apoptosis (“Apoptosis”, “Programmed cell death”, “Regulation of of apoptosis” …, p=0.003), catabolic processes (“Regulation of caspase activity” p=0.023, “Regulation of macromolecule metabolic process” p=0.025, “Cyclin catabolic process” p=0.030…) and the “p53 signalling pathway” (p=0.002). The expression of 207 probes (cluster 1) dropped after the stimulation; the GO analysis of this cluster showed that whereas a few of these genes were involved in cell growth (“Regulation of growth” p=0.011, “Cell cycle process” p=0.018…) or in “Regulation of apoptosis” (p=0.006), most of them were involved in response to stress (“Cellular response to stress” p=0.019, “Cellular response to oxidative stress” p=0.031…), in development (“Muscle and tissue development” p<0.001, “Tissus morphogenesis” p<0.001, “Morphogenesis of an epithelial sheet” p=0.002) and in regulation of biosynthetic process (p=0.008). A third cluster of 67 probes (cluster 2) comprised the genes that were the most expressed at T1 after which their expression came back to the previous levels at T5 (Figure 2A). The GO analysis of the cluster 2 showed enrichment in genes involved in cell cycle (“Cell cycle” p<0.001, “Positive regulation of cell cycle” p=0.014, “Mitosis” p=0.034…) and in cellular respiration (“Cellular respiration” p=0.040, “Electron transport chain” p=0.006, “ATP synthesis coupled electron transport” p=0.014…). Another group of 33 probes were on the contrary down-regulated at T1, whereas their expression was higher at T5 (cluster 3, Figure 2A), and were involved in the “Negative regulation of molecular function” (p=0.018) and in the ”Regulation of apoptosis” (p=0.044). Two more clusters included 70 probes that were up-regulated during the time course (clusters 4 and 5). The expression of 47 probes increased lately at T5 only (cluster 4) and these genes were involved in metabolic processes (“Hexose metabolic process” p=0.001, “Protein polymerization” p=0.007, “Regulation of homeostatic process” p=0.033…), apoptosis (“Regulation of apoptosis” p<0.001, programmed cell death p<0.001…) and immune and
inflammatory responses (“Inflammatory response” p=0.009, “Immune response” p=0.028, “Response to oxygen level” p=0.005, “Induction of positive Chemotaxis p=0.025). Finally 23 probes were up-regulated early after stimulation (at both T1 and T5) (cluster 5) and were involved in “protein N-terminus binding” (p<0.001).
1-2 MEC stimulation with S. aureus supernatant
After Sp stimulation, a total of 687 probes (486 genes) were found to be differentially expressed over time (Model M1.1, Additional file 4). The expression of 16 of these genes was measured by RT-qPCR: Three of them were down-regulated (ctgf, cyr61 and egr1) and 13 were up-regulated (cd14, cxcl2, cxcl5, ddit4, il1a, cxcl8, man1a1, nfil3, plat, saa3, slc2a3,
sod2 and vegfa). The differences in gene expression over time were confirmed for all genes
(p<0.02) (Table 2). The main canonical pathways determined for the global list of DEG involved ”Interleukin signaling” (IL-1, -3, -6, -10, -17, p<0.001 except for IL-22, p=0.036), “TLR pathway” (p<0.001), “CD40 pathway”(p<0.001), “TNFR1 pathway” (p=0.002) and “TNFR2 pathway” (p=0.001), “NFκB activation” (p<0.001) and “Myc-mediated apoptosis signalling” (p < 0.001).
Hierarchical clustering of the DEG as a function of their expression over time produced four clusters (Figure 2B). The first two clusters comprised 205 probes that were down-regulated after stimulation (clusters A and D). The expression of 73 probes was not affected 1 h after stimulation but dropped at 5 hrs (cluster A) (Figure 2B). The genes of this cluster were mainly involved in lipid and protein metabolic processes (“Sterol biosynthetic process” p<0.001, “Cholesterol metabolic process” p=0.001, ”Fatty acid biosynthetic process” p=0.036, “Positive regulation of protein metabolic process” p=0.013, “Proteasomal protein catabolic process” p= 0.007…) and cell cycle (“Cell cycle” p<0.001, “Mitotic cell cycle” p<0.001, “Cell proliferation” p=0.006). The expression of the other 132 probes were down-regulated at T1 and then either remained at low levels at T5 or resumed normal levels (cluster D, Figure 2B). The genes of this cluster were involved in tissue development (“Muscle tissue development” p=0.001, “Tissue morphogenesis” p=0.006…), lipid metabolism (“Sterol biosynthetic process” p=0.001, “Cholesterol biosynthetic process” p=0.012…), cell cycle (“Cell cycle process” p=0.027, “Growth” p=0.029…) and apoptosis (“Induction of apoptosis” p=0.004, “Regulation of apoptosis” p=0.005, “Cell death” p=0.016). A third cluster comprised 79 probes that were down-regulated at T1 and then up-regulated at T5 (cluster B) (Figure 2B). These genes were involved in the cell cycle (“Regulation of cell cycle” p=0.003, “Cell proliferation” p=0.012) and apoptosis (“Regulation of apoptosis” p=0.023, “Cell death” p=0.036…) and in metabolic processes (“Negative regulation of metabolic process” p=0.048). The final cluster included 403 probes that were up-regulated at T5 (cluster C) (Figure 2B). These genes were mainly involved in the response to stress (“Response to reactive oxygen species” p=0.018, “Response to oxidative stress” p=0.019 “Response to osmotic stress” p=0.026, “Response to extracellular stimulus” p= 0.041…), cell movement (“Cell motion” p=0.002, “Cell motility” p=0.023, “Cell migration” p=0.025), cell communication (“Positive regulation of cell communication” p=0.017 and “Cell junction organization” p=0.028), apoptosis (“Regulation of apoptosis” p<0.001, “Apoptosis” p=0.006…), metabolic processes (“Positive regulation of biosynthetic process” p=0.002, “Protein transport” p=0.012, “Glycolysis” p=0.015, “Response to lipopolysaccharide” p=0.020…) and in “Mammary gland development” (p=0.009).
1-3 Comparison of the response to live bacteria or the supernatant
MEC stimulation with Sa or Sp resulted in different gene expression profiles., The results of hierarchical clustering based on the individual expression values of the samples stimulated either by Sa or Sp actually revealed that MEC responded weakly to Sa at 1h whereas the response was much stronger with Sp at the same time point (data not shown).
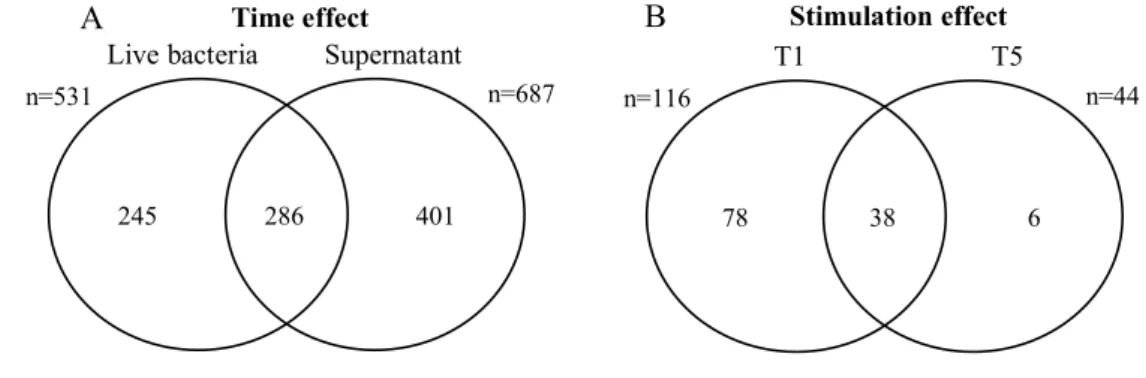
In addition, Venn diagram comparison of the two lists of probes from stimulation with either Sa or Sp, shows that 286 probes were common (Figure 3A). Indeed, both responses shared common pathways, but differed also largely.
To enhance insight into the regulation of MEC response to Sa and Sp, the evolution of the main biological functions with time through identification of significant GO functions (ease score < 0.05, DAVID analysis) was compared. Some genes involved in “Muscle and tissue development” were down-regulated when MEC were stimulated with S. aureus (clusters 1 and D), except for some of these genes that were also involved in “Blood vessel morphogenesis” and were up-regulated at T5 in both cases (clusters 4 and C). Genes involved in “Mammary gland development” were up-regulated at T5 only with Sp (cluster C). In addition, “Mitosis” and “Cell proliferation” were affected in both conditions (clusters 0, 1, 2, A and D).
Following stimulation, function of cytoskeleton and membrane remodelling changed. The “Endocytosis” pathway was activated after stimulation by Sp (cluster C) but inhibited after stimulation by Sa (cluster 1). Cell communication was negatively regulated when cells were stimulated with Sa (“Negative regulation of cell communication”, cluster 4) but was promoted when cells were stimulated by Sp (“Positive regulation of cell communication”, cluster C) with an up-regulation of genes involved in “Membrane organization”, “Vesicle mediated transport”, “Cell-matrix adhesion” and “Cell junction assembly”. The cellular metabolism was also affected by the stimulations: with Sa, the catabolism was enhanced with “Regulation of caspase activity” and biosynthetic processes were decreased with “Negative regulation of macromolecule metabolic process” (clusters 0 and 1); cellular respiration was at first activated and then inhibited (“Respiratory electron chain transport”, cluster 2). After stimulation by Sp, the lipid biosynthetic metabolism was highly affected (“Lipid biosynthetic process”, clusters A and D). The genes involved in “Hexose catabolism process” were up-regulated (clusters 4 and C). Genes involved in the regulation of gene expression were down-regulated after stimulation by Sa (“Negative regulation of gene expression” in cluster 0 and “Positive regulation of gene expression” in cluster 1) and up-regulated after stimulation by Sp (“Positive regulation of gene expression”, cluster C). Furthermore, MEC expressed genes that revealed responses to extracellular stimuli. “Immune response” and “Inflammatory response”, with induction of “Chemotaxis” were activated only following stimulation by Sa (cluster 4), whereas after stimulation with Sp, the main functions pointed towards a “Cellular response to oxidative stress” (cluster C). Expression of apoptosis-related genes was either up-regulated (clusters 3, 4, b and C) or down-regulated (clusters 0, 1 and D) depending on the condition.
In addition, InnateDB analysis showed that four transcription factors (TFDP1, HIF-1, AHR and NRF1, p<0.001) can bind 72, 57, 90 and 58 promoters of genes that were down-regulated after stimulation by Sa or Sp (clusters C0, C1, CA and CD). No transcription factor was found to significantly bind the promoters of the up-regulated genes (clusters C4, C5, CB and CC).
Furthermore, a direct comparison of MEC response to Sa and Sp was also performed by ANOVA as a function of time (Model M1.2). Indeed, 116 and 44 probes (corresponding to
104 and 42 genes) were identified as differentially expressed between Sa and Sp, at 1 and 5 hr post-stimulation, respectively (Additional files 5 and 6). A set of 38 probes belonged to both lists (Figure 3B). Two sets of 91% and 93% of the DEG were more expressed in Sa than Sp condition at 1 and 5 hours post-stimulation, respectively. On the contrary, the genes cxcl8,
egr1, tnfaip3, cxcl2, areg, fos, ptgs2, dusp5 and trib1, at 1hr, and the genes areg, dusp5 and trib1 at 5 hr were expressed at higher levels in Sp than Sa condition.
At T1, the genes that were more highly expressed in Sp were enriched for functions related to the “Inflammatory response” (p=0.015) and in “Learning or memory” (p=0.002). On the contrary, the genes that were more highly expressed after stimulation by Sa were involved in “Cellular response to oxidative stress” (p=0.018), “Positive regulation of I-kappaB kinase/NF-I-kappaB cascade” (p=0.027), “Cellular macromolecule organization” (p=0.001), “Intracellular transport” (p=0.002), “Negative regulation of translation” (p=0.018), in “Positive regulation of cell communication” (p=0.004) and “Cell proliferation” (p=0.049), and ”Cell death” (p=0.011). The list of DEG with higher expression after Sa than Sp stimulation at T5 was enriched for the same GO functions as the one at T1, except for “Cell death”. No GO function was found to be enriched for the list of the DEG with higher expression after Sp stimulation at T5.
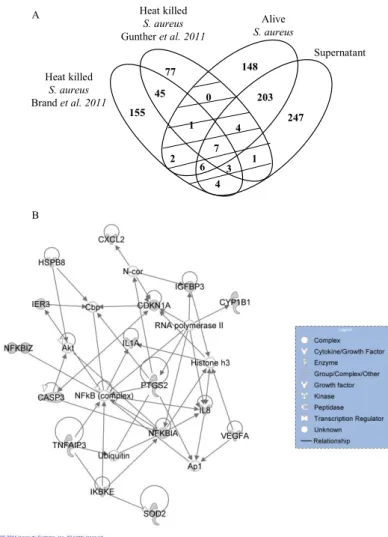
Then, the gene profiles of MEC responses to different forms of S. aureus (heat-killed bacteria, live bacteria and culture supernatant) was compared by Venn diagram. MEC stimulations by heat-killed bacteria in Brand et al. (14) and Gunther et al. (26) analyses were included (Figure 4A). For Brand’s analysis the DEG lists of MEC in the time course for resistant and susceptible cows were pooled together. A set of 28 genes belonged to “live bacteria” or “supernatant stimulation” lists and to at least one of the “heat-killed bacteria” lists. The Ingenuity network analysis of this gene set scored 38 and involved 16 genes (Figure 4B). It was characterized by three main function sthat were“Cell death”, “Gene expression” and “Inflammatory response”.
2- Comparison of MEC response between genetic lines
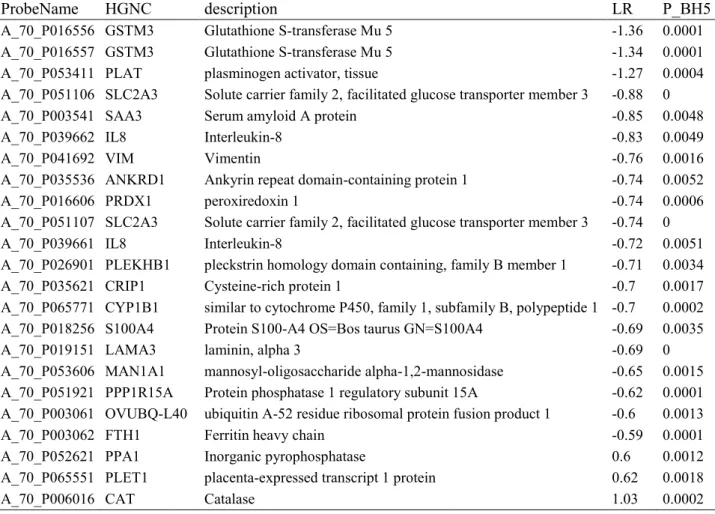
When comparing the MECs of resistant and susceptible animals on the overall experiment, after correction for the other effects (Model M2.1), only 23 probes (20 genes) were found to be differentially expressed (Table 3). Of these 20 genes, three were expressed at higher levels in the MECs of resistant animals (cat, plet1 and ppa1). The expression of eight genes was measured by RT-qPCR in the samples collected at Tref, T1Sp, T5Sp and T5Sa. The differences of expression were confirmed for six of the eight genes, but saa3 and
cxcl8 were not found to be differentially expressed between the lines by RT-qPCR (Table 4).
The gene list was enriched for the cellular response to “Oxidation reduction” (p=0.031) with the genes (cat, prdx1 and cyp1b1 and fth1). Interestingly, 15 of the 23 DEG were involved in one IPA network that scored 39 (Figure 5). These molecules were mainly linked to genes involved in the regulation of inflammation (nfκb and myc) and tp53. IPA analysis of DEG between resistant and susceptible animals showed enrichment for “Xenobiotic metabolism signalling” (p=0.004, gstm3, cat and fth1) and “NRF2-mediated oxidative stress response” (p<0.001, gstm3, cat, fth1 and prdx1), whereas no canonical pathway was significant.
We showed above that the gene expression profile of MEC was strongly modified by the two stimulations (Model M1.1 and M1.2). For that reason, MEC differences between resistant and susceptible animals were also analyzed within each time-stimulation condition. In all the conditions, three genes (gstm3, slc2a3 and plat) were more expressed in the MEC of the susceptible animals and conversely, cat was more expressed in the MEC of the resistant ones. Prior to stimulation (Tref), ten DEG were identified between resistant and susceptible animals, eight of these had been identified above in the global analysis of the line effect (Model M2.1), but zak and a non-classical MHC class I gene were new. All these ten DEG were also differentially expressed in at least one another condition. The MHC Class I gene was up-regulated in MECs of the resistant animals only after stimulation by Sa (T1Sa and T5Sa). The number of DEG between resistant and susceptible animals was higher at T5 than at T1 after stimulation by Sp (with 17 and 11 genes at T5 and T1, respectively).
To further look for gene expression differences between the lines, gene set enrichment analysis (GSEA) was performed. Although 48 gene sets in the collections C2 (curated gene sets), C3 (motif gene sets), C4 (computational gene sets) and C5 (GO gene sets) were candidate gene set for being enriched (as they contained at least 15 focus genes), none was significant, indicating small differences of gene expression response between genetic backgrounds.
Discussion
In the present study, we analyzed the response of an in vitro culture of MEC to the presence of S. aureus over a short time course. Using live bacteria, we focused on the early response of MEC to avoid the cytotoxic effects that result in RNA degradation and possibly, a difference of bacterial development between conditions. The expression of approximately 12,000 genes was analyzed using an ovine pangenomic microarray. Although there was a high variability in the individual responses to S. aureus, more differences were found between the two different conditions of stimulation than between genetic backgrounds with a difference of susceptibility to Staphylococcus spp.
1- MEC responses to live S. aureus or bacterial supernatant
During natural IMI, MEC form a physical barrier that prevents bacteria to enter host tissues. S. aureus is known to secrete a number of proteins and to release a number of cell wall-associated molecules that have the potential to activate the innate immune system, under
in vitro and in vivo conditions (21). Culture supernatant is a stimulus per se, representative of
what happens during an infection, where live staphylococci release an array of molecules stimulating, luring, evading, or impairing the defences of the host. Thus the two forms of stimulation used in this in vitro culture model are therefore both relevant, but could however induce distinct biological effects.
1-1 Similarities between live bacteria and soluble factor stimulations Loss of MEC functionality
Our first analyses clearly showed a down-regulation of the MEC genes involved in cell proliferation, metabolic processes and transcription functions after interaction with S.