Appendix C
MEDOF PANEL PERFORMANCE ASSESSMENT BY NRC-CHC
Table of contents
1. Introduction ...1
2. Tarsiut 1981-82 Calibration and Recalibration of MEDOF Panels ...1
3. Tarsiut 1982-83 Calibration and Recalibration of MEDOF Panels ...5
4. Molikpaq MEDOF Panel Calibration...8
5. Canatec MEDOF Panel Error Analysis ...11
6. Personal Communications ...12
7. MEDOF Panel Calibration Trends ...13
8. Panel 1010 overload on May 12 ...14
9. Limits on MEDOF Panel response...18
10. Summary and Conclusions ...18
11. References ...19
List of Figures Figure 1 Panel #12 Calibration and recalibration ...2
Figure 2 Panel #14 Calibration and recalibration ...3
Figure 3 Panel #12 and #14 Calibration and recalibration comparison at -10 C ...4
Figure 4 Panel P18, Calibration and recalibration ...6
Figure 5 Replot of calibration and recalibration of Panel P18...7
Figure 6 Field calibration of MEDOF panel 1001 ...11
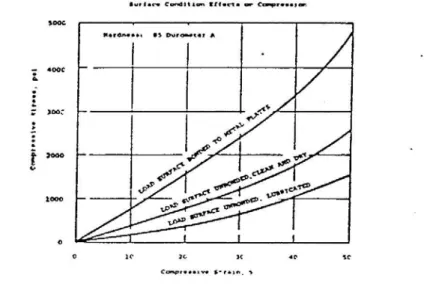
Figure 7 Surface condition effects on apparent stiffness of buttons ...12
Figure 8 Strain gauge SG09 calibration factors for North face as a function of time ....13
Figure 9 Strain gauge SG09 calibration factors for East face as a function of time ...14
Figure 10 Time series plot, May 12 02:38 – 04:19 ...15
Figure 11 Suspicious record for Panel 1010 from 03:25:00 – 03:26:03 ...16
Figure 12 Suspicious record for Panel 1010 after 03:58:08...16
Figure 13 Sight tube and pressure transducer set-up for MEDOF panels ...17
List of Tables Table 1 Comparison of Calibration and Recalibration of Panels # 12 and # 14 ...5
Table 2 Calibration and recalibration of Tarsiut M and P series panels from FMS Engineers (1983a)...7
1. INTRODUCTION
MEDOF panels were originally conceived for measuring ice pressures either in-situ in ice covers and grounded rubble fields around offshore structures, or for attachment to the face of structures to directly measure ice forces (Metge et al, 1993). Issues of temperature sensitivity, response time, partial panel loading, creep and repeated loading were recognized as issues from the beginning and are discussed in the original Metge paper.
Because the MEDOF panels are key to the interpretation of ice loads on the Molikpaq a number of recalibrations and reviews of their performance were done. Some of these recalibrations were from other deployments of MEDOF panels. The MEDOF panels were reviewed in each of the Gulf Canada Resources Phase 1A, 1B and 2 JIP reports.
2. TARSIUT 1981-82 CALIBRATION AND RECALIBRATION OF
MEDOF PANELS
The first major application of MEDOF panels was in the ice around the Tarsiut caisson structure in the autumn of 1981. Twenty panels were manufactured and installed at this location.
For completeness a description of the manufacture of the panels based on a description in FENCO (1982) is included here. The Tarsiut panels were about 1.1 m wide by 1.75 m long. Both the front and back faces were 3.157 mm thick (1/8”) steel plates. The steel plates were sandblasted and degreased before the polyurethane buttons were applied. A mould,
consisting of a steel plate 2.54 mm thick and with 9.5 mm diameter holes spaced 12.7 mm apart was placed on the back plate and polyurethane poured onto the mould, filling the holes. Note that the same mould pattern was used for the manufacture of all series of MEDOF panels. After the polyurethane had set the mould was removed. A bonding agent was applied to the inside of the front sheet, it was pressed against the buttons on the back sheet and the two sheets were heat cured under pressure to ensure a durable bond between the front sheet and the buttons. The final step in manufacturing was to weld the edges and attach a fitting for the sight tube. Welding was done in intermittent 200 mm-long stitches and copper heat sinks were used to avoid deformation of the steel plates or damage to the buttons.
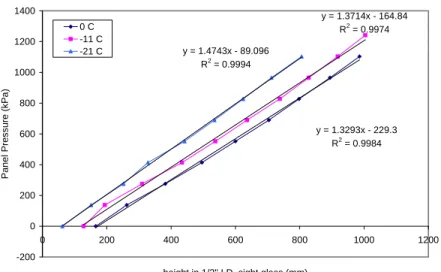
Tarsiut Panel #12 Calibration y = 1.3293x - 229.3 R2 = 0.9984 y = 1.3714x - 164.84 R2 = 0.9974 y = 1.4743x - 89.096 R2 = 0.9994 -200 0 200 400 600 800 1000 1200 1400 0 200 400 600 800 1000 1200
height in 1/2" I.D. sight glass (mm)
Pane l Pres s u re (k Pa ) 0 C -11 C -21 C
Tarsiut Panel #12 Recalibration
y = 1.4305x - 508.83 R2 = 0.9926 y = 1.3559x - 569.86 R2 = 0.9902 y = 1.3559x - 338.13 R2 = 0.9889 0 200 400 600 800 1000 1200 1400 0 200 400 600 800 1000 1200 1400 1600
height in 1/2" I.D. sight glass (mm)
Pan el Pressu re (kPa) -2 C -12 C -22 C
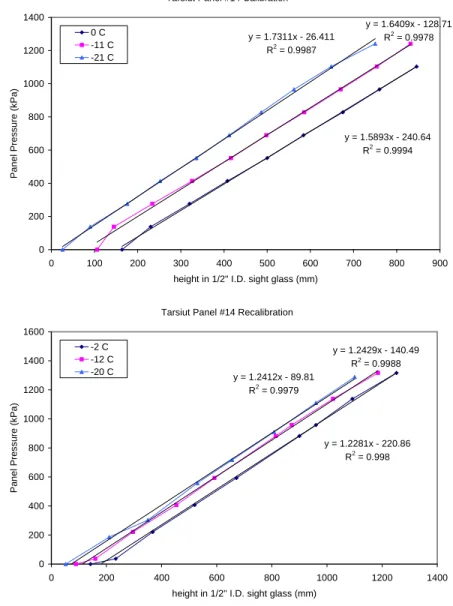
Tarsiut Panel #14 Calibration y = 1.5893x - 240.64 R2 = 0.9994 y = 1.6409x - 128.71 R2 = 0.9978 y = 1.7311x - 26.411 R2 = 0.9987 0 200 400 600 800 1000 1200 1400 0 100 200 300 400 500 600 700 800 900
height in 1/2" I.D. sight glass (mm)
Pa nel Pre ssure (kPa) 0 C -11 C -21 C
Tarsiut Panel #14 Recalibration
y = 1.2281x - 220.86 R2 = 0.998 y = 1.2429x - 140.49 R2 = 0.9988 y = 1.2412x - 89.81 R2 = 0.9979 0 200 400 600 800 1000 1200 1400 1600 0 200 400 600 800 1000 1200 1400
height in 1/2" I.D. sight glass (mm)
Pane l Pres s u re (k Pa ) -2 C -12 C -20 C
Figure 2 Panel #14 Calibration and recalibration
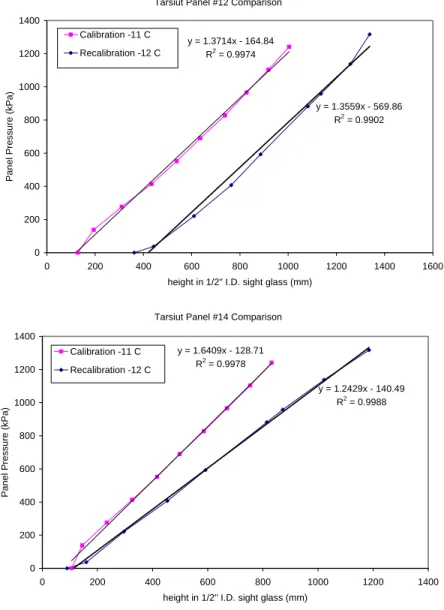
To make the comparison between the calibration and recalibration test results clearer, plots for panel #12 and #14 at a nominal temperature of -10C are presented in Figure 3.
Tarsiut Panel #12 Comparison y = 1.3714x - 164.84 R2 = 0.9974 y = 1.3559x - 569.86 R2 = 0.9902 0 200 400 600 800 1000 1200 1400 0 200 400 600 800 1000 1200 1400 1600
height in 1/2" I.D. sight glass (mm)
Pan e l Pressu re (kPa) Calibration -11 C Recalibration -12 C Li (R lib ti
Tarsiut Panel #14 Comparison
y = 1.6409x - 128.71 R2 = 0.9978 y = 1.2429x - 140.49 R2 = 0.9988 0 200 400 600 800 1000 1200 1400 0 200 400 600 800 1000 1200 1400
height in 1/2" I.D. sight glass (mm)
Pane l P re s s u re (k Pa) Calibration -11 C Recalibration -12 C
Figure 3 Panel #12 and #14 Calibration and recalibration comparison at -10 C
These calibration data are summarized in Table 1. It can be seen that panel #12 experienced no change in calibration. At -10 C panel #14 showed about a 30% reduction (softening) of the calibration factor. The recalibrations of panels #20 and # 37 showed reductions of 30.5 and 33 %, respectively.
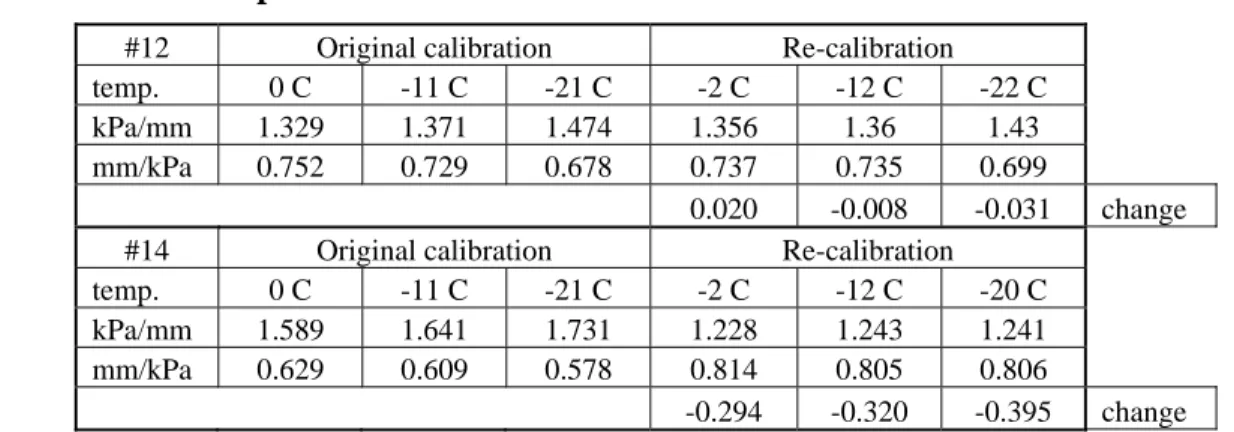
Table 1 Comparison of Calibration and Recalibration of Panels # 12 and # 14
#12 Original calibration Re-calibration temp. 0 C -11 C -21 C -2 C -12 C -22 C
kPa/mm 1.329 1.371 1.474 1.356 1.36 1.43 mm/kPa 0.752 0.729 0.678 0.737 0.735 0.699
0.020 -0.008 -0.031 change
#14 Original calibration Re-calibration temp. 0 C -11 C -21 C -2 C -12 C -20 C
kPa/mm 1.589 1.641 1.731 1.228 1.243 1.241 mm/kPa 0.629 0.609 0.578 0.814 0.805 0.806
-0.294 -0.320 -0.395 change
The 1982 FENCO report also covers tests done on a selection of 50 panels which were manufactured for Dome Petroleum’s Uviluk site. These panels were sent to Japan for attachment to the SSDC. They differed from the Tarsiut panels in that they had a front face 6.35 mm thick and were 1 m wide by 2 m long. Three of the Uviluk panels were subject to repeated loading. Six cycles of loading to 960 kPa, holding for one hour, rapid unloading, and holding for one hour before reloading were conducted and the slopes of the curves
remained the same for repeated loading on each panel. Partial area loading tests were done on panel #48. The calibration factor for the six repeat tests was 1.80 kPa/mm. Applying the same load to the middle quarter, half and three-quarters of the panel gave factors of 1.73 kPa/mm, 1.73 kPa/mm and 1.81 kPa/mm, respectively.
3. TARSIUT 1982-83 CALIBRATION AND RECALIBRATION OF
MEDOF PANELS
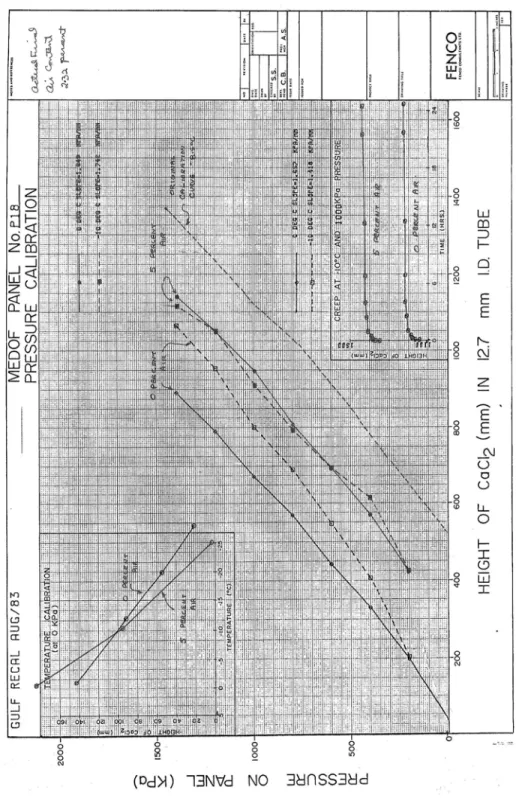
Over the winter 1982-83 a research program was carried out at the Tarsiut Island location. As part of this project, 30 MEDOF panels were put into the ice adjacent to the Tarsiut caisson structure. The panels were similar in construction to the Tarsiut panels, but were 1 m by 2 m and the front and back faces were 3 mm thick steel. They were designated with a prefix letter P or M. In the summer of 1983 ten of the panels were returned to FENCO, now a part of FMS Engineers, for recalibration (FMS Engineers, 1983a). They were panels M16, P2, P6, P10, P11, P12, P16, P17, P18, and P19. The report contains plots of all the tests. As an example the plot for P18 is reproduced in Figure 4.
Figure 4 Panel P18, Calibration and recalibration
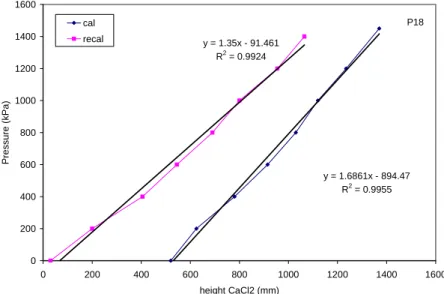
The original calibration factor for P18 at -8.5 C in FMS Engineers (1983a) was 1.742 kPa/mm and the recalibration was 1.418 kPa/mm, for a softening of 19%. Note that these values were taken off the plot in Figure 4. The data from Figure 4 have been replotted in Figure 5. From this replot, the calibration and recalibration factors are 1.69 kPa/mm and 1.35 kPa/mm, for a
softening of 20%. There is no explanation for this difference other than that slopes of in Figure 4 may have been determined from an “eye-ball” fit to the data.
P18 y = 1.6861x - 894.47 R2 = 0.9955 y = 1.35x - 91.461 R2 = 0.9924 0 200 400 600 800 1000 1200 1400 1600 0 200 400 600 800 1000 1200 1400 1600 height CaCl2 (mm) P ressure (kP a ) cal recal
Figure 5 Replot of calibration and recalibration of Panel P18
Calibration and recalibration factors taken from the plots in the FMA (1983a) report are summarized in Table 2. The results indicate an average softening of about 15%. The original FMS report did recognize this difference. The panels were frozen into the ice around the Tarsiut caissons and removed in the spring. It is possible that they were damaged or deformed, either during the winter, or on removal.
Table 2 Calibration and recalibration of Tarsiut M and P series panels from FMS Engineers (1983a)
Panel
Cal factor
(kPa/mm) No. cal recal Change M16 1.381 1.174 0.15 P19 1.102 0.930 0.16 P18 1.742 1.418 0.19 P17 1.100 1.140 -0.04 P16 1.224 1.084 0.11
4. MOLIKPAQ MEDOF PANEL CALIBRATION
FMS Engineers manufactured and calibrated 31 panels for deployment on the Molikpaq. This was done in the late winter and early spring of 1983. Calibration results of the Molikpaq MEDOF panels appear in a report dated May 16, 1983 and are taken from Volume XI of the Gulf Canada Resources Phase 1A report (FMS Engineers, 1983b). The panels were specially designed to be attached to the face of the Molikpaq. A detailed description of the MEDOF panel construction and operation is presented in Section 5.1 of the final report.
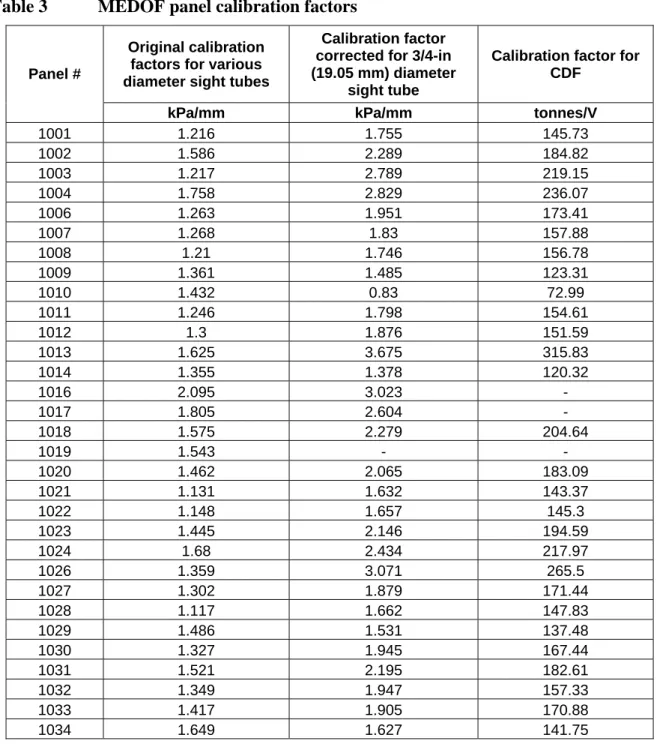
The MEDOF panels were first calibrated in the laboratory, before the deployment of the Molikpaq. These calibrations were done with sight tubes of various diameters. The original calibration factors are shown in Table 3. Note that the numbering of three pairs of panels was switched when the panels were installed on the Molikpaq. The calibration factors in Table 3 represent the values for the panels at their installed locations. When the MEDOF panels were attached to the Molikpaq, the diameter of all sight tubes was standardized to 19.05 mm
(Rogers et al, 1991). The calibration factors were adjusted as shown in Table 3.
The raw data from the pressure transducer at the base of the sight tube was transmitted as a voltage from the panels to the data acquisition system. When the data were transferred from the original data tapes to ASCII format for modern computers, a Channel Description File (CDF) was used to convert from volts to tonnes. The calibration factors from the channel description file are shown in Table 3. (Klohn-Crippen, 1995) Note that calibration factors for panels 1016, 1017, and 1019 (installed on the northeast face of the Molikpaq) are not
available since these panels were damaged.
Each step of the calculation of MEDOF panel calibration factors was checked. As an
example, the determination of the calibration factor for panel 1001 is presented. The starting point was a calibration curve similar to that in Figure 4 in which the applied pressure on the panel in kPa is plotted versus the height of CaCl2 solution in the sight tube.
Original calibration factor = 1.216 kPa/mm, for 15.9 mm sight tube Corrected CF = Calibration factor corrected for 19.05 mm tube:
(1.216 kPa/mm)*(19.05 mm)2/(15.9 mm)2 = 1.755 kPa/mm
Calibration factor for Channel Description File:
Corrected CF * conversion factor for kPa to tonnes * conversion factor for mm to volts
To get the conversion factor for kPa to tonnes-force, we use the area of the MEDOF panel and the conversion factor for kN to tonnes. To convert from millimetres of fluid in the sight tube to volts is more complicated:
We know that one atmosphere (101.325 kPa) is the amount of pressure that can lift water approximately 10.3 m. The MEDOF panels are filled not with water but with a calcium chloride solution of density 1356.5 kg/m3. Therefore the pressure on the CaCl2 fluid is
The specifications for the pressure transducers used in the MEDOF panels state that the output of the pressure transducers is 0.15 volt/kPa (Gulf Phase 1A, Vol 3). Also, this output is amplified by a factor of 2. The conversion for mm of CaCl2 to volts is then:
0.01334 kPa/mm * 0.15 volt/kPa * 2 = 0.003871 volt/mm or 258 mm/volt
lt tonnes/vo 142.5 mm/volt 258.3 m 2.715 * m 1.135 kN 9.80665 tonne 1 kPa/mm 1.755 ∗ ≈ ⎟ ⎠ ⎞ ⎜ ⎝ ⎛ ∗
As we can see this is very close to the value of 145.73 tonnes/volt used in the Channel Description File. This difference may be due to rounding errors.
The calibration factors in the CDF are all fairly close to those calculated in the same manner as described for panel 1001. On average the factors calculated by the authors of this report are 5.8% lower than those used in the CDF. The reason(s) for these differences is not clear. It is possible that errors could be due to
∗ Final calibration factors (in kPa/mm) used to get the values for the CDF being slightly different than those given in Rogers et al (1991)
∗ Actual density of CaCl2 solution different than the value used by the present authors ∗ Rounding errors, for example values used in converting from inches to mm, or kPa to
tonnes
In any case, the numbers are very comparable and confirm that no large errors were made in the MEDOF panel factors for load conversion.
Table 3 MEDOF panel calibration factors
Original calibration factors for various diameter sight tubes
Calibration factor corrected for 3/4-in (19.05 mm) diameter
sight tube
Calibration factor for CDF
Panel #
kPa/mm kPa/mm tonnes/V
1001 1.216 1.755 145.73 1002 1.586 2.289 184.82 1003 1.217 2.789 219.15 1004 1.758 2.829 236.07 1006 1.263 1.951 173.41 1007 1.268 1.83 157.88 1008 1.21 1.746 156.78 1009 1.361 1.485 123.31 1010 1.432 0.83 72.99 1011 1.246 1.798 154.61 1012 1.3 1.876 151.59 1013 1.625 3.675 315.83 1014 1.355 1.378 120.32 1016 2.095 3.023 - 1017 1.805 2.604 - 1018 1.575 2.279 204.64 1019 1.543 - - 1020 1.462 2.065 183.09 1021 1.131 1.632 143.37 1022 1.148 1.657 145.3 1023 1.445 2.146 194.59 1024 1.68 2.434 217.97 1026 1.359 3.071 265.5 1027 1.302 1.879 171.44 1028 1.117 1.662 147.83 1029 1.486 1.531 137.48 1030 1.327 1.945 167.44 1031 1.521 2.195 182.61 1032 1.349 1.947 157.33 1033 1.417 1.905 170.88 1034 1.649 1.627 141.75
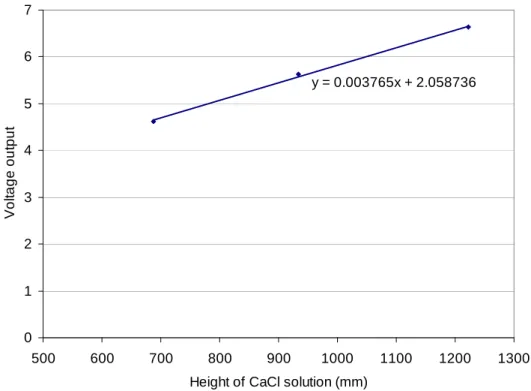
Another check is available for the MEDOF panel calibration factors – field calibrations completed on October 29-30, 1986, after the Molikpaq was set down at the Amauligak site (Canatec, 1991). During this time period, first year ice with some second-year inclusions was interacting with the Molikpaq. For these calibrations, personnel measured the height of the CaCl2 solution in the sight tubes and recorded the voltage output to the data acquisition system. Checking these calibrations against those done in the lab assures that the MEDOF panels were not damaged at some point after the lab testing.
An example of one field calibration is shown for panel 1001 in Figure 6. Measurements were taken at three different times. The slope of the best fit line gives a calibration factor of
0.003765 volts/mm. Converting to tonnes per volt using the calibration factor of
1.755 kPa/mm in Table 3 gives a calibration factor of 146.47 tonnes/volt. This is very close to the calibration factor of 145.73 tonnes/volt used in the CDF.
Overall it can be concluded that the Channel Description File factors are correct for calculation of ice forces from the MEDOF panels.
y = 0.003765x + 2.058736 0 1 2 3 4 5 6 7 500 600 700 800 900 1000 1100 1200 1300
Height of CaCl solution (mm)
V o lt ag e out pu t
Figure 6 Field calibration of MEDOF panel 1001
5. CANATEC MEDOF PANEL ERROR ANALYSIS
As pointed out in the introduction there were numerous reviews of the MEDOF panels and their performance. These were all done by or for Gulf Canada Resources. In 1991 Amoco Production Company commissioned Canatec to conduct an independent review of possible errors in the interpretation of MEDOF panel results (Canatec, 1991). The study reviewed 13
surface, respectively. The figure clearly shows that if a button separates from the steel plate, its apparent stiffness decreases significantly. This is one possible mechanism for softening of the MEDOF panels on the Molikpaq. The figure also suggests pressures of up to 35 MPa (5000 psi) on a bonded button could be sustained at 50% strain. Unbonded pressures were much less, at 17 MPa and 7 MPa for 50% strain.
Figure 7 Surface condition effects on apparent stiffness of buttons
6. PERSONAL COMMUNICATIONS
This Section was prepared by Dr. R. Frederking based on personal communications with persons with knowledge of the manufacturing, installation and calibration of the MEDOF panels.
Bill Graham, now at Sandwell and formerly at Fenco when the panels were being
manufactured, was contacted to get any information on panel manufacture and calibration. He referred me to the Fenco and Geotech reports, which we have already seen. He said they still had an old panel in their warehouse, but was not sure of its condition. He suggested I contact Allan Strandberg, who also was at Fenco when the panels were manufactured and calibrated.
I called Allan Strandberg, and he provided some information on manufacture of the panels. FENCO prepared the steel plates and did the final welding assembly, but the polyurethane (Adiprene) buttons were cast at a specialist plastics moulding company, as was the gluing and heat curing. The calibrations were done in a press at FENCO. He sent me a report of panel calibrations and also went in to Sandwell’s office to locate another report on calibrations. After receiving the reports we were able to confirm that the information in them was in Gulf Canada Resources reports we had on hand. He did not think that it was likely that the urethane buttons would soften with age or loading, but that separation of the buttons from either the backing plate or steel front plate was possible. He was on site December 1985 to service the MEDOF panels. This involved checking them, removing any oil or CaCl2
fluid-oil emulsion and filling the site tubes with CaCl2 fluid. He mentioned that he replaced some sight tubes with longer ones, about 2.4 m he recalled. Not all tubes were replaced. Uwe Embacher replaced him in January and continued the panel servicing. I spoke to Embacher but he had no additional information.
7. MEDOF PANEL CALIBRATION TRENDS
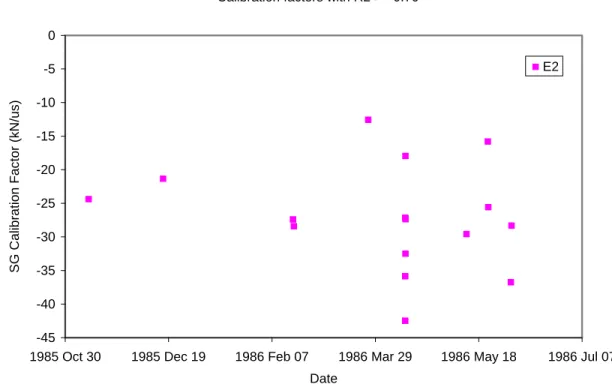
Calibrations of Medof Panel groups on the north and east faces versus SG09 strains were examined to see if any trends could be determined. If there was softening or hardening of the panels over the winter, a change might be detected. In doing this it is assumed that the strain gauges themselves were relatively stable. Time based plots for the north face results, N2 and N3, and east face results, E2, were examined for the whole 1985-86 season to see if any trends could be determined. Figures 8 and 9 do not show any discernable trends with time over the 1985-86 winter season. Softening by a factor of two would appear as a change of the calibration factor, from -30 kN/us to -60 kN/us.
Calibration of SG N with MEDOF face load Calibration factors with R2 >= 0.70
-45 -40 -35 -30 -25 -20 -15 -10 -5 0
1985 Oct 30 1985 Dec 19 1986 Feb 07 1986 Mar 29 1986 May 18 1986 Jul 07 Date SG Calib rat ion F a ct o r (kN/ m s train ) N2 N3
Calibration of SG E with MEDOF face load Calibration factors with R2 >= 0.70
-45 -40 -35 -30 -25 -20 -15 -10 -5 0
1985 Oct 30 1985 Dec 19 1986 Feb 07 1986 Mar 29 1986 May 18 1986 Jul 07 Date SG C a libration F a c tor (kN /us ) E2
Figure 9 Strain gauge SG09 calibration factors for East face as a function of time
8. PANEL 1010 OVERLOAD ON MAY 12
Panel 1010 on the north face experienced significant loads on May 12. The lower panels on the northeast corner and east faces were also checked (1020 and 1030), but no loads were registered on them. The records for 1008, 1009 and 1010 are presented in Figure 10. At about 03:25 the record for 1010 was cut off and after time 03:58 the record also looks suspicious – it is unnaturally flat. The flat line portion around 03:25 is blown up (Figure 11) and it is clear the instrument went off scale. Panel 1010 was numbered 1002 in the original calibration and had a factor of 1.432 kPa/mm for a 1 inch (25.4 mm) diameter sight tube. For the 1985-86 season tube diameters were standardized to ¾ inch (19.1 mm) so the factor became 0.81 kPa/mm. Panel 1010 had the lowest calibration factor of all 31 panels, and was thus the softest panel. This was noted at the time. With a factor of 0.81 kPa/mm, 1MPa would produce a 1235 mm increase in level in the sight tube. A pressure of 1 MPa is
equivalent to a force of 3 MN or 300 tonnes on the 3 m2 panel. The measured load increase
on panel 1010 was about 450 t (1.5 MPa), so the elevation change should have been 1852 mm. Depending on the initial fluid level, this could have been sufficient to produce an off-scale condition. The measured load decrease was about 600 t (2 MPa), equivalent to a 2470 mm level drop. The record after 03:58:08 is also expanded (Figure 12) and it is unusually
constant. Such a constant level record could be produced if sufficient fluid was lost from the top of the sight tube that after the ice load was removed, the fluid level dropped below the location of the pressure transducer. The sight tubes were originally 2 m long, but were lengthened to about 2.4 m (Allan Strandberg, 2008, personal communication). Thus the
“overload” level and the “off-scale” level are consistent with a 2.4 m long sight tube. A softening of the Adiprene buttons from their original stiffness would make the “overload” even more likely.
May 12 -100 0 100 200 300 400 500 600 02:38:24 02:52:48 03:07:12 03:21:36 03:36:00 03:50:24 04:04:48 04:19:12 time, May 12 M edof p anels un-zeroe d ( tonn es ) MEDOF 1008(N2) Tonnes PANEL 1009(N2) Tonnes PANEL 1010(N2) Tonnes
May 12 MEDOF PANEL 1010(N2) 0 100 200 300 400 500 600 03:21:36 03:24:29 03:27:22 03:30:14 03:33:07 03:36:00 time M edof pane l u n -zero ed (ton nes) Off scale, over loaded 03:26:03
after 03:26:03 use -42 tonnes as a zero for 1010 (N2)
up to 03:26:03 use 93 tonnes as a zero for panel 1010 (N2) 03:25:00
Figure 11 Suspicious record for Panel 1010 from 03:25:00 – 03:26:03
May 12 MEDOF PANEL 1010(N2)
-100 -50 0 50 100 150 200 03:36:00 03:43:12 03:50:24 03:57:36 04:04:48 04:12:00 04:19:12 04:26:24 time Me dof pane l un-z e ro ed (t on nes ) '03:58:08
To make the overload circumstances easier to follow, the arrangement of the sight tube and pressure transducer, taken from the original FMS Engineers (1983) report is illustrated in Figure 13. This shows the original installation where the sight tube was 2000 mm long. It can be seen that if a sufficiently large load is applied to the MEDOF panel it is possible for the fluid level in the sight tube to reach a point where it would overflow into the Graduated Cylinder at the top of the tube. Presumably this would allow the overflow to be measured and the maximum load determined. Once overflow had occurred, and the load was removed, it is possible for the fluid level in the sight tube to drop below the bottom inlet to the transducer and it would give a constant output, representing zero pressure.
9. LIMITS ON MEDOF PANEL RESPONSE
The experience of the overload situation for panel 1010 on May 12 raised the idea of a
possible way to establish an upper limit on the softening of the MEDOF panels. We have the original calibration (kPa/mm) and the maximum load on each panel during the 1985-86 season. Converting the maximum load to an equivalent maximum pressure, the increase in level in the sight tube was calculated. This increase in level (mm) was compared with the length of the sight tube to see if an overload (off-scale) condition was likely. I spoke to Alan Strandberg and he confirmed that some, but not all sight tubes were replaced with longer ones, 2400 mm in place of the original 2000 mm. He has no records of which ones were replaced. As explained previously in this Appendix, we are only able to measure the height of fluid in the sight tubes, either by direct observation, or measurement with pressure transducers. If the panel softens and a lower load is applied we could still get the same change in fluid elevation in the sight tube. Thus it is not possible to infer anything about the degree of panel softening from the presence, or absence, of overloading.
10. SUMMARY
AND
CONCLUSIONS
The original application of MEDOF panels was in the ice around the Tarsiut Caissons in 1981. All 20 panels were placed in-situ in the ice cover, either close to the caissons (within 1-2 m), or in the surrounding rubble. Four of the panels recovered from the ice were recalibrated. Three of the four panels showed a reduction in stiffness of about 30%, and one panel showed no change. Over the winter 1982-83, 30 panels were deployed in the ice around the Tarsiut caissons. The panels were recovered in the spring and 10 were recalibrated. The calibration factors of individual panels decreased by between 0 and 20%, with an average reduction of 13%.
In 1991, Canatec conducted an error analysis of the MEDOF panels and, among other issues, the identified the polyurethane button material as Adiprene L-100. Specifications on the polyurethane provided by the supplier showed that the effective stiffness of the buttons was dependent on the bond between the buttons and the material to which they were bonded. The failure of the bond on one face of the button reduced the stiffness by a factor of 2, and if both bonds failed, the effective stiffness reduced by a factor of 5. Personal communication with the personnel who manufactured the MEDOF panels indicated that button separation was possible, and could be an explanation for the apparent softening of the MEDOF panels from the Tarsiut field programs.
Experience with recalibration of MEDOF panels which had been subjected to ice loading in the field showed a reduction in stiffness, and button separation was identified as a possible mechanism for apparent softening of the panels. Thus softening of the panels as a result of repeated ice loading is possible.
11. REFERENCES
Canatec Consultants Ltd. and UBC, 1991. Error Analysis of Medof Panels. Prepared by Canatec Consultants Ltd. and A.B. Dunwoody of UBC, for Amoco Production Company. (CHC 10-54)
FENCO, 1982. Tarsiut Island Research Program, Tarsiut Report #2, The MEDOF Panel, Vol. 2, for Canadian Marine Drilling Ltd., November 10, 1982 (CHC 12-46)
Fenco Maclaren Shawinigan (FMS) Engineers Inc., 1983a. Recalibration of 10 Tarsiut panels, September 22, 1983 report of FMS Engineers to Gulf Canada Resources Inc. (CHC 12-21) Fenco Maclaren Shawinigan (FMS) Engineers Inc., 1983b. Final report: Calibration report Gulf Canada Resources Inc. 31 Medof panels. FMS report to Gulf Canada. In Appendix A of Gulf Canada Resources Inc. Phase 1A Molikpaq Performance at Amauligak I-65, Volume XI Errata and Supplementary Information (CHC 14-11)
Klohn-Crippen, 1995. Molikpaq case history digital data transfer. Report prepared for National Research Council. (CHC 14-54)
Rogers, B.T, Spencer, P.A. and Hardy, M.D., 1991. Dynamic ice/structure interaction with the Molikpaq at Amauligak I-65; Phase 2, Vol. 2 of 2 – Load measurement on the Molikpaq at Amauligak I-65. Gulf Canada Resources Ltd., April 1991. (CHC 14-24)