HAL Id: tel-01123711
https://tel.archives-ouvertes.fr/tel-01123711v2
Submitted on 29 May 2015HAL is a multi-disciplinary open access archive for the deposit and dissemination of sci-entific research documents, whether they are pub-lished or not. The documents may come from teaching and research institutions in France or abroad, or from public or private research centers.
L’archive ouverte pluridisciplinaire HAL, est destinée au dépôt et à la diffusion de documents scientifiques de niveau recherche, publiés ou non, émanant des établissements d’enseignement et de recherche français ou étrangers, des laboratoires publics ou privés.
Knowledge-based scaling for biological models
Anna Zhukova
To cite this version:
Anna Zhukova. Knowledge-based scaling for biological models. Computer science. Université de Bordeaux, 2014. English. �NNT : 2014BORD0427�. �tel-01123711v2�
THÈSE PRÉSENTÉE
POUR OBTENIR LE GRADE DE
DOCTEUR DE
L’UNIVERSITÉ DE BORDEAUX
ÉCOLE DOCTORALE DE MATHÉMATIQUES ET D’INFORMATIQUE SPÉCIALITÉ : INFORMATIQUE
Par Anna ZHUKOVA
KNOWLEDGE-BASED GENERALIZATION FOR METABOLIC
MODELS
Généralisation de modèles métaboliques par connaissances
Sous la direction de : David James SHERMAN
Soutenue le 18 décembre 2014
Membres du jury :
Mme JOHNEN, Colette PR U. Bordeaux Présidente Mme DEVIGNES, Marie-Dominique CR CNRS Rapportrice M. FERTIN, Guillaume PR U. Nantes Rapporteur M. DURRENS, Pascal CR CNRS Examinateur Mme ROPERS, Delphine CR Inria Examinatrice M. SHERMAN, David James DR Inria Directeur de thèse
Titre : Généralisation de modèles métaboliques par
connaissances
Résumé :
Les réseaux métaboliques à l’échelle génomique décrivent les
relations entre milliers de réactions et molécules biochimiques pour améliorer notre
compréhension du métabolisme. Ils trouvent des applications dans les domaines
chimiques, pharmaceutiques, et dans la biorestauration.
La complexité de modèles métaboliques mets des obstacles á l’inférence des
modèles, à la comparaison entre eux, ainsi que leur analyse, curation et amélioration
par des experts humains. Parce que l’abondance des détailles dans les réseaux à
grande échelle peut cacher des erreurs et des adaptations importantes de l’espèce
qui est étudié, c’est important de trouver les correct niveaux d’abstraction qui sont
confortables pour les experts humains : on doit mettre en évidence la structure
essentiel du modèle ainsi que les divergences de celle-là (par exemple les chemins
alternatives et les réactions manquantes), tout en masquant les détails non
significatifs.
Pour répondre a cette demande nous avons défini une généralisation des modèles
métaboliques, fondée sur les connaissances, qui permet la création des vues
abstraites de réseaux métaboliques. Nous avons développé une méthode
théorétique qui regroupe les métabolites en classes d’équivalence et factorise les
réactions reliant ces classes d’équivalence. Nous avons réalisé cette méthode
comme une bibliothèque Python qui peut être téléchargée depuis
metamogen.gforge.inria.fr.
Pour valider l’intérêt de notre méthode, nous l’avons appliquée à 1 286 modèles
métaboliques que nous avons extraits de la ressource Path2Model. Nous avons
montré que notre méthode aide l’expert humain à relever de façon automatique les
adaptations spécifiques de certains espèces et à comparer les modèles entre eux.
Après en avoir discuté avec des utilisateurs, nous avons décidé de définir trois
niveaux hiérarchiques de représentation de réseaux métaboliques : les
compartiments, les modules et les réactions détaillées. Nous avons combiné notre
méthode de généralisation et le paradigme des interfaces zoomables pour
développer Mimoza, un système de navigation dans les réseaux métaboliques qui
crée et visualise ces trois niveaux. Mimoza est accessible en ligne et pour le
téléchargement depuis le site mimoza.bordeaux.inria.fr.
Mots clés :
modélisation métabolique; généralisation par connaissances;
visualisation.
Title : Knowledge-based generalization for metabolic
models
Abstract :
Genome-scale metabolic models describe the relationships between
thousands of reactions and biochemical molecules, and are used to improve our
understanding of organism’s metabolism. They found applications in pharmaceutical,
chemical and bioremediation industries.
The complexity of metabolic models hampers many tasks that are important during
the process of model inference, such as model comparison, analysis, curation and
refinement by human experts. The abundance of details in large-scale networks can
mask errors and important organism-specific adaptations. It is therefore important to
find the right levels of abstraction that are comfortable for human experts. These
abstract levels should highlight the essential model structure and the divergences
from it, such as alternative paths or missing reactions, while hiding inessential
details.
To address this issue, we defined a knowledge-based generalization that allows for
production of higher-level abstract views of metabolic network models. We developed
a theoretical method that groups similar metabolites and reactions based on the
network structure and the knowledge extracted from metabolite ontologies, and then
compresses the network based on this grouping. We implemented our method as a
python library, that is available for download from metamogen.gforge.inria.fr.
To validate our method we applied it to 1 286 metabolic models from the Path2Model
project, and showed that it helps to detect organism-, and domain-specific
adaptations, as well as to compare models.
Based on discussions with users about their ways of navigation in metabolic
networks, we defined a 3-level representation of metabolic networks: the full-model
level, the generalized level, the compartment level. We combined our model
generalization method with the zooming user interface (ZUI) paradigm and
developed Mimoza, a user-centric tool for zoomable navigation and
knowledge-based exploration of metabolic networks that produces this 3-level representation.
Mimoza is available both as an on-line tool and for download at
mimoza.bordeaux.inria.fr.
Inria / CNRS / University of Bordeaux
joint project-team MAGNOME
Table of contents
Table of contents vii
List of figures xi
List of tables xv
1 Introduction 1
1.1 Introduction . . . 1
1.2 Metabolism and metabolic networks . . . 1
1.3 History of metabolic modeling . . . 2
1.4 Goals of metabolic modeling . . . 3
1.5 Metabolic modeling workflow . . . 4
1.6 Understanding genome-scale models . . . 7
1.7 Thesis aims and objectives . . . 9
1.8 Thesis overview . . . 10
2 Background 13 2.1 The organization of the cell . . . 13
2.2 Knowledge representations . . . 14
2.3 Standards for conveying knowledge . . . 16
2.3.1 Exchange formats . . . 16
2.3.2 Visualization formats . . . 17
2.4 Metabolic network reconstruction and transformation . . . 18
2.5 Navigation in biological networks . . . 21
2.5.1 Desktop visualization tools . . . 21
2.5.2 Web-based visualization tools . . . 21
viii Table of contents
3 Knowledge-based generalization of metabolic models 25
3.1 Introduction . . . 25
3.2 Mathematical basis . . . 26
3.2.1 Basic definitions . . . 26
3.2.2 Model generalization problem . . . 29
3.2.2.1 Step 1. Equivalence operation ˚∼. . . 30
3.2.2.2 Step 2. Stoichiometry preserving restriction . . . 30
3.2.2.3 Step 3. Metabolite diversity restriction . . . 37
3.2.2.4 Complete algorithm . . . 38
3.3 Discussion . . . 38
4 Validation of knowledge-based generalization 43 4.1 Applications . . . 43
4.1.1 Missing steps . . . 44
4.1.2 Alternative steps . . . 44
4.2 Comparison of generalized networks . . . 45
4.3 Detection of generalization profile classes . . . 47
4.4 Discussion . . . 49
5 Mimoza: web-based semantic zooming and navigation in metabolic networks 57 5.1 Background . . . 57
5.1.1 Existing visualization approaches . . . 57
5.2 Implementation . . . 58
5.2.1 Layers Layout . . . 59
5.2.1.1 Generalized model layout . . . 61
5.2.1.2 Generalization-based full model layout . . . 62
5.2.1.3 Node colors . . . 62
5.2.1.4 Node sizes . . . 62
5.2.1.5 Relative positions of compartments . . . 62
5.2.1.6 SBML layout . . . 63
5.2.2 ZUI . . . 63
5.2.3 Embedding . . . 64
5.2.4 Download and distribution . . . 65
5.2.5 Pipeline . . . 66
5.3 Results and Discussion . . . 66
5.4 Conclusions . . . 68
Table of contents ix
6 Conclusions 71
6.1 Main contributions . . . 71
6.2 Perspectives . . . 73
6.2.1 Compressing bipartite graphs with repetitions . . . 73
6.2.2 Finding reference models for model inference . . . 74
6.2.3 Comparing disease and healthy metabolisms . . . 75
6.2.4 Classifying related metabolisms . . . 76
6.2.5 Classifying reactions in reaction databases . . . 76
6.2.6 Suggesting extensions to metabolite ontologies . . . 78
References 79
List of figures
1.1 Metabolic modeling workflow. The figure shows the processes of metabolic model creation, improvement and usage. The processes highlighted in yel-low represent the model creation cycle: The draft model is created by model inference tools based on models for similar organism, pathway and tion information extracted from model repositories and pathway and reac-tion databases; it is then iteratively improved during the process of curareac-tion and analysis. The resulting model can in its turn be added to model repos-itories. The processes highlighted in red show model usages: simulation and knowledge-oriented exploration. The processes highlighted in green describe comparison and combination of several models. As the model cre-ation cycle, they also include the curcre-ation and analysis stage. The processes represented with the red arrows can use model generalization, described in this thesis, to discover similarities between the reactions and metabolites in the model, or in different models, and to aid a human understanding of large networks. . . 5 1.2 Sixty-seven reactions happening in the peroxisome compartment of the
yeast Y. lipolytica (MODEL1111190000 [Loira et al., 2012]). Reactions are represented as squares linked by edges to their reactant and product metabo-lites (circles). The size of the figure does not allow for readable metabolite labels, so they are omitted. The reaction graph is disconnected as the trans-port reactions are not shown. . . 8 1.3 Sixty-seven reactions happening in the peroxisome compartment of the
yeast Y. lipolytica (MODEL1111190000 [Loira et al.,2012]), with similar metabo-lites/reactions sharing the same color. The size of the figure does not allow for readable metabolite labels, so they are omitted. The reaction graph is disconnected as the transport reactions are not shown. . . 11
xii List of figures
1.4 The generalized representation of the peroxisome compartment of the yeast Y. lipolytica (MODEL1111190000 [Loira et al.,2012]). Similar metabo-lites/reactions, that share the same color in Figure 1.3, are grouped into generalized metabolites/reactions, colored accordingly. The number given in parentheses and the size of each node indicates how many entities it generalizes. Most of the disconnected reactions in Figure1.3, for example, four fatty acid oxidation reactions (light blue), are reconnected to the main loop after generalization; highlighting the fact that they are part of the
β-oxidation of fatty acids pathway. . . . 11
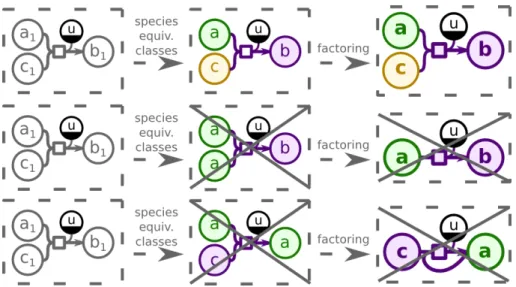
3.1 Model generalization method. Generalization first groups the metabolites into equivalence classes, and then factors them into generalized metabo-lites. The reaction equivalence classes and factoring are inferred from the metabolite classes. . . 28 3.2 Stoichiometry preserving restriction. The top part shows the correct
gen-eralization that obeys restriction3.2. Two bottom parts show generaliza-tions that would change the reaction stoichiometry, and thus are not allowed. 28 3.3 Metabolite diversity restriction. The top part shows the correct
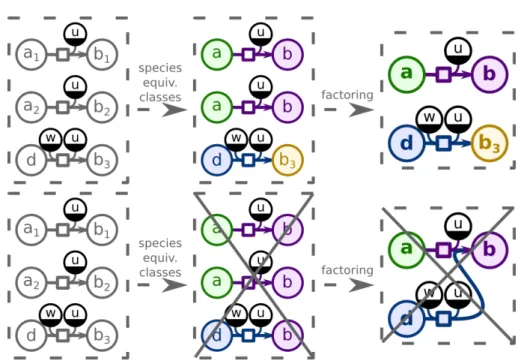
general-ization that obeys restriction3.3. The bottom part violates the restriction as there is no evidence in the model (i.e., no equivalent reaction) of the metabolite b3belonging to the same equivalence class as b1and b2. . . 29
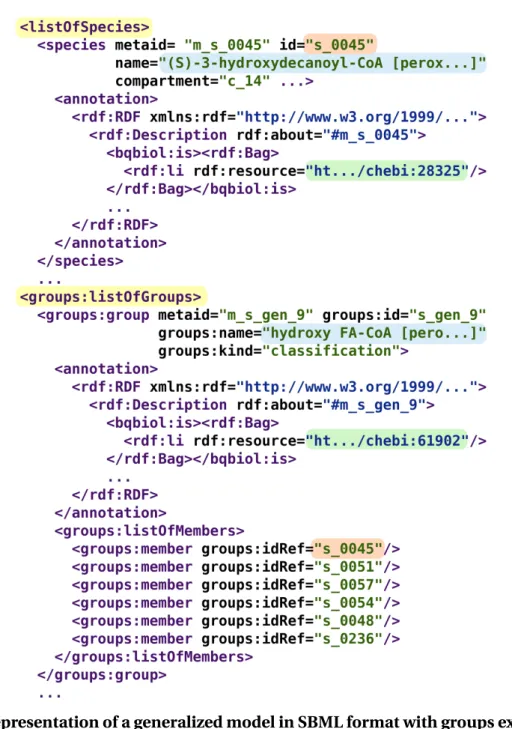
3.4 Representation of a generalized model in SBML format with groups ex-tension. The output SBML file contains the initial model (including the lists of metabolites (called species in SBML), reactions, etc.) plus the
listOf-Groups section that represents non-trivial quotient metabolite and reaction
sets. In the figure, a group representing a quotient metabolite set of hydroxy
fatty acyl-CoAs is shown; it includes (S)-3-hydroxydecanoyl-CoA (s_0045), (S)-3-hydroxylauroyl-CoA (s_0051), etc. Each of those metabolites was
pre-viously declared in the listOfSpecies section. . . . 41
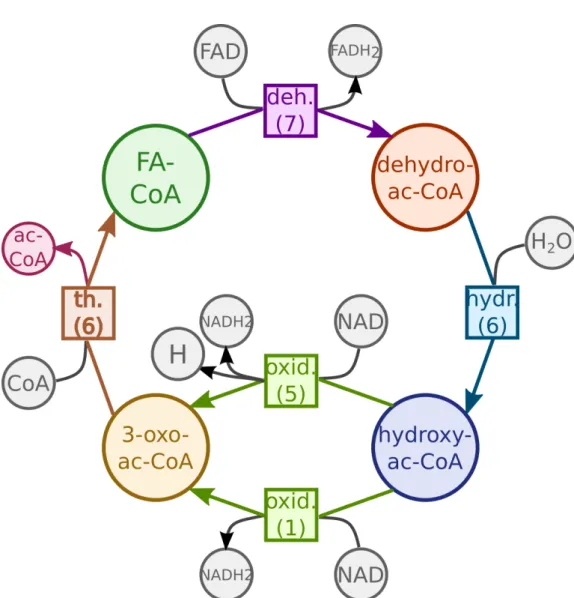
4.1 Generalization ofβ-oxidation of fatty acids. The initial representation of the ofβ-oxidation of fatty acids pathway (top) and its generalized represen-tation (bottom). The number in parentheses in each generalized reaction shows how many specific reactions were grouped together. . . 50 4.2 Missing reactions. The generalized representation ofβ-oxidation of fatty
acids of BMID000000136479 (oleaginous yeast Y. lipolytica, noncurated
List of figures xiii
4.3 Generalization ofβ-oxidation of fatty acids of MODEL1111190000 (Y.
lipoly-tica, curated network from [Loira et al.,2012]). The cycle is complete. . . 51 4.4 Alternative paths. The generalized representation ofβ-oxidation of fatty
acids of BMID000000103487 (nonpathogenic bacterium Burkholderia thai-landensis). Two variants of the oxidation reaction (bottom) are present. . . . 52 4.5 The self-organizing maps (SOMs) of model generalization profiles. The
8 × 6 SOM (top) shows that there exist distinct classes of profile forms. For example, it shows that the right tail, after scaling, has a lot of influence on the classification. The 2 × 2 SOM (bottom) detects the 4 main classes of profile forms: (a) some generalization around 10-15; (b) almost no gen-eralization; (c) significant generalization peaking at 10-25; (d) significant generalization with an additional peak at 25-35. . . 55 5.1 Three zoom levels The most general zoom level (bottom) shows the
perox-isome and a generalized transport reaction. The intermediate zoom (mid-dle) shows the generalized processes inside the peroxisome compartment. The most detailed view (top) reveals the metabolites and reactions of the initial model. . . 60 5.2 GeoJSON representation of a reaction. An SBML reaction is stored as a
GeoJSON Point feature, with its layout coordinates encoded in the geome-try section. The identifiers, labels and annotations, as well as the informa-tion on the reactant and product metabolites are stored as properties. The “type” property value specifies that this GeoJSON feature is a reaction. . . . 64 5.3 A reaction pop-up. (right part) An example of a pop-up that opens when a
user clicks on a reaction: It contains the information on the reaction name, identifier, reactant and product metabolites and their stoichiometries, as well as gene associations. (left part) Gene names are hyperlinks redirecting to the NCBI Gene database [NCBI,2014]. . . 65
List of tables
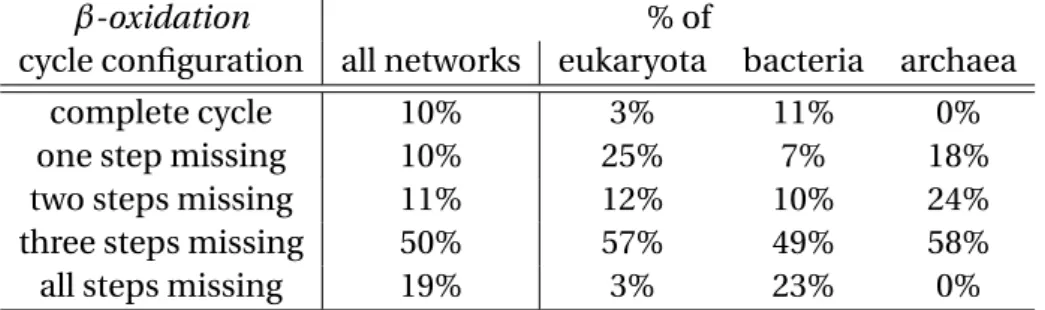
4.1 Presence of reactions of the generalizedβ-oxidation of fatty acids cycle in different networks across the three superkingdoms (•• stands for two ver-sions of the corresponding reaction present in the network). . . 46 4.2 Percentage of different generalizedβ-oxidation of fatty acids cycle
configu-rations in different networks. . . 46 4.3 Presence of reactions of the generalizedβ-oxidation of fatty acids cycle in
different networks of fungal genomes. . . . 53 5.1 Comparison of ZUIs for metabolic models. . . 70 6.1 Performance of the model generalization method on 269 genome-scale metabolic
List of Algorithms
1 Compute ˚∼ . . . 31 2 PreserveStoichiometry . . . 32 3 GreedySetCover . . . 37 4 Maximize . . . 39 5 GeneralizeModel . . . 40Chapter 1
Introduction
1.1 Introduction
Fundamental questions in the life sciences can now be addressed at an unprecedented scale through the combination of high-throughput experimental techniques and advanced computational methods from the computer sciences. The field of computational biology or bioinformatics has grown around intense collaboration between biologists and com-puter scientists working towards understanding living organisms as systems. One of the key challenges in this study of systems biology is understanding how the static informa-tion recorded in the genome is interpreted to become dynamic systems of cooperating and competing biomolecules.
Metabolic modeling is a perfect example of these challenges.
1.2 Metabolism and metabolic networks
Metabolism is a mechanism composed by a set of biochemical reactions, by which the
cell sustains its growth and energy requirements. It includes several catabolic (break-ing down large molecules into smaller units) and anabolic (construct(break-ing molecules from smaller units) pathways of enzyme-catalyzed reactions that import substrates from the environment and transform them into energy and building blocks required to build the cellular components. Metabolic pathways are interconnected through intermediate metabo-lites, forming complex networks [Palsson,2006].
Catalysis is the increase in the rate of a chemical reaction due to the participation
of an additional substance called a catalyst. Enzymes are natural proteins that catalyze chemical reactions.
2 Introduction
Metabolic network model is a knowledge construct for modeling of metabolic
pro-cesses in the cell. It describes molecular species participating in organisms’ metabolism and biochemical reactions between them. Metabolic models are used to improve under-standing how the genotype (set of enzymes encoded by a genome and their regulation) influences phenotype (the identity of the molecules that a metabolic network can syn-thesize, and the rate of synthesis) [Wagner,2012].
The primary topological properties of a biochemical reaction network are given by
stoichiometry. The stoichiometry of chemical reactions is fixed and is described by
in-tegral numbers counting the molecules that react and that form a consequence of the chemical reaction. Stoichiometry is invariant between organisms for the same reactions and does not change with pressure, temperature or other conditions [Palsson,2011].
The kinetic constants, on the contrary, can vary across a population and change over time through evolution. Even though biological information is growing rapidly, the ki-netic information is not always available, especially for genome-scale models.
Metabolic phenotypes can be defined in terms of flux distributions through a metabolic
network. Dynamic analysis of metabolic flux distributions require kinetic and concentra-tion informaconcentra-tion about enzymes and various cofactors. For genome-scale metabolic net-works, that often lack this information, the constraint-based modeling procedure [ Bonar-ius et al.,1997;Edwards et al.,2002] is applicable. It does not strive to find a single so-lution but rather finds a collection of all allowable soso-lutions to the governing equations that can be defined (a solution space). Solutions that violate any of the imposed con-straints are excluded from the solution space. The subsequent application of additional constraints further reduces the solution space and, consequently, reduces the number of allowable solutions that a cell can utilize. The constraints that have been used in the first generation of constraint-based models include stoichiometric constraints, thermo-dynamic constraints (regarding the reversibility of a reaction), and enzymatic capacity constraints [Reed and Palsson,2003].
1.3 History of metabolic modeling
The scale of metabolic network reconstructions may range from individual pathways to whole genomes. In 1943 B. Chance published the first numerical simulation of a sin-gle enzyme biochemical system, solving the equations for the systems’ behavior using a mechanical differential analyzer [Chance,1943]. Since then metabolic models started emerging.
1.4 Goals of metabolic modeling 3
complete genomic sequence was obtained, it was a genome of the bacterium Haemophilus
influenzae Rd [Fleischmann et al.,1995]. This led to the creation of the first genome-scale metabolic model of H. influenzae Rd [Edwards and Palsson,1999] in 1999. It contained 488 reactions operating on 343 metabolites. It was further improved in 2000 [Schilling and Palsson,2000]. In the following years several other bacteria genome-scale models were created (Escherichia coli MG1655 [Edwards and Palsson,2000], Helicobacter pylori 26695 [Schilling et al.,2002]). There did not exist a standard way of model representation back then and these models were mostly encoded as xls files.
In 2003 the need of a standard for model encoding was addressed by the creation of the Systems Biology Markup Language (SBML) [Hucka et al.,2003]. The same year a fist genome-scale model for a yeast Saccharomyces cerevisiae [Förster et al., 2003] was created and encoded in SBML. This model contained 1 175 metabolic reactions and 584 metabolites in three compartments: cytosol, mitochondria and extracellular.
As one can see, not only a large increase in the number of computational models in biology was taking place, but also to a dramatic increase in their size and complex-ity. The number of models deposited in BioModels Database [Li et al.,2010] is doubling roughly every 22 months while the average number of relationships between variables per model is doubling every 13 months [Courtot et al.,2011]. The first release of BioMod-els Database in 2005 published 30 modBioMod-els. They contained on average 30 relationships per model, and this number rose to around 100 in the 17th release (in 2010) and keeps in-creasing. The 28th release of BioModels database (September 2014) contains 1 212 mod-els.
1.4 Goals of metabolic modeling
By 2014, all the way from a single-reaction reconstructions to the systematic construction of genome-scale kinetic models [Stanford et al.,2013], containing thousands of reactions, and the first whole-cell computational model [Karr et al.,2012], was done.
Metabolic models found applications in pharmaceutical, chemical and bioremedia-tion industries. The initial applicabioremedia-tions of metabolic models were in designing metabolic
engineering strategies that would result in enhanced production of desired target
prod-ucts [Kim et al.,2012]. Current examples include production of food and beverages [Fleet,
2007], pharmaceuticals [Liu et al., 2014], and biofuels [Hollinshead et al., 2014]. See [Copeland et al., 2012] for the review of common tasks encountered by metabolic en-gineers and the description of relevant computational tools; and [Pitkänen et al.,2014] for an example of comparative metabolic reconstruction of genome-scale network
mod-4 Introduction
els for 49 fungal species, including some of the most important production organisms in industrial biotechnology.
The development of genome-scale metabolic models of several pathogenic microor-ganisms (e.g., H. pylori [Thiele et al., 2005], A. baumannii [Kim et al., 2010], B.
ceno-cepacia [Fang et al., 2011]) lead to their employment for the analysis of diseases and for the discovery of novel drug targets suitable for treating the disease. [Chavali et al.,
2012] reviews in silico strategies to identify effective drug targets, focusing on pathogen metabolic networks. The consensus reconstruction of human metabolism [Thiele et al.,
2013] has allowed investigation of human metabolic diseases and simulation of drug ac-tions.
1.5 Metabolic modeling workflow
Metabolic network reconstruction can address various objectives. Examples include cre-ation of a model for a new organism from its genomic data and a reference model for a similar organism; creation of a larger-scale model by combining several models of dif-ferent aspects of organism’s metabolism; improving an existing model by incorporating new data and new expertise. To accomplish these objectives the following tasks are used (see Figure1.1).
Inference
Metabolic networks for more and more organisms are being inferred and stored in
bio-logical network collections, such as the Biomodels database [Li et al.,2010], BIGGs [ Schel-lenberger et al.,2010], JWS online [Snoep and Olivier,2003]. The metabolic network re-construction process is becoming more and more advanced, and there now exist various tools for semi-automatic model inference, e.g., PathwayTools [Karp et al., 2002], SuB-liMinaL [Swainston et al.,2011], CoReCo [Pitkänen et al.,2014]. We describe inference tools in more detail in Chapter 2. During the process of network reconstruction, they infer metabolic reactions from pathway and reaction databases such as KEGG [Kanehisa et al.,2012] and Reactome [Milacic et al.,2012], and from existing networks for similar organisms using genomic data [Thiele and Palsson, 2010]. Although automatic model inference tools and genomic comparison methods are becoming steadily more sophis-ticated, they may still leave gaps in the model or add erroneous reactions. The intrinsic and extrinsic correctness of the model should be checked during the phases of analysis and curation.
1.5 Metabolic modeling workflow 5
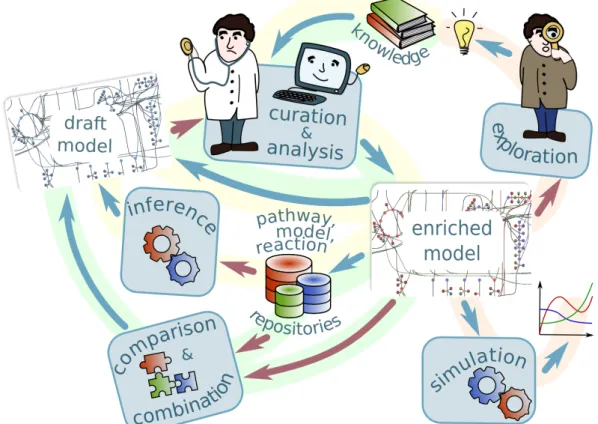
Fig. 1.1 Metabolic modeling workflow. The figure shows the processes of metabolic model creation, improvement and usage.
The processes highlighted in yellow represent the model creation cycle: The draft model is created by model inference tools based on models for similar organism, pathway and reaction information extracted from model repositories and pathway and reaction databases; it is then iteratively improved during the process of curation and analysis. The resulting model can in its turn be added to model repositories.
The processes highlighted in red show model usages: simulation and knowledge-oriented exploration.
The processes highlighted in green describe comparison and combination of several
models. As the model creation cycle, they also include the curation and analysis stage.
The processes represented with the red arrows can use model generalization, described in this thesis, to discover similarities between the reactions and metabolites in the model, or in different models, and to aid a human understanding of large networks.
Curation and analysis
The inferred draft network needs to be refined during several iterations of analysis, cura-tion and improvement [Swainston et al.,2011;Thiele and Palsson,2010]. The goal of the
model analysis is to verify that the model does not contain inner contradictions and
6 Introduction
are well defined; the reactions are chemically balanced, etc. Various model analysis tools, e.g., FASTGAPFILL [Thiele et al.,2014] for gap filling, CellNetAnalyser [Klamt et al.,2007] for for finding dead ends and blocked reactions, SuBliMinaL Toolbox [Swainston et al.,
2011] for reaction balancing, can facilitate model analysis; but human expert’s knowl-edge on organism’s metabolism still plays an important role.
Curation is performed to ensure, first, that all of the knowledge that the experts deem
pertinent is recorded in the model, and second, that the knowledge is recorded in a co-herent way. The first depends on the requirements of the experts: a model for a cell factory used in an industrial process would need precise kinetics but may only require the reactions active in steady state that participate in the pathway that produces or con-sumes the target molecule, whereas a whole-genome model used to understand func-tional dependencies between genes would need to be as complete as possible but may not require reaction kinetics. The second concerns the internal consistency of what is recorded: metabolites and reactions must be annotated with ontology terms from appro-priate knowledge bases, reaction stoichiometry must be consistent, transport between compartments must be assured, and so on. Curation and analysis of models is an itera-tive process, ideally repeated many times to refine the draft model until the needed level of quality is achieved.
The curation by a human expert requires a means of splitting genome-scale models into smaller units that can be checked and analyzed independently. At a higher level, appropriate levels of abstraction need to be found to allow experts to compare whole genome networks. Good model visualization tools are also required.
Simulation
The improved model, created during the iterations of curation and analysis, can be used for computer simulation to obtain numerical results. We do not exploit simulation in this thesis.
Exploration
The model can also be used for knowledge-oriented exploration to obtain new knowl-edge about the processes happening in the organisms’ metabolism, and the relationships between them, e.g., the “redundancy” of the model: discovery of similar reactions, and alternative pathways.
Means of splitting genome-scale models into smaller units, appropriate levels of ab-straction and good model visualization tools are as important for model exploration task
1.6 Understanding genome-scale models 7
as they are for curation.
Comparison and combination
Model comparison and combination is another important task. Possible scenarios in-clude comparison to a different model of the same organism, with potential merging into a new, more complete, model; comparison of a model of a healthy organism to the one of a metabolism suffering from a disease to discover disease-specific metabolic adap-tations. A genome-scale model can be created by combining several smaller models, describing different metabolic processes in a species [Schulz et al.,2006], where model comparison is needed to detect overlaps. Such a model can be used as a draft model, and will need to undergo the analysis and curation phase. Finally, a group of models for related species can be compared and combined to produce a concise representation of their common metabolism, to study the common properties of a group, as well as the organism-specific adaptations.
There exist various software facilitating model merging, e.g., semanticSBML [Krause et al.,2010], OREMPdb [Umeton et al.,2012], PathCase-SB Model Composition Tool [Coskun et al.,2013], but all of them require human expert’s intervention in cases when the models to be merged are incompatible or contradict to each other, as well as for better discovery of common parts. Thereby, after the creation, the combined model becomes a draft and should in its turn undergo the analysis and curation cycle. We describe model merging tools in more detail in Chapter2.
By combining these modeling tasks into workflows, as in Figure1.1, one can accom-plish the modeling objectives listed above.
1.6 Understanding genome-scale models
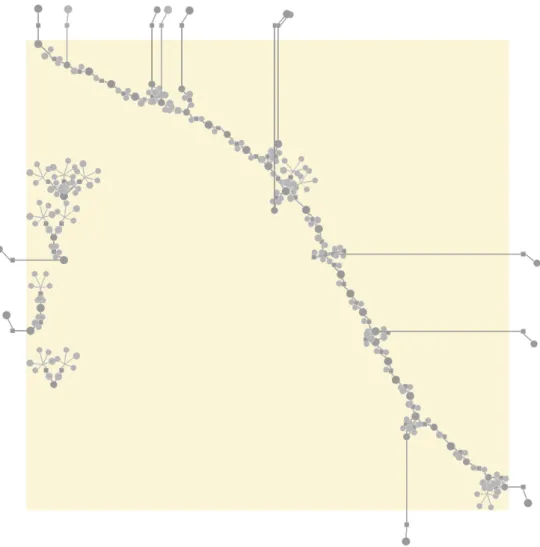
Curation and analysis, exploration, comparison and combination of metabolic models are tasks that involve human experts’ work. Human experts, who generally speaking understand best small-sized networks, containing up to hundreds of nodes [Herman et al., 2000; von Landesberger et al., 2011], are distracted by the abundance of details in genome-scale networks (needed for accurate computer simulation) and cannot easily identify the reactions that require their intervention. For example, Figure1.2shows the peroxisome compartment of the model of the yeast Yarrowia lipolytica (MODEL1111190000 [Loira et al.,2012]). Even though it contains only 67 reactions (out of 2 002 in the whole
8 Introduction
genome-scale models into smaller units that can be checked and analyzed indepen-dently by human experts is required.
Fig. 1.2 Sixty-seven reactions happening in the peroxisome compartment of the yeast Y. lipolytica (MODEL1111190000 [Loira et al., 2012]). Reactions are represented as squares linked by edges to their reactant and product metabolites (circles). The size of the figure does not allow for readable metabolite labels, so they are omitted. The reaction graph is disconnected as the transport reactions are not shown.
Much of the complexity of the reaction network comes from biochemically similar
reactions that operate on slightly different substrates. For example, in the
aforemen-tioned peroxisome compartment of Y. lipolytica model six acyl-CoA oxidase reactions are present, transforming fatty acyl-CoAs differing in their carbon chain length
(decanoyl-CoA, lauroyl-(decanoyl-CoA, etc.) into the corresponding unsaturated fatty acyl-CoAs. These
reac-tions correspond to the same Enzyme Commission number: EC 1.3.3.6. There are also several similar reactions for other steps of theβ-oxidation of fatty acids pathway [Metzler
1.7 Thesis aims and objectives 9
and Metzler,2001]. Figure1.3shows the same processes as in Figure1.2but with similar metabolites and reactions colored accordingly. Grouping similar metabolites and similar reactions, would lead to a generalized peroxisome representation, as shown in Figure1.4. The generalized model describes theβ-oxidation of fatty acids pathway in a generic way: as a transformation of saturated fatty acyl-CoA into fatty acyl-CoA (4-), then into hydroxy
fatty acyl-CoA, 3-oxo fatty acyl-CoA, and back to saturated fatty acyl-CoA (with a shorter
carbon chain). The beta-oxidation chain of the reactions in the initial model, transform-ing step-by-step the saturated fatty-acyl-CoA with the longest carbon chain into the one with the shortest chain, in the generalized model appears as a cycle (generalizing all the
fatty-acyl-CoAs into one metabolite, regardless the chain length).
Although all of these details are needed for accurate computer simulation, and are common to many models, it is often not them but instead the differences from the
com-mon pattern that demand curator’s attention. These differences may be caused by
er-rors in the model, such as missing steps or erroneous connections between pathways, or they may be organism-specific adaptations such as alternative pathways that are bio-logically interesting. For example, the generalized model of the peroxisome of Y.
lipoly-tica (Figure 1.4) highlights the fact that there is a particularity concerning C24:0-CoA
(tetracosanoyl-CoA) (red, inside the cycle): There exists a“short-cut” reaction, producing
it directly from another fatty acyl-CoA (yellow), avoiding the usual four-reaction beta-oxidation chain, used for other fatty acyl-CoAs. An appropriate level of abstraction is needed to allow experts to explore and compare whole-genome networks.
1.7 Thesis aims and objectives
To this end, in this thesis we define a 3-level zoomable representation of metabolic mod-els, that can be used by human experts during the curation and analysis step.
• The most abstract level represents compartmentalization of the model, and fo-cuses on such questions as: Are all the compartments present? Are they well con-nected by transport reactions?
• The second level shows the modules inside of each of the compartments. The ques-tions to be addressed on this level include: Are all the essential processes present? Is the structure of each process correct? Are there any organism-specific adapta-tions of the structure?
10 Introduction
inner structure of each of the modules with all the metabolites, reactions and their kinetics, stoichiometry and constraints.
The two abstract levels are intended for a human expert, and the last one for a computer. We develop the algorithms for model generalization at the second level, and software exploiting this representation. In Figure1.1, the processes marked with red arrows can potentially use this multilevel representation and model generalization to facilitate the human curators’ work, and as a means of bringing several models to the same level of abstracting for their comparison or knowledge-based exploration.
1.8 Thesis overview
The rest of this thesis is organized as follows. To develop an understanding of the domain, main definitions and general introduction to metabolic modeling, related methods and software are given in Chapter2.
In chapter3we formally define the method that we developed to detect similar metabo-lites and reactions in a metabolic network model. We also define the properties of gen-eralized models, obtained by this method. Chapter4describes the applications of our model generalization method to 1 286 models from the Path2Model [Büchel et al.,2013] project, and demonstrates how the generalization helps to detect problems and particu-larities in metabolic networks.
Chapter5introduces a web-based system Mimoza that combines the model general-ization method with the zoomable user interface techniques to create multilevel seman-tically zoomable representation of metabolic networks.
Finally, Chapter6summarizes the contributions of this thesis, and presents perspec-tives.
1.8 Thesis overview 11
Fig. 1.3 Sixty-seven reactions happening in the peroxisome compartment of the yeast Y. lipolytica (MODEL1111190000 [Loira et al.,2012]), with similar metabolites/reactions sharing the same color. The size of the figure does not allow for readable metabolite labels, so they are omitted. The reaction graph is disconnected as the transport reactions are not shown.
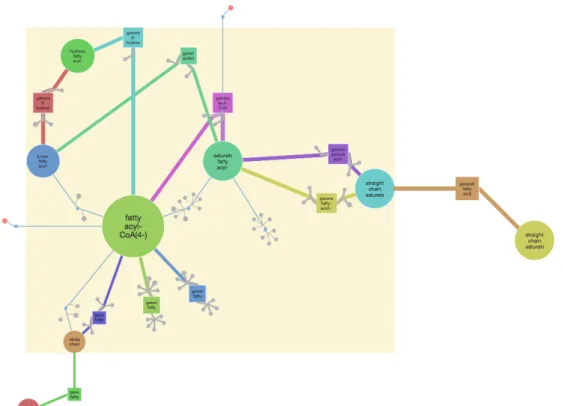
Fig. 1.4 The generalized representation of the peroxisome compartment of the yeast Y. lipolytica (MODEL1111190000 [Loira et al., 2012]). Similar metabolites/reactions, that share the same color in Figure1.3, are grouped into generalized metabolites/reactions, colored accordingly. The number given in parentheses and the size of each node indi-cates how many entities it generalizes.
Most of the disconnected reactions in Figure1.3, for example, four fatty acid oxidation reactions (light blue), are reconnected to the main loop after generalization; highlighting the fact that they are part of theβ-oxidation of fatty acids pathway.
Chapter 2
Background
This thesis builds on a great deal of existing work in metabolic modeling, knowledge rep-resentation, metabolic network reconstruction, and navigation in biological networks. These are each vast and widely studied subjects, and the literature is quite abundant. We introduce here the essential elements of this background information, focusing on those that are essential for the chapters that follow.
2.1 The organization of the cell
To develop methods that respect biological constraints as well as to provide usable tools to biologists for navigating the resulting networks, it is necessary to understand how the eukaryotic cell is organized. This organization imposes constraints on the way that reac-tions can be connected. It also provides a natural structuring of the network, that can be used for navigation.
The cell is the basic structural, functional and biological unit of all known living or-ganisms, the “building block of life”. There are two types of cells, procaryotic (microor-ganisms, bacteria, etc.) that are characterized by only one compartment, and eukaryotic that have the inner membrane that define the nucleus. The nucleus of the cell contains the genetic material or genome in form of the double-stranded DNA molecule. The area between the outer and inner membrane, including all of the components therein is called
cytoplasm [Alberts et al.,2007].
In addition to the two main compartments (nucleus and cytoplasm), eucaryotic cells have organelles, that are smaller compartments with a membrane and which contain a set of specific enzymes. Material can be transported through the membranes directly or through gates.
14 Background
it imposes the limits on the scope of model generalization. In order for generalization to be biologically sensible and mathematically possible, we perform it only inside compart-ments: similar metabolites can be grouped together only if they are located in the same compartment; same holds for reaction factoring. Compartments and their relative posi-tions also define levels for navigation, starting from extracellular space and zooming into cytoplasm and organelles. Another important constraint for generalization procedure is the consistency of transport reactions: chemically equal metabolites that belong to different compartments should be generalized to the same level of abstraction, and the corresponding transport reactions should be factored together into generalized transport reactions.
2.2 Knowledge representations
To provide an additional semantic level, a model should be further enriched with the knowledge from biological databases and ontologies, by annotation of elements of the models (such as metabolites, reactions, compartment) with appropriate identifiers. Se-mantic information adds meaning to components of the model to help identify and in-terpret them unambiguously.
Ontologies are formal representations of knowledge with definitions of concepts, their attributes and relations between them expressed in terms of axioms in a well-defined logic [Rubin et al.,2008]. Ontologies also provide identifiers for the concepts that they describe, allowing to reference these concepts unambiguously.
Examples of the knowledge resources used to add a semantic level to metabolic mod-els include ChEBI [de Matos et al.,2010], the database and ontology of Chemical Entities of Biological Interest. Among other entities, ChEBI describes small molecules (provid-ing names, definitions, links to other databases, SMILES, InChI, their chemical roles, etc.) and relates them with each other (with hierarchical and other relationships, e.g.,
decanoyl-CoA is_a medium-chain fatty acyl-CoA). In metabolic models, metabolites are
often annotated with their ChEBI identifiers.
Uniprot (Universal Protein Resource) [The UniProt Consortium,2013] is a catalog of information on proteins, and can be used for annotation of enzymes, or of reactions cat-alyzed by those enzymes.
The Gene Ontology (GO) [Ashburner et al., 2000] provides controlled vocabularies of terms representing gene product properties. It consists of three main branches. The
cellular component branch defines the parts of a cell and of extracellular environment, it
2.2 Knowledge representations 15
that occur at the molecular level, e.g., binding or catalysis. Finally, the biological process branch defines molecular events pertinent to the functioning of cells, tissues, organs, and organisms. This branch can be used for annotation of reactions.
The Rhea manually annotated database of biochemical reactions [Alcántara et al.,
2012] is a good source of knowledge for reaction annotation.
Kyoto Encyclopedia of Genes and Genomes (KEGG) [Kanehisa et al.,2012] provides a set of resources that can be used for model elements’ annotation: reactions can be linked to KEGG Pathway entries, as well as KEGG Reaction and KEGG Orthology identi-fiers; metabolites can be annotated with KEGG Compound entries.
Elements of the model can be also annotated with the terms of the Evidence Ontol-ogy (ECO) [Chibucos et al.,2014], a controlled vocabulary that describes types of scien-tific evidence within the realm of biological research (such as laboratory experiments, computational methods, manual literature curation, and other means).
Three important ontologies in the field of systems biology are described in [ Cour-tot et al., 2011]: the Systems Biology Ontology (SBO), the Kinetic Simulation Algorithm Ontology (KiSAO) and the Terminology for the Description of Dynamics (TEDDY). SBO defines the semantic information about model structure and its components. KiSAO is used to annotate the description of simulation experiments (e.g., encoded in Simulation Experiment Description Markup Language (SED-ML) [Köhn and Le Novère,2008; Wal-temath et al.,2011]) and supplies information about existing model simulation and anal-ysis algorithms, and their interrelationships through their characteristics and parame-ters. TEDDY provides terms needed for description of numerical results: it classifies the temporal behaviors observed in a simulation, the diversifications and relationships be-tween them, their characteristics, and the functional motifs generating particular types of behaviors.
These and other bio-ontologies can be found through the BioPortal [Whetzel et al.,
2011] repository of biomedical ontologies, or the OBO Foundry [Smith et al.,2007]. To keep the representation of identifiers of ontological terms and knowledge-base entries unique and machine readable standardization efforts such as Identifiers.org [Juty et al.,2012] emerge.
In these thesis, we use the cellular component branch of GO to infer relative compart-ment positions (using part_of and is_a relationships defined between the compartcompart-ments in GO) for correct model visualization. We use the hierarchical relationships defined in ChEBI for biologically sensible generalization of metabolites. While there exist various databases describing metabolites, ChEBI is the standard ontology in the biochemistry domain and defines not only the relevant terms but also the relationships between them.
16 Background
2.3 Standards for conveying knowledge
The knowledge represented in a biological model must also be communicated, between software tools, and between software and users, in ways that preserve the semantics of the knowledge. Reliable communication of this knowledge is assured by international standards, that define formats and rules for interpreting them. Metabolic network mod-els can be represented in various formats, depending on the purpose of the model: ex-change between programs, or presentation to a human user.
2.3.1 Exchange formats
For instance, the Systems Biology Markup Language (SBML) [Hucka et al.,2003] is a free and open interchange XML-based format, widely adopted by the community. SBML is intended for computer models of biological processes and can be used for models of cell signalling, metabolism, gene regulation, etc. Various simulation and analysis tools accept models in SBML format,e.g., COPASI [Hoops et al., 2006], a software applica-tion for simulaapplica-tion and analysis of biochemical networks and their dynamics, COBRApy [Ebrahim et al.,2013], a toolbox for constraint-based reconstruction and analysis, FAME [Boele et al.,2012], a web-based flux analysis [Orth et al.,2010] and modeling environ-ment, among many others.
The first SBML (level 1 version 1) specification [Hucka et al., 2001] was created in 2001 to provide a standard format for representation of the rapidly increasing number of models in systems biology. It described the format for representing the basic model structure: compartments, species (e.g., metabolites in the case of metabolic models), re-actions (processes between those species), unit definitions, parameters and rules. Since then, a group of SBML editors and the community has been constantly working on im-proving the standard to address the growing needs of the modelers. For example, in level 2 version 1 [Finney and Hucka, 2003], additional model elements: events and function definitions were introduced.
Up to level 2 version 2, SBML was a syntax standard, which expresses the mathe-matical structure of models (i.e., the variables and their mathemathe-matical relationships), but does not define what those variables represent, nor how they were generated. In level 2 version 2 [Finney et al.,2006], a standard format for annotation of model elements with identifiers from various knowledge bases was presented, therefore allowing a modeler to provide an additional, semantic, level.
With the creation of SBML level 3 version 1 [Hucka et al., 2010] the core SBML that defines the general model structure was separated from the supplementary elements
2.3 Standards for conveying knowledge 17
specific to particular model types and purposes. Those supplementary elements were moved to dedicated model packages. Examples of packages include annotations, a pack-age that supports richer annotation syntax than the regular annotations introduced in level 2 version 2, flux balance constraints, a package targeted to constraint-based metabolic models allowing to define information needed to perform the flux balance analysis (FBA) [Orth et al.,2010], qualitative models, a package for models wherein species do not represent quantity of matter and processes are not reactions per se, layout, a package that defines the spatial topology of a network diagram, groups, a package that provides a means of grouping model elements, etc.
CellML [Lloyd et al.,2004] is another XML-based format for storage and exchange of computer-based mathematical models. CellML includes information about model struc-ture (relative organization of the model parts), mathematics (equations describing the underlying processes) and metadata (semantics). CellML describes the structure and underlying mathematics of cellular models in a very general way and has facilities for describing any associated metadata, while SBML is primarily aimed at exchanging in-formation about pathway and reaction models. In CellML, the biological inin-formation is entirely stored in metadata rather than the language elements, like in SBML. Moreover, in SBML the mathematical expressions are more constrained than what is permitted in CellML.
BioPAX (Biological Pathway Exchange) [Demir et al.,2010] is a standard language to represent biological pathways at the molecular and cellular level. BioPAX can represent metabolic and signaling pathways, molecular and genetic interactions and gene regula-tion networks. BioPAX is defined in the Web Ontology Language (OWL) [McGuinness and van Harmelen,2004] and is represented in the RDF/XML format. The scope of BioPAX is narrower than the one of SBML: SBML is meant to facilitate exchange and reuse of quan-titative models, not necessarily limited to the biochemical pathways as BioPAX. BioPAX models cannot express information about sizes, amounts and kinetics, that can be con-tained in SBML model. But from the metadata point of view, BioPAX being an ontology, allows one to define the semantics of its elements in a richer way and more precisely than SBML.
2.3.2 Visualization formats
There are two packages developed for SBML level 3 that define the information needed for model visualization: layout and render. However, there exists a format especially targeted for model visualization: the Systems Biology Graphical Notation (SBGN) [Le Novère et al., 2009a]. It includes three orthogonal and complementary languages: the
18 Background
Process Descriptions [Moodie et al., 2011], the Entity Relationships [Le Novere et al.,
2011] and the Activity Flows [Mi et al.,2009].
The process description diagrams represent processes that convert physical entities into other entities, change their states or change their location. It is often used for the detailed drawing of metabolic networks. The entity relationship diagrams depict the in-teractions between entities and the rules that control them. Finally, the activity flows show the influence of biological activities on each other. They are very suitable for visu-alizing signaling pathways and gene regulatory networks.
In the SBGN Process Descriptions diagrams a metabolic model is represented as a graph: Reactions are visualized as square nodes connected by edges to round nodes rep-resenting their reactant and product metabolites. Figures1.3and1.4on page11show two networks presented in SBGN format.
In this thesis, we work with models in SBML format and use the layout package to store the model layout, and the groups package to represent the generalization of the model. For model visualization, we follow the SBGN Process Description language con-vention to choose the glyphs for model elements’ representation: Metabolites are drawn as circles linked by edges to the reactions where they participate; reactions are repre-sented as squares; compartments are drawn as rectangles. In Chapter3in order to de-fine the model generalization procedure, we introduce a model representation as a pair of sets: metabolites and reactions.
2.4 Metabolic network reconstruction and transformation
So far we have seen representations of metabolic models, and formats for conveying them. In this section we present some background of tools that manipulate models through their representations. Model reconstruction, the word used in the literature, is in fact the inference of a new model from existing knowledge (gene annotations, existing models, reaction databases, etc.) and new knowledge obtained experimentally. Model
transformation refers to modifying existing models, extending knowledge by deriving the
consequences of existing knowledge, in a way that guarantees the consistency of the re-sult.
Metabolic model reconstruction methods and tools are constantly becoming more and more advanced, and new ones are being developed. [Hamilton and Reed, 2014] provide a review of major software platforms for genome-scale metabolic network re-construction. Model reconstruction tools semi-automatically create a draft model based
2.4 Metabolic network reconstruction and transformation 19
on genome data, using existing reaction and pathway databases, and models for similar organisms.
Among the existing methods, Pathway Tools [Karp et al.,2002] can be considered the
de facto standard for de novo metabolic model reconstruction. The PathoLogic
compo-nent of Pathway Tools takes an annotated genome in a Genbank [Benson et al.,2014] format as input, and produces a new pathway/genome database (PGDB) as output. It re-trieves relevant reactions from the MetaCyc database [Caspi et al.,2012]. PathoLogic pre-dicts the metabolic pathways of an organism and prepre-dicts what genes code for missing enzymes within the predicted pathways. The Pathway/Genome Editor components can be used after for curation of pathways, genes and enzymes in the newly created PGDB.
The RAVEN Toolbox [Agren et al., 2013] takes a genome for the species of interest and uses existing models for related organisms and/or the KEGG database, coupled with extensive gap-filling and quality control features, to provide a draft metabolic network reconstruction. It uses the protein homology to detect the conserved reactions.
The Model SEED [Devoid et al.,2013] creates a draft model from a genome sequence using the manually curated Model SEED database. It requires users to annotate their genome using RAST [Aziz et al.,2008], a fully-automated service for annotating bacterial and archaeal genomes.
The SuBliMinaL Toolbox merges reactions and pathway available for a given organ-ism in KEGG and MetaCyc into a draft reconstruction. Existing metabolic models can also be incorporated into this process. The SuBliMinaL Toolbox is thus restricted to or-ganisms found in those databases.
All of the aforementioned methods are limited to single-species reconstruction. Com-parative ReConstruction (CoReCo) [Pitkänen et al.,2014] approach performs a simulta-neous genome-scale metabolic reconstruction of multiple related species and leverages on the growing availability of sequenced genomes.
There also exist various software facilitating combining of existing models. Various challenges arise while merging SBML models. They include syntactical requirements (e.g., uniqueness of identifiers in the resulting model, no multiple assignments to vari-ables, etc.), semantical problems (e.g., detection and merging of identical elements, de-tecting of biologically contradicting ones, such as overlapping compartments), and loops
of algebraic equations that must be avoided.
One of the pioneering work in this area was SBMLmerge [Schulz et al., 2006]. It addresses the merging challenges through the use of four subroutines: SBMLannotate, SBMLcheck, SBMLmerge and SBML2dot. SBMLannotate assists the user in annotation of model elements, and searches for possible annotations in various knowledge bases, e.g.,
20 Background
ChEBI, KEGG Compound, GO, etc. SBMLcheck performs various checks for model con-sistency: syntax check, annotation correctness and overlapping, consistency of mathe-matical rules, atom balancing in reactions. SBMLmerge combines the models, while de-tecting naming conflicts and conflicts between assignment rules. User is asked to solve those conflicts. SBML2dot plots the output model.
SemanticSBML [Krause et al.,2010] is a successor of SBMLmerge, it has focus on se-mantic annotations and in addition to sforementioned subroutines provides ones for cal-culating model difference, and for splitting SBML models.
Ontology Reasoning Engine for Molecular Pathways (OREMPdb) [Umeton et al.,2012] does not merge models into a new SBML model, but creates coherent ontologies out of different biochemical information sources. It consists of four modules: the data access
facility extracts pathway information from existing biological databases, the parser mod-ule extracts relevant information from models in different formats (i.e., XML, RDF, SBML,
CellML, etc.), the core module assembles this knowledge into a coherent ontology, finally, the logic module performs annotation of metabolites and runs automated comparison and identification of common metabolites and duplicate reactions. The duplicates are revealed to the user who should decide how to merge them.
PathCase-SB Model Composition Tool [Coskun et al., 2013] is another software for merging SBML models. It detects duplicated elements based either on user’s input or on names and annotations of the elements in the case of automatic mode. The models to be merged should be compatible in terms of their SBML Levels. If the elements are not detected to be identical, both of them are added to the resulting model (which includes, for example, overlapping compartments).
The aforementioned model composition tools are powerful in automatic detection of common model elements based on their names and metadata, in well-annotated mod-els. The automatic consistency checks are also well developed. However, the detected conflicts cannot be resolved automatically and require human expert’s intervention.
In this thesis work we present another model transformation approach: the model generalization. It is completely automatic and does not require human intervention, the generalization is intrinsic to the models and is completely defined by its structure and metadata. Finally, the generalization is abstraction of the model which implies the loss of some of the details available in the initial model, even though the link between the initial model and the generalized one is preserved.
2.5 Navigation in biological networks 21
2.5 Navigation in biological networks
A metabolic network can be represented as a bipartite graph [Diestel, 2012] with two disjoint sets of nodes: metabolites and reactions, and edges that connect the reactions to their substrate and product metabolites. In SBGN format, the metabolite nodes are drawn as circles, and the reaction nodes as squares (figures1.3and1.4).
Navigation in biological networks is essential to present the knowledge they contain in a way that helps the human user. As we have seen in section1.5, exploration can aid in the interpretation of networks, but can also aid in the curation task. Mimoza (chapter 5) identifies and visualizes shortcuts and meanders in the network, that may be infor-mative about errors in an inferred model, or about specifities of the modeled organism’s metabolism that are revealed through the inferred model.
While the navigation in large graphs in general is beyond the scope of this thesis, the navigation in the large-scale metabolic network graphs remains a challenge, due to the complexity of those networks. Genome-scale metabolic models include thousands of reactions that may participate in organism’s metabolism, e.g., 2 251 reactions in the metabolic network of the bacterium Escherichia coli [Orth et al.,2011], 2 352 reactions in the yeast 7 metabolic network model of Saccharomyces cerevisiae [Aung et al.,2013], 7 440 reactions in recon 2, a global human metabolism reconstruction [Thiele et al., 2013]), while human experts understand best small-sized networks, containing up to hundreds of nodes [Herman et al.,2000;von Landesberger et al.,2011].
2.5.1 Desktop visualization tools
There exist various modeling tools for metabolic networks that also support visualiza-tion. Desktop tools include CellDesigner [Funahashi et al.,2008], VANTED [Rohn et al.,
2012], and Cytoscape [Smoot et al.,2011]. They produce reasonably good visualizations of small networks (up to hundreds of reactions), but become cluttered at the genome-scale level, making the visualization unreadable.
2.5.2 Web-based visualization tools
Web-based tools allowing for metabolic network visualization are also emerging. JWS on-line [Snoep and Olivier,2003], for example, provides a mechanism for network visualiza-tion using a force-directed layout algorithm [Fruchterman and Reingold,1991;Tamassia,
2007]. It also encounters the aforementioned issues and thus is not capable of providing a readable representation for large networks.
22 Background
MetDraw [Jensen and Papin,2014] is an online tool for genome-scale metabolic model visualization, that makes use of decomposition of the model into compartments and pathways (if the pathway information is present in the model as a subsystem annota-tion of reacannota-tions) and duplicaannota-tion of minor metabolites. Metabolite duplicaannota-tion reduces clutter, but the huge number of reactions in the compartments of some models and miss-ing subsystem annotations, makes the visualization consume too much space and do not allow a user to grasp the essential structure of the network.
2.5.3 Zooming user interfaces
Due to the huge numbers of reactions and of metabolites participating in multiple reac-tions, we have an uncomfortable choice between either many edge crossings in an auto-matic visualization of a genome-scale network, or over-duplication of various metabo-lites making the essential parts of the network disconnected and the visualization too large to grasp. Therefore an approach different to a simple graph layout algorithm is nec-essary. Zooming user interfaces (ZUI), which can change the size and nature of the con-tent displayed at different zoom levels, provide a pertinent alternative. Two main types of magnification can be considered: geometric zooming, in which a region of the network is enlarged; and semantic zooming, in which additional properties are introduced with enlargement [Hu et al.,2007].
Semantic zooming was first introduced for biological data visualization in 1988 with Zomit [Pook et al., 1998], a generic application programming interface for developing servers for zoomable navigation and visualization, and illustrated with an example of ZoomMap, a prototype browser for HuGeMap human genome database [Barillot et al.,
1998]. The work by Jianlu and Laidlaw [Jianu and Laidlaw, 2013] evaluates geometric zooming with the Google Maps interface on five examples (a gene co-regulation visu-alization, a gene expression heatmap viewer, a genome browser, a protein interaction network, and neural projections), and describes a positive feedback provided by both domain experts and less experienced users. Another example of a Google Maps-based ZUI is X:map [Yates et al.,2008], a genome annotation database that supports zoomable data browsing. It does not use semantic zooming, but allows for showing/hiding layers with additional information (EST and GenScan predictions).
There exist several web-based tools that include a zoomable representation of metabolic networks. Genome Projector [Arakawa et al.,2009] is a zoomable genome map with mul-tiple views, including a pathway map. The pathway map is based on the Roche Biochem-ical Pathway wall chart available from the ExPASy proteomics server [Gasteiger et al.,
collec-2.5 Navigation in biological networks 23
tion of biochemically known molecules, enzymes and reactions. Genome Projector pro-vides a geometric zooming on the map and overlay layers to highlight reactions present in the organism of interest. The list of organisms is fixed to 320 bacterial genomes. The full Roche Biochemical Pathway map with the fixed layout is always shown, but only the reactions of interest (corresponding to the chosen organism) are highlighted.
NaviCell [Kuperstein et al.,2013] is a web environment that permits exploiting large maps of molecular interactions, including metabolic maps. It allows users to create their own maps, but does not provide a solution to the problem of huge network layout. The map creation is not fully automatic: The user must create a map in CellDesigner, export it as an image and partly manually edit it in a graphical designer to produce intermediate views (possibly with different level of details for semantic zooming). In addition, NaviCell permits a user to split the map into submaps called modules.
Another web-based tool, the Cellular Overview [Latendresse and Karp,2011] creates interactive diagrams for metabolic maps of organisms in the BioCyc database [Caspi et al., 2012]. It is pathway-oriented, and supports only geometric zooming. Another drawback is that it does not show the compartmentalization.
The Reactome pathway database [Croft,2013;Milacic et al.,2012] browser provides a zommable visualization of manually curated pathways for 19 organisms. It has two semantic zoom levels: a general representation of organism’s pathways (nodes repre-sent pathways, the edges connect the related ones); and submaps showing the details of each of the pathways, including compartmentalization. Several levels of geometric zoom are available on both semantic zoom levels. Reactome is pathway-oriented. Inside each pathway the layout is fixed: reactions, metabolites, and compartments common to two organisms have the same layout in corresponding representations. On the other hand, the positions and sizes of compartments might differ between pathways of the same or-ganism.
None of the ZUI tools for metabolic map representation described above, except for NaviCell, allow users to input their own models. Moreover, as these examples show, not only geometric zoom but also model decomposition and semantic zoom are important for multi-level visualization of huge models. At the general level, the network needs to be decomposed into several meaningful modules (such as compartments, pathways). If after such a decomposition the model remains complicated (e.g. the mitochondrial com-partment of the yeast consensus model [Herrgå rd et al.,2008] containing 230 reactions), a further decomposition is required.
We address these issues in Chapter5by introducing a model navigation tool Mimoza that combines the model generalization method and compartmentalization for model
24 Background
Chapter 3
Knowledge-based generalization of
metabolic models
3.1 Introduction
In this chapter we focus on the second level of abstraction of metabolic networks, that represents the modules inside compartments.
A fair amount of work has been done on identifying reusable modules. These ap-proaches can be divided into two groups: series and parallel. A series approach operates on chains of reactions, and generalizes them as a series, consequently hiding the struc-ture of the network. An example of a series approach is representing the network as a set of metabolic pathways (KEGG [Kanehisa et al.,2012], MetaCyC [Caspi et al.,2012]), that can be further divided, for example, into reaction modules (conserved sequences of reactions along the metabolic pathways) [Muto et al.,2013].
The other type of approach operates on reactions that are parallel, keeping the steps and preserving the general view of the network. An example of this approach is grouping reactions based on EC (Enzyme Commission) numbers [Tohsato et al.,2000]. The draw-back of this approach is that it is not applicable to networks with no EC numbers assigned or reactions with no catalysing enzymes identified. We have developed another parallel-reaction method for knowledge-based generalization of metabolic models [Zhukova and Sherman,2014a], which does not depend on enzyme information. It provides a higher-level view of a model while keeping its essential structure and omitting the details.
Definition 1 The model generalization process groups metabolites present in the model
into equivalence classes, and merges each class into a generalized metabolite. Reactions that involve same generalized metabolites are then factored together into a generalized

![Fig. 4.3 Generalization of β -oxidation of fatty acids of MODEL1111190000 (Y. lipolytica, curated network from [Loira et al., 2012])](https://thumb-eu.123doks.com/thumbv2/123doknet/14525475.722926/68.892.168.748.420.1020/generalization-oxidation-fatty-model-lipolytica-curated-network-loira.webp)